Control Decision Rule for European Chafer (Coleoptera:
Scarabaeidae) Larvae Infesting Turfgrass
J. P. NYROP, M. G. VILLANI, ANDJ. A. GRANT]
Department of Entomology, Cornell University, New York State Agricultural Experiment Station, Geneva, NY 14456
Environ. Entolllol.24(3): 521-528 (1995)
ABSTRACT A control decision rule for European chafer, RhizotrogllS (Amphimallon)
IIUl-jillis(Hazonmowsky), larvae infesting turfgrass was developed using data from 317 residential sites. Larvae were often abundant enough to cause damage to turf in portions (patches) of properties when average density over an entire site was much less than a damage threshold of ,'5-10 grubs per 950 cm2. To account for this, an empirical relationship between the size of
til(' largest patch of European chafer larvae at a site and site-wide density was uscd in the development of the decision rule. Propelties with a patch of grubs in excess of =.30 m2 were
deemed to require insecticide treatment. Site characteristics (lawn age, shade, and percentage of Kentucky bluegrass) were related to site-wide density and this relationship was used to formulate a lisk assessment system. This system is used to determine whether a site should be sampled or not. Properties that are not sampled are not to be treated. Other treatment decisions are based on the outcome of sampling. The relationship between site-wide density and patch size did not allow clear identification of a density that could be used as a threshold in a sampling program. Therefore, several sampling plans were constructed that classified density according to different threshold values. Operating characteristic functions were used in combination with the aforementioned relationship between density and patch size to cal-culate two types of en'ors for each sampling plan: the probability of not treating when treat-ment was necessary and the probability of treating when treattreat-ment was not required. Based on these error functions, a threshold of 0.25 grubs per ll-cm diameter turf plug was advo-eated. USl' of the proposed control decision rule should result in few treatment errors but conld lead to considerable reductions in pesticide use.
KEY WORDS sampling, decision making, turf pests
IN TilE NORTHEASTERNUnited States, turfgrass is attacked by a complex of scarab species including the Japanese beetle, Popillia japonica Newman, the European chafer, Rhizotrogus (Amphimallon)
1I!aja/is (Razoumowsky), and the Oriental beetle Exo1l!ala orientalis (Tashiro 1987). These scarab grnbs can be controlled by one well-timed insec-ticide application; however, one or two treatments an' usually made prophylactically or in response to turf damage. Despite the existence of damage thresholds (Tashiro 1987, Shetlar et al. 1990) grub populations are seldom assessed before treatment decisions are made.
Pt'st control decision rules (Binns & Nyrop 1992) can be used to rationally schedule pesticide use. These protocols consist of at least two com-ponents and may include a third: a procedure for assessing the density of the pest population, an economic or action threshold, and a phenological forecast which is often needed to determine the appropriate time to measure population density.
IInt<'p;ratt'dPt'st Manap;ement Prop;ram, Comell University, Nt'w York State Ap;riclIltllraJExperiment Station, Geneva, NY
14456.
By using effective pest control decision rules, man-agers can restrict the application of pesticides to those situations where high pest densities warrant their use. This is especially important when con-sidering control of turfgrass pests because indis-criminate and excessive use of pesticides might ex-pose large numbers of humans to biologically active chemicals.
Even though there is a clear need for control decision rules for scarab larvae in turf, none are currently in use and little work has been devoted toward developing such protocols. There are only three published articles that report on this subject. Burrage & Gyrisco (1954) found populations of European chafer grubs to be clumped in pastures in New York and determined that square-foot dig-gings were more efficient than larger sampling units. Ng et al. (1983a, b) fit negative binomial dis-tribution models to counts of Japanese beetle grubs in square-foot sample units and constructed a sequential classification sampling plan based on these models.
The information these studies convey is not suf-ficient for developing control decision rules for
522 ENVIRONMENTAL ENTOMOLOGY Vol. 24, no. 3
scarab grubs. At first glance this is not obvious. Pest management decision rules are usually based on classifying density with respect to a threshold using sampling plans constructed by characterizing sampling experiments by way of empirical or prob-ability distribution models (Nyrop & Binns 1991). Economic thresholds for scarab grubs in turfgrass are generally considered to be 5-10 per 950 cm2
(Tashiro 1987). Knowing this and the sampling dis-tribution for counts of scarab grubs, it would seem to be very straightforward to construct a control decision rule. However, scarab grubs are patchily distributed and it is often the case that when the number of larvae exceed densities that cause dam-age, they do so only in portions of a site and the overall mean density is much below a damage threshold. Because it is necessary to control larvae in patches with high density, mean density by itself is not a suitable parameter for use in a control decision rule. Although it is certainly possible to sample a site sufficiently to map patches with high grub densities, this is too costly for wide scale use. A different approach would be to use data from a site to indicate whether the property was likely to harbor patches with high grub densities and treat the entire site accordingly. This has the disadvan-tage that entire sites are treated when only a por-tion of the site requires control. However, provid-ed that only a modest portion of sites require any control at all, use of this type of decision rule would still lead to greatly improved pesticide use compared with prophylactic treatments. Further-more, such a rule might achwlly be used by prac-titioners, whereas decision rules that require inten-sive mapping of grub densities will almost certainly be shunned because of the high cost of their im-plementation. In this article we describe a pest control decision rule for European chafer that is based on the paradigm of using site-specific data to indicate whether high density patches of grubs are likely to be present.
Materials and Methods
We collected data from 317 residential lawns near Rochester, NY, for use in formulating the de-cision rule. Two types of data were collected at each site; counts of grubs along a grid placed over the property and estimates of variables that de-scribed the site. Sites were sampled during the 1st and 2nd wk of September 1990 when European chafer were in the third instar.
European chafer grub densities were mapped at each site by counting grubs in samples collected at regular intervals from throughout the property. Samples were located along a grid with 3 m be-tween sample locations. Each sample consisted of l1-cm diameter plugs cut from the turf to a depth of 10 em. All grubs in the soil were collected by removing soil to this depth. The l1-cm plugs were used in lieu of the more conventional square-foot sample unit because preliminary studies showed
the plugs were easier to collect, provided as much sample information as the square-foot sample unit, and caused less damage to the turf. The number of samples per site ranged from 20 to over 180, depending on tlle size of the property.
When the grubs were sampled, sites were de-scribed by determining lawn age (:=;20or >20 yr) and estimating grass species composition, soil type, slope, thatch content, and percentage of shading. Values for each of the variables other than lawn age were categorical estimates subjectively select-ed from one of three possible choices. We pur-posefully collected these data in this apparently ca-sual manner because we wished the data to be representative of what lawn care specialists would be able to collect. Percentage of shade «30, 30-60, or >60%) and slope (level, sloping, or low ly-ing) were estimated by overall assessment of the property. Grass species composition «30, 30-60, and >60%) was determined by examining the turf at five or more sites on tlle property; however, vari-ability among sites and the numbers of samples taken were not recorded. The amount of thatch present «1.5, 1.5-2.5, or >2.5 em) and soil type (clay, loam, or sand) was determined by examining five or more cores removed from the soil profile.
The control decision rule was developed using the following four steps: first, counts of grubs were used to determine whether there was a relation-ship between average grub density and the size of patches of grubs as well as the density of grubs in a patch. From preliminary examination of the data we knew that there were often cases where the average density of grubs was low, but there existed a smaller area on the property (a patch) where grubs were relatively abundant. If a relationship between property-wide density and density in a patch or patch size, or both existed, we intended to exploit this pattern in the decision rule.
In the second step, site description data were used to determine whether there was a relation-ship between some or all of these variables and site-wide gmb density. If such a relationship oc-curred we planned to use site characteristics to classify a property as either requiring sampling or not requiring sampling. If no samples were need-ed, no pesticide would be applied for control of European chafer. If sampling was required, the de-cision to treat or not treat the site for European chafers would depend on the outcome of sampling.
Next, counts of gmbs were used to construct models that could be used to describe sampling experiments. These models are required to assess the performance of sampling plans used in control decision rules (Nyrop & Binns 1991) and consisted of Taylor's (1961) variance-mean model and Pois-son and negative binomial probability models.
Finally, control decision mles based on double sampling plans (Nyrop & Wright 1985) were for-mulated and tlleir performance was evaluated. Each of these steps will now be described in more detail.
Density-Patch Relationship. European chafer larvae are capable of causing economic inju!)' to turf when their density exceeds 5-10 per 950 cm2
(Tashiro 1987). This translates to =0.5-1 gmb per ll-cm plug. When we began to examine the sam-ple data, it quickly became apparent that there were areas of lawns where average European cha-ft'r larval density exceeded one per plug; however, the average density throughout the property was much less than one per plug. From a lawn care perspective, it is important to treat patches of turf in which European chafer grub density exceeds one per ll-cm plug. Based on our experience, we defined a patch of European chafer larvae neces-sitating treatment to be four or more contiguous sample locations having one or more larvae per plug. Thus, with our definition, properties with European chafer populations requiring control were those where four or more adjacent sample sites yielded one or more chafer larvae. As a result, a control decision rule for European chafer larvae inft'sting residential lawns must be able to accu-rately and parsimoniously identify properties where larval densities exceed one per ll-cm plug in patches of 27 m2 or more.
We hypothesized that there would be a relation-ship between the size of the largest patch on a property, average density of European chafer lar-vae in the patch, and the average density of Eu-ropean chafer throughout the entire property. We used the number of contiguous sample locations with one or more gmbs as an estimate of patch size. If the hypothesized relationship existed, then average gmb density from throughout a site could be used to predict whether there was a patch of gmbs with average density in excess of one per plug. Use of average density from throughout a property as a decision criterion would allow appli-cation of well-developed sampling tools. The only alternative would be extensive mapping of gmb density at a site; an impractical altemative. To de-termine whether a relationship existed between patches of gmbs and average density of gmbs, we plotted patch size (I}) against average density (x) and used the size of the symbol plotted for each data point to represent density in the patch.
Risk Rating Model. The data on site
character-istics were used in a forward stepping analysis of variance (SYSTAT 1992) to determine whether there was a relationship between some or all of these variables and average gmb density per plug. Factors were added to the model based on an F value with P :s 0.05. The forward-stepping proce-dure identified age of the Im.vn, percentage of shade, and percentage of Kentucky bluegrass as significant predictors. A new model consisting of these factors and first-level interactions was then fit to the data again using the forward-stepping procedure. None of the interactions were signifi-cant: Based on these results, we constructed a risk rating system wherein the age of the lawn, per-centage of shade, and percentage of Kentucky
bluegrass were used to classifY properties into two groups; those that would not be sampled and not treated and those where a treatment decision would be based on the outcome of sampling.
Sampling Experiments. Counts of European
chafer larvae were used to compute means (m) and variances (S2) for each property. These estimates were then fit to the model S2= amb (Taylor 1961)
by using logarithms to linearize the model and es-timating parameters by way of linear regression. Data from 38 properties were used to determine whether counts of grubs in ll-cm plugs could be described by Poisson or negative binomial distri-butions. These 38 data sets were used because at least 100 samples were taken at each of these prop-erties and they represented a wide range of gmb densities. The computer program Discrete (Gates et al. 1987) was used to fit the data by way of maximum likelihood to the models. A chi-square test (a = 0.0.5) was used to measure significant departure of the counts from the two discrete probability models.
Control Decision Rules. Sampling procedures
used to determine whether a pest population re-quires control usually claSSify density with respect to a threshold value and most often are sequential (Kuno 1991, Binns & Nyrop 19H2). Two deficien-cies of sequential classification procedures may ob-viate their use. First, because density can be clas-sified and sampling curtailed after each sample is counted, there is no guarantee that samples from throughout a particular site will be taken before sampling is terminated. Second, determination of the performance of sequential procedures requires that sample counts can be described by probability distribution models and such models can not al-ways be fit to the data. The need to describe sam-ple counts using probability distribution models was not an obstacle in this case; however; when sampling European chafer larvae, we felt it imper-ative that a representimper-ative sample be taken from throughout a property before density was classi-fied. Because of this need we devised a sampling protocol based on double sampling (Nyrop &
Wright 1985).
To constmct a double sampling plan two hy-potheses concerning mean density (m) and a threshold value (T) are constructed: Ho: m :S T and H]: m
>
1~Asample ofnl observations is taken.If the mean (m]) of this sample is less than or equal to some A, Ho is accepted. A satisfies the condition
A
<
T If m] ;;::R, Ho is rejected. R satisfies thecondition R
>
T The mean is compared with A and R as opposed to T to guard against incorrect classification of the population when the sample size is nl' If A<
ml<
R, another sample of n2observations is taken and a mean computed. If [(n]ml
+
n2m2)/(nj+
n2)] :S T, lIo is accepted.Otherwise, Ho is rejected.
Performance of any sampling plan that classifies density with regard to a threshold is judged by the operating characteristic (OC) and average sample
524 ENVIRONMENTAL ENTOMOLOGY Vol. 24, no. 3
and
ETA = PRC - Pr[treatlneed treat] (3)
ETB = [1 - PRC]
- Pr[no treat
I
not need treat]. (4)10.00
o
1.00 o 0.10,:~o
o
oocU
~
• 0 0 o~o;,o
- - - - o.«O~-
-•• ~-•• ~O 0.01 100 r--r--.-rT""...,.,nr-~~-r-,...,..,..TTTT.-...,-"T"""""'~'TTTT1
Symbol size indicates patch mean
• 1 o 2
0
3.7 (]) N 'iii'£
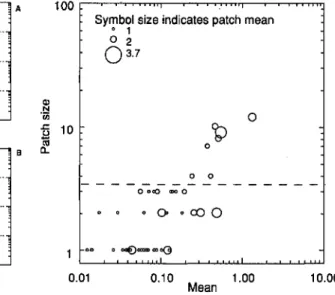
10 I1l a.. MeanFig. 1. Relationship between patch size (y-axis), av-erage grub density in the patch (symbol size), and avav-erage gmb density over an entire property (x-axis). The dashed line separates properties that require control of Ellropean chafers from those that do not.
Results
Density-Patch Relationship. Patch size and
European chafer larval density in the patch in-creased as site-wide grub density inin-creased with the patch size-density relationship being most pro-nounced (Fig. 1). Thus, mean density over the en-tire site might be used to predict whether a prop-erty is likely to harbor a patch of European chafer larvae that requires control. The tentative nature of this conclusion stems from the need to juxtapose the pattern evinced in Fig. 1 with OC functions for sampling plans that might be used. This will be discussed shortly.
The properties shown in Fig. 1 are separated by a dashed line into those on which European chafer required control (29.2%) and those where no con-trol was needed. Recall that this distinction is the two, the conditional probability of treating when treatment is necessary is calculated as
Pr[treatlneed treat] = [1 - OC]*PRC. (1) The conditional probability of not treating when no treatment is warranted is calculated as Pr[no treat
I
not need treat] = OC*[1 - PRe]. (2) Using these two conditional probabilities, the type a and b errors arenumber functions (ASN). The OC specifies the probability of accepting the null hypothesis given any true mean and the ASN the expected number of samples required to reach a decision. OC and ASN functions for double sampling plans can be computed analytically (Nyrop & Wright 1985) or using simulation (Nyrop & Binns 1991). We esti-mated these functions by way of simulation by us-ing a negative binomial distribution with variable
k to model sampling. We set nl and n2 to 20 and
A and R were determined as 90% confidence half limits about the threshold T when a sample size of 20 was used. A minimum sample size of 20 was selected because we felt this would be the mini-mum number needed to obtain a representative sample from most home lawns. If a second sample was required, an additional batch of 20 plugs was specified because we felt it would be just as im-portant to take the second set of samples from throughout the property before classifying density. Ninety percent confidence intervals were used for A and R because we felt acceptable OC and AS~ functions were produced using these values. The variance was modeled as a function of the mean using Taylor's (1961) variance-mean model and k of the negative binomial distribution was then specified asm2/(s2_m). Estimates of OC and ASN functions were based on simulating sampling 1,000 times for a range of mean densities.
The plot of patch size against site-wide density indicated a threshold density should be in the range of 0.1-0.35 grubs per ll-cm plug. However, it was not clear from these data what the threshold should actually be. Therefore, we constructed sam-pling plans for thresholds of 0.1-0.35 in incre-ments of 0.05. As an aid in selecting a threshold and associated sampling plan to use, we developed two error functions that we call type a and type b errors. Type a error describes the proportion of sites for which a decision to treat should have been made but was not and type b error describes the proportion of sites for which a decision to not treat should have been made but was not. Both errors are expressed in terms of site-wide mean density. Recall that properties requiring treatment are those for which there was a patch of grubs with an average density of one grub per plug over at least 27 m2 of contiguous area.
Type. a and type b errors are computed from the OC function and an empirically derived function that describes the proportions of sites requiring control (PCR) in relation to site-wide mean den-sity. Another way of interpreting the PRC is as the probability of a site harboring a patch of grubs re-quiring control given the site-wide grub density. The PRC was estimated by determining the pro-portion of sites requiring control for intervals of property-wide mean density and then fitting a lo-gistic function by way of a Simplex algorithm (SYSTAT 1992) to these estimates. Using the PRC and OC functions and assuming independence of
10.000"'--'--'--""--'-
,--,--,--.---.r--.--"
A :5:20 yrs old ?;> 1.000 'iij c:•.
ffi 0.100•.
:::li 0.010 o ..: ... -.. . ···.s:-····&>.i,···ft···•
:',,;~
")~
if.
~
...;
~
,
~
;•..···....;i
·i1..
···:;r·
OD.
:" I D. 00. \" 0~
...•...Symbol size indicates patch mean
• 1 o 2
0
3.7 Q) N 0.001'---'V-- •.••...--+ ••...-ol.~-'--"--_-.,p...--'---' 'iii 2 3 4 5 6 7 B 9 .r= 10 Risk ~ 10.000r--r--,--r--.-,--r--r--,---r---->! B Cl.. > 20 yrs oldo
'P
o ?; 1.000 '",m
1:l 0.100 c:••
•.
:::li 0.010'.
... ·t··· .. ···.••.... :.; ... :.~...'~:a'.~ .:..~;::...:~.:...
.
.
o 0 00<0 ClIO0 • ~"""'0(9Risk Shade Kentucky BluB Qrasss 1 >60% <30% 2 >60% 30·60% 3 3CHlO% <3D'll. 4 30-60% 3CHlO% S >60% >60% 6 30-60% >60% 7 <30% <30% 6 <3D'll. 30·60% 9 <3D'll. >60%
Fig. 3. European chafer grub populations on prop-erties excluded from sampling based on risk assessment. Thirty-eight properties on which no grubs were found were not plotted. The dashed lines separates properties into a group that should be treated (above the line) and a group that should not be treated.
2 3 4 5 6 Risk 7 6 c 9 0.01 0.10 Mean 1.00 10.00
Fill:'2. Densities of European chafer lalVaeon prop-t'rtit's assigned risk values of 1through 9 and having lawns:520yr old(A)and>20 yr old(B).Levels of shade and Kentucky bluegrass corresponding to each of the nine l"isklt'vels (C).
based on properties having a patch size of four or Illore. There is no site-wide density that clearly separates properties into those where intervention is needed and those where no control is warranted. All that can be said at this point is that a threshold Illust lie in the range of 0.1-0.35 grubs per ll-cm plug. A threshold >0.35 would allow too many sites with large patches of European chafer larvae to go untreated and a threshold <0.1 would result in too many properties receiving unnecessary in-secticide trea,tments. We will return to the ques-tion of selecting a threshold after presenting OC functions for prospective sampling plans.
Risk Rating Model. The site factor model
ex-plained 21% of the variation in site-wide European chafer larval density. Site characteristics of age (F
::= 20.26, df
=
1, 296), percentage of shading (F=
9.56, df = 2,296), and percentage of Kentucky bluegrass (F
=
18.22, df=
2, 296) were identified as signific<mt predictors of gmb density. Because there were no interactions among the three fac-tors, we constructed a risk classification for each of the two age groups based on the ordering of mean density for each combination of percentage of shade and percentage of Kentucky bluegrass (nine Ipvels). The levels of shade and Kentucky bluegrass for each of the risk categories one through nine are provided in Fig. 2. Also shown in this figure are mean densities of European chafer larvae onsites identified according to the two age classes and nine risk levels. The densities shown have 0.001 added to them to allow plotting on a logarithmic scale and these values were jittered (SYSTAT 1992) to avoid very similar values from being overlayed.
As stated previously, an action threshold for Eu-ropean chafer gmbs must be in the interval of
OJ.-0.35 larvae per ll-cm plug. With this range in mind, we chose risk values of l-3 for lawns $20 yr in age and 1-4 for lawns older than 20 yr to signal that no sampling need be done. The prop-erties that were excluded from sampling based on this risk assessment and that had densities greater than zero are shown in Fig. 3. Only 7 properties of 315 (2%) were erroneously classified. However, use of the risk rating system would have obviated the need for sampling on 26% of all the properties. It is important to note that not all high risk sites have high density European chafer populations so one can not infer that all high risk sites should be treated.
Sampling Experiments. Taylor's (1961)
vari-ance-mean model provided a good description of the relationship between the variance and mean of European chafer larval counts (Ina
=
0.245, SE=
0.04; b
=
1.056, SE=
0.018, mean square error=
0.113, r2=
0.929). When fit to Poisson andneg-ative binomial probability distribution models, 10 of the 38 data sets used in the analysis were de-scribed by a Poisson model, 12 by a negative bi-nomialmodel, and II were equally well described by both Poisson and negative binomial models. Five data sets could not be described by either the Poisson or negative binomial distributions. We at-tempted to fit positive binomial and Neyman type
526 ENVIRONMENTAL ENTOMOLOGY Vol. 24, no. 3 0 2 3 4 Mean 100.00 I 0 B 0 10.00
~
k 00 1.00 ~ 00 08 8
0o
0.10 0 Poisson Negative binomial Poisson and Negative binomial neither Poisson or Negative binomial no fit 0.01o
T
00 881000 00 o 00o Mean 2We felt use of the Poisson distribution in the
sim-A ulations would lead to an overly sanguine picture of errors that may result from use of the sampling plans or unrealistic estimates of required sample sizes.
The parameter k of the negative binomial dis-tribution often shows dependency with the mean, and this was the case for the European chafer grub counts. As a result, simulations of sampling should incorporate changes in k due the mean. Taylor's variance-mean model can be used for this purpose by computing the variance as a function of the mean and then computing k using the method of moments. Maximum likelihood estimates of k ob-tained from the data are portrayed in Fig. 4B along with k calculated using the variance-mean model. At low densities, predicted values of k were greater than the maximum likelihood estimates, whereas at higher densities predicted values of k were less than the maximum likelihood estimates.
Discrepancies between predicted and estimated values of k should have at most minimal effect on the estimated performance of the sampling plans. This is because we have used a double samphng protocol with a sample size of 20 for each batch of samples that are processed. With this sample size, the central limit theorem can be invoked and the sum of grubs found will be approximately normally distributed. Therefore, the precise distribution of individual observations is less important than if a fully sequential sampling plan was being evaluated.
3 Control Decision Rules. Stop boundaries for the double sampling plans were calculated as
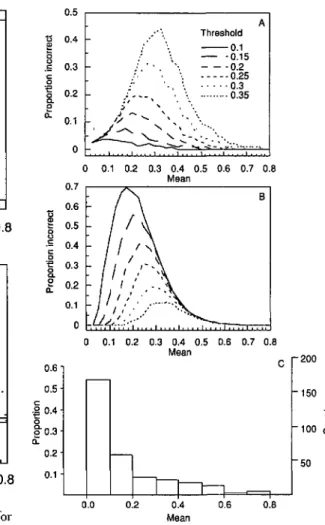
The OC and ASN functions for sampling phms with thresholds (T) of 0.1-0.35 grubs per plug are illustrated in Fig. 5. The expected number of sam-ples required to reach a decision are near the max-imum for densities close to the thresholds. None-theless, the double sample plans would save sampling resources compared with always using a fixed sample size of 40. Also shown in the figure with the OC functions are the empirically derived proportions of sites that require control as well as the PRC function fit to these data. Recall that sites deemed requiring control have patches of grubs with a density of at least one per 11-cm plug over a minimal area of 27 m2.
The OC and PCR functions were used to cal-culate type a (proportion of sites requiring control and not treated) and type b (proportion of sites needlessly treated) errors (Fig. 6). For the thresh-olds used, type a errors are always greater than type b errors. Type a errors increase as the thresh-Fig. 4. Distribution of means for sets of European
chafer grub counts fit to negativebinomialand Poisson distributionmodels(A).Maximumlikelihoodestimatesof k for the negativebinomialdistribution(circles)and val-lies predicted using a variance-mean model (line)(B). and
A distributions to these sets of counts. Neither of these two models could be fit to two of these five data sets. One of the remaining three data sets were described by the positive binomial and two by Neyman type A distributions. It should be not-ed that the Neyman type A could be usnot-ed to de-scribe 24 of the 38 data sets; however, the Poisson or negative binomial models are preferred because they are easier to work with. There was no dis-cernible pattern in the means for data sets de-scribed by the different probability models (Fig.
4A).
We selected the negative binomial distribution to describe counts of European chafer larvae in 11-cm plug samples instead of the Poisson distribu-tion because variances for the negative binomial distribution are larger. As a result, simulations in which random variables are generated according to a negative binomial distribution and are used to measure the performance of sampling plans' will indicate that the plans are less precise than if sim-ulations were based on the Poisson distribution.
A=T-R=T+
(5)
200 150 "E :> 100
8
50c
0.8 A B 0.6 Threshold --0.1 - '0.15 - - -0.2 . - - -·0.25 .' ... 0.3 ·· .. ·..··0.35 0.4 Mean 0.2 "' J ••.•• i~ - " ' ....::
0<~~>
, .
0.1 0.2 0.3 0.4 0.5 0.6 0.7 0.8 Meano
0.1 0.2 0.3 0.4 0.5 0.6 0.7 0.8 Mean 0.0 0.1 0.7 0.6 U ~ 0.5 o .5 0.4 c o'5
0.3 a.£
0.2 0.1 0.5 tJ 0.4 e!8
0.3 .5 c 0 'E 0.2 8. 0 Q: 0.1 0 0.6 0.5 c ~ 0.4 o g-0.3 Q: 0.2Fig. 6. Type a (A) and type b (B) errors for sixdouble sample plans used to classifYEuropean chafer popula-tions with regards to a threshold and the distribution of sample means for 317 properties sampled (C).
A B
o
Threshold --0.1 - -0.15 - - -0.2 " - - - 0.25 \ " , .. . .... 0.3 ,', " ... ···0.35 \ ~",,
-.
~
'-
::...~:...~
_.~..
_...
~-_
.... 0.1 0.2 0.3 0.4 0.5 0.6 0.7 0.8 Mean,-" ~'.-;"'~-'::'<'''>''
/ I ' , " '. '.,",'
...
\'
"
'.' ",,.
".,
"
': , ,...
, ::'
\'
".
,
~
.~
'. I• :' '\,':....
"---
'\... ,
o
15o
0.1 0.2 0,3 0.4 0.5 0.6 0.7 0.8 Mean 40 30 35o
20 0.8 0.2z
en
«
25Fig. 5. Operating characteristic (QC) functions for four double sample plans and the proportion of sites re-quiring control (A).The fitted line is calculated as1/[1
+
l'xp(4.089-15.029x)]. Average sample number (ASN) functious for four double sample plans (B).~
;: 0,6
~
.c
£
0.4old increases and type b errors decrease with in-creasing threshold values.
To interpret fully the influence of these error rates on decision JUle performance, it is helpful to know the likelihood that a particular grub density will be encountered at a site. For example, type a and b errors are maximum for densities close to the threshold. This result is more important if many sites that might be sampled are likely to have European chafer larval densities close to the threshold values and the result is less significant if gJUb densities close to the threshold are rather un-likely. We used data from the 317 properties sam-pled to estimate the likelihood of various intervals of site-wide gJUb densities and expressed these re-sults as a histogram (Fig. 6).
A risk averse manager might choose a sampling plan based on a low threshold to reduce type a ('[rors and a manager averse to applying pesticides needlessly might choose a sampling plan based on a high threshold. We opted to approximately bal-~Ulcetype a and b errors and recommend use of a
threshold equal to 0.25 grubs per ll-cm plug, For this threshold, the maximum type a and type b errors are "='0.2 and 0.3, respectively. Howcver, these relatively large error rates occur over a nar-row range of mean densities. Furthermore, assum-ing that the distribution of mean densities that we recorded in 1990 are representative of other years and other areas, the mean densities for which max-imum error rates occur are not exceedingly likely.
Discussion
In this article we developed and analyzed the performance of a control decision rule for Euro-pean chafer larvae infesting residential turf lawns. The decision mle functions in two steps. First, the age of the lawn, percentage of shading, and the percentage of the turf that is Kentucky bluegrass is determined. Based on these estimates, the site is classified as either requiring no sampling and no treatment or the site should be sampled and a treatment decision based on the outcome of
sam-528 ENVIRONMENTAL ENTOMOLOGY Vol. 24, no. 3
piing. Provided the data used to develop the risk assessment system are indicative of patterns that will be found at other times and locations, using this system can save sampling resources and the likelihood ?f erroneously categorizing the site as not needing sampling or control is low.
The risk assessment system is the most tenuous aspect of the control decision rule because data on which it is based only span a single year and single location. From a practical perspective, the risk as-sessment system need not even be used and all sites can always be sampled. On a more conceptual footing, our ability to devise a risk assessment pro-tocol for incorporation in a control decision rule should catalyze further work in this area. An ob-vious next step is to collect more data to make the system more robust.
The second step in executing the control deci-sion rule is to sample the population of European chafer larvae. This is done by extracting 20 ll-cm plugs from throughout the site and counting the number of grubs found. If the total is ::;20
*
A or 2::20*
R, sampling is terminated and an appropri-ate decision is made. Otherwise, 20 additional plug samples are collected and the total grubs found in the two batches of plugs is compared with 40*
Tand a decision is made.
This sampling plan is based on our expert opin-ion concerning what constitutes a patch of grubs that warrant treatment, the relationship between patch size and site-wide density, and the distribu-tion of counts of grubs from ll-cm plug samples. The least important of these and also the best known is the distribution of counts of grubs. This paradox is not unique to the case at hand but prob-ably applies to most pest control decision rules. The relationship between patch size and site-wide density is crucial, the data set used to describe this relationship is large, and the pattern evinced is probably robust. It is of course possible that dif-ferent environmental conditions will produce a dif-ferent relationship, but we think this is unlikely. Of primary importance is what constitutes a patch of European chafer grubs that necessitates control. There are two aspects to this question. First, is an area of ""30 m2 with a density of grubs putatively
capable of causing economic injury indicative of the need for insecticide treatment? Second, with what precision did our data identify sites that meet this condition? Additional research will be re-quired to answer these questions. To address the first query, property owner tolerance for different sized areas of grub damage to turf needs to be
assessed. To answer the second question, grub densities must be mapped at a finer spatial scale (e.g., every meter) than was done in the study re-ported herein and these data used to determine whether samples spaced at intervals of 3 m cor-rectly identify the existence of patches of Euro-pean chafer larvae.
Despite these questions, we feel the decision rule presented here can be used effectively to schedule pesticide applications directed at Euro-pean chafer larvae. The paradigm used to con-struct this decision rule should also prove useful for building decision rules for other soil inhabiting pests of turfgrass.
References Cited
Binns, M. R. & J. P. Nyro() 1992. Sampling insect populations for the purpose of IPM decision making. Annu. Rev. Entomo!. 37: 427--453.
Burrage, R. H. & G. G. Gyrisco. 1954. Distribution of third-instar larvae of the European chafer and the efficiency of various sampling units for estimating their populations. J. Econ. Entomol. 47: 1009-1014. Gates, C. E., F. G. Ethridge &J. D. Geughan. 1987. Fitting discrete distributions. User's documentation for the FORTRAN computer program DISCRETE. Texas A&M University,College Station.
Kuno, E. 1991. Sampling and analysis of insect pop-ulations. Annu. Rev. Entomo!. 36: 285-304.
Ng, Y. G., J. R. Trout & S. Ahmad. 19830. Spatial distribution of the larval populations of the Japanese beetle (Coleoptera: Scarabaeidae) in turfgrass.
J.
Econ. Entomo!. 76: 26-30.
1983b. Sequential sampling plans for larval popula-tions of the Japanese beetle (Coleoptera: Scarabaei-dae) in turfgrass. J. Econ. Entomo!. 76: 251-253. Nyrop, J. P.&M. Binns. 1991. Quantitative methods
for designing and analyzingsamplingprograms for use in pest management, pp. 67-132. In D. Pimentel [ed.], Handbook of pest management in agriculture, vol. III, 2nd ed. CRC, Boca Raton, FL.
Nyrop, J. P.&R. J. Wright. 1985. The use of double sample plans in insect sampling with reference to thc Colorado potato heetle LeptillOtarsa decemlineata (Say). Environ. Entomo!. 14: 644-649.
Shetlar, D. J., P. R. Heller &P. D. Irish. 1990. Turf-grass insect and mite manual, 3rd ed. Pennsylvania Turfgrass Council, Bellefonte, PA.
SYSTAT. 1992. SYSTAT:statistics,version 5.2 ed. SYS-TAT,Evanston, IL.
Tashiro, H. 1987. Turfgrass insects of the United States and Canada. Cornell University,Ithaca, NY. Taylor, L. R. 1961. Aggregation, variance, and the
mean. Nature (Land.) 189: 732-735.
Received for publication 15 April 1994; accepted 5 De-cember 1994 ..