and Why: The View from Trade
Kishore Gawande, Pravin Krishna,
and Marcelo Olarreaga
Abstract Policymaking power enables governments to redistribute income to pow-erful interests in society+ However, some governments exhibit greater concern for aggregate welfare than others+ This government behavior may itself be endogenously determined by a number of economic, political, and institutional factors+ Trade pol-icy, being fundamentally redistributive, provides a valuable context in which the welfare-mindedness of governments may be empirically evaluated+ This article inves-tigates quantitatively the welfare-mindedness of governments and attempts to under-stand these political and institutional determinants of the differences in government behavior across countries+
Although all governments are endowed with policymaking powers to redistribute income to powerful interests in society, some governments exhibit greater con-cern for aggregate welfare than others+ Government behavior may itself be endog-enously determined by a number of economic, political, and institutional factors+ For instance, in the presence of a weak system of checks and balances or a low level of political competition, it may be easier for governments to redistribute resources toward those special interests they favor+ It is the goal of this article to study quantitatively the relative welfare-mindedness of governments in a large sam-ple of countries and to try and understand the differences in government behavior across countries using economic, political, and institutional factors+
We proceed in two steps+ The first step is to quantify the extent to which gov-ernments are concerned with aggregate welfare relative to any other private inter-ests+ This requires data in which the redistributive powers of governments are inherent, and which reflect the particular tradeoff between aggregate and private interest+ In our analysis, we use trade policy determination as the context in which
Financial support from the World Bank’s DECRS grant is acknowledged+ The views are entirely those of the authors and not the World Bank’s+ We are grateful to the editors and two anonymous referees for their insightful comments, which improved the paper considerably+ We thank seminar par-ticipants at the 2006 Southern Economic Association Meetings, the 2007 American Political Science Association Meetings, University of Toronto, Texas A&M, World Trade Organization ~Geneva!, and the World Bank for useful comments+ Responsibility for any remaining errors is ours+
International Organization 63, Summer 2009, pp+ 491–532
government behavior is evaluated+ There are at least two reasons for this+ First, it is well established in theory and in empirical work that trade policy, like many other government policies, is redistributive and is used by governments to favor certain constituents over others+1 Second, the recent theoretical literature in this area ~following the work of Grossman and Helpman2!offers a parsimonious and empirically amenable structural platform that is suitable for estimating the pri-mary parameter of interest: the relative preference of a governments for aggregate welfare over private rents, that is, the welfare-mindedness of governments+ This relative weight is known in the literature ~detailed below! as the parameter a+3
The results from the first step, using data from more than fifty countries, show substantial variance across countries in the weight that their governments place on aggregate social welfare versus their private interests ~the a parameter!+ For instance, the estimates for countries such as Nepal, Bangladesh, Ethiopia, and Malawi are many-fold lower than for Hong Kong, Singapore, Japan, and the United States+
Although the parameter a is taken to be primitive in the Grossman-Helpman model, the wide variation in a across countries hints at more fundamental factors underpinning a+ We therefore view the results from the first step as coming from a model where the determinants of a are a “black box+” In the second step we unpack the box+ Doing so requires a continuity between the model that produced the first-step estimates of a, and the models admitting details about what might determine these a’s+ We specifically consider models in which trade policy is determined as the outcome of electoral competition and legislative bargaining+ They suit our pur-pose well, and we use them to advance new hypotheses about associations between political, institutional, and economic variables on the one hand, and the prefer-ences of policymakers on the other+ Differprefer-ences in the electoral setups or legisla-tive decision process make some governments more inclined to maximize social welfare when making trade policy decisions and other governments less inclined to do so+ This theory-based empirical analysis distinguishes our study from other cross-country studies about the associations between institutions and policy outcomes+
Empirically, we report a number of new findings+ The greater the proportion of the population that is informed, the larger is government’s concern for wel-fare+ The less ideologically beholden the public is to the parties in the legisla-ture, the more welfare-maximizing is their government+ The more productive is media advertising, the greater is the demand by politicians for special interest money ~in order to sway uninformed voters while contesting elections!, and the
1+ Schattschneider 1935; and Baldwin 1985 have spawned an enormous political economy litera-ture+ They are substantiated using voting data in Hiscox 2002; Bohara et al+ 2005; Baldwin and Magee 2000; and McGillivray 1997+
2+ Grossman and Helpman 1994+
3+ Empirical work here, largely focused on U+S+ data, include Goldberg and Maggi 1999; Gawande and Bandyopadhyay 2000; McCalman 2004; Mitra, Thomakos, and Ulubasoglu 2002; and Eicher and Osang 2002+ Gawande and Krishna 2003 survey this field+
492 International Organization
terms of use, available at https:/www.cambridge.org/core/terms. https://doi.org/10.1017/S0020818309090171
lower is the government’s concern for welfare+ Executive checks and balances on the powers of the legislature increase the weight on welfare, while electoral com-petition for the executive lowers it since candidates for the executive rely on special interest money to sway uninformed voters+
The rest of the paper is organized as follows+ In the first section, we derive the Grossman-Helpman prediction of endogenous trade policy determination that enables estimation of the welfare-mindedness of governments+ Industry-level data from fifty-four countries are used in the estimation exercises+ These data and the resulting estimates are described in the second section+ The third section derives hypotheses from electoral competition and legislative bargaining models of trade policy formation+ A number of hypotheses about the relationship between specific institutional variables and the welfare-mindedness of governments are stated+ These hypotheses are then taken to the data in the fourth section+ The variables are described and the results are empirically analyzed+ The final section concludes+
What Governments Maximize: Theory
This section presents the Grossman-Helpman ~henceforth GH94! model+ It pro-vides the theoretical basis for our estimates of the extent of government concern for welfare relative to private gain+ The presentation in this section is formal, because we wish to emphasize that our empirics are tightly linked to theory+ Readers less interested in the technical derivation may skip to the second section directly after reading up through equation ~1!+ It will be beneficial, however, to intuitively under-stand equation ~5! since it provides the link between the first and second steps in this article+ The GH94 model is a simple general equilibrium political economy model that features a ~unitary! government of a small open economy that values both its population’s welfare as well as money contributions by import-competing producers who gain from increased profits+ Since trade policy may be used by gov-ernment to increase domestic prices over world prices, import-competing produc-ers organize politically into lobbies and pay the government in order to distort prices using tariffs on imports+ The equilibrium tariffs are the result of governments max-imizing their objective and lobbies doing similarly+ Intuitively, this is based on the following calculus+
We mentioned that the government is interested not only in lobbying money but is also concerned about the collective welfare of its public+ Suppose it weighs a dollar of its public’s welfare and a dollar of lobbying contributions equally+ Then the government will require lobbies to pay up to the extent of the welfare loss that the tariff, which benefits the lobbies, inflicts on the public+4 If government’s rela-tive weight on public welfare is ten times larger than on money contributions, for
4+ This is exact in the simpler version of the GH94 model we use below, but approximate in the more detailed GH94 model+
example, then it will require lobbies to pay ten times as much as the welfare loss from the price distortions+ If the government is willing to sell out its public cheaply then it will require less in contributions from lobbies than the amount of the wel-fare loss+
The extent of the welfare loss, in turn, depends importantly on the elasticity of import demand+ Lobbies, on the other hand, calculate their optimal money contri-butions on the basis of the rents they expect to receive from the tariffs+ These, in turn, depend ~positively! on the output-to-import ratio+ Thus, the tariffs set in political-economic equilibrium depend on import demand elasticities and output-to-import ratios in each sector+ The main advantage of the GH94 model is that it provides an explicit relationship between tariffs and these measurable variables that may be used to estimate the relative weight that a government places on wel-fare versus contributions+ This relationship appears in equation ~8!+
The purpose of the rest of this section is to derive equation ~8! formally+ Our notation here borrows from GH94 and Goldberg and Maggi+5 Consider a small open economy with n⫹ 1 tradable sectors+ Individuals in this economy are assumed to have identical preferences over consumption of these goods represented by the utility function:
U⫽ c0⫹
(
i⫽1
n
ui~ci!, ~1!
where good 0 is the numeraire good whose price is normalized to one+ The addi-tive separability of the utility functions eliminates cross-effects among goods+ Con-sumer surplus from the consumption of good i, si, as a function of its price, pi, is given by si~ pi!⫽ u~d~ pi!!⫺ pid~ pi!, where d~ pi! is the demand function for good i+ The indirect utility function for individual k is given by vk ⫽ yk ⫹ (i⫽1
n
sik~ pi!, where ykis the income of individual k+
On the production side, the numeraire good is produced using labor only under constant returns to scale, which fixes the wage at one+ The other n goods are pro-duced with constant returns to scale technology, each using labor and a sector-specific input+ The sector-specific input is in limited supply and earns rents+ The price of good i determines the returns to the specific factor i, denoted p~ pi!+ The supply function of good i is given by yi~ pi!⫽ p'~ pi!+ Since rents to owners of a specific input increase with the price of the good that uses the specific input, owners of that specific input have a motive for influencing government policy in a manner that raises the good’s price+
Government uses trade policy, specifically tariffs, that protect producers of import-competing goods and raise their domestic price+ The world price of each good is taken as given+ For good i the government chooses a specific ~per unit!
5+ Goldberg and Maggi 1999+
494 International Organization
terms of use, available at https:/www.cambridge.org/core/terms. https://doi.org/10.1017/S0020818309090171
import tariff, tis
, to drive a wedge between the world price, pi0, and the domestic price, pi, pi⫽ pi
0⫹ t
i s
+ The tariff revenue is distributed equally across the popula-tion in a lump-sum manner+
Summing indirect utility across all individuals yields aggregate welfare W+ Aggre-gate income is the sum of labor income ~denoted l !, the returns to specific factors, and tariff revenue+ Therefore aggregate welfare ~as a function of domestic prices! is given by: W⫽ l ⫹
(
i⫽1 n pi~ pi!⫹(
i⫽1 n tisMi~ pi!⫹(
i⫽1 n si~ pi!, ~2! where imports Mi⫽ di⫺ yi+We also assume that the proportion of the population of a country that is repre-sented by organized lobbies is negligible+6This allows us to ignore the incentives to lobby for lower tariffs on goods that are consumed, but not produced by owners of specific factors, as well as the incentives to lobby for higher tariffs on goods that are neither consumed nor produced, but that generate tariff revenue+ While this assumption is imposed on the theoretical model, it is based on relatively solid empirical grounds, as consumer ~and taxation! lobbies are uncommon relative to producer lobbies+ In other words, in our setup, lobbies only care about the rents to their specific factor+ More formally, the welfare of lobby i is simply given by:
Wi⫽ pi~ pi!+ ~3!
The objective function of the government reflects the trade-off between social wel-fare and lobbyists’ political contributions+ These contributions may be used for personal gain, or to finance re-election campaigns, or a variety of other self-interested expenditures that may buy the government favor with its constituents+ Thus, the government’s objective function is a weighted sum of campaign contri-butions, C, and the welfare of its constituents, W:
G⫽ aW ⫹ C ⫽ aW ⫹
(
i僆LCi, ~4!
where the parameter a is the weight government puts on a dollar of welfare rela-tive to a dollar of lobbying contributions+ Lobby i makes contribution Ci to the government and therefore maximizes an objective function given by Wi⫺ Ci+
We presume that the equilibrium tariffs arise from a Nash bargaining game between the government and lobbies+ Goldberg and Maggi show that this leads to
6+ This is equivalent to assuming that ownership of specific factors is highly concentrated in all sectors+
the same solution as does the use of the menu auction model employed in Grossman and Helpman+ The Nash bargaining solution maximizes the joint surplus of the government and lobbies given by the sum of the government’s welfare, G, and the welfare of each lobby net of its contributions+ The joint surplus becomes
V⫽ aW ⫹
(
i
Wi, ~5!
Note that ~5! implicitly assumes that all sectors are politically organized+7This is true of manufacturing sectors in most advanced countries, where political action committees ~United States! or industry associations ~Europe! lobby their govern-ments+ Such industry coalitions are prevalent in developing countries as well+ Other than in the United States, rules and regulations requiring lobbying activity to be reported are blatantly absent+ We take this lack of transparency as proof of the pervasiveness of lobbying activity+ Since our analysis is conducted at the aggre-gation level of twenty-eight International Standard Industrial Classification ~ISIC! three-digit level industries, the assumption that all industries are organized is an empirically reasonable one+8
Under the two assumptions that all sectors are organized and a negligible pro-portion of the population is organized into lobbies, the joint surplus takes the sim-ple form: V⫽ l ⫹
(
i⫽1 n @a⫹ 1#pi⫹(
i⫽1 n a~tisMi⫹ si!+ ~6!The first order conditions are:
@a⫹ 1#Xi⫹ a@⫺di⫹ tisMi'~ pi!⫹ Mi#⫽ 0, i ⫽ 1, + + + , n+ ~7! Solving, we get the tariff on each good that maximizes the joint surplus:
ti 1⫹ ti ⫽ 1 a
冉
Xi0Mi ei冊
, i⫽ 1, + + + , n+ ~8!In equation ~8! ti⫽ ~ pi⫺ pi0!0pi0is the ad valorem tariff for good i, where piis the domestic price for good i at home and pi0is its world price+ Xi0Mi is the equilib-rium ratio of output to imports and ei⫽ ⫺Mi
'
{pi0Mi is the absolute elasticity of
7+ That is, all sectors are able to solve collective action problems in organizing for lobbying+ For a model that endogenizes lobbying organization see Mitra 1999+
8+ In the U+S+ data, for instance, significant contributions to the political process are reported by all three-digit industries+
496 International Organization
terms of use, available at https:/www.cambridge.org/core/terms. https://doi.org/10.1017/S0020818309090171
import demand+ Thus, producers of good i are able to “buy” protection ~ti ⬎ 0!+ Industry output, Xi, captures the size of rents from protection+ Imports determine the extent of welfare losses from protection, so the smaller are the imports the higher is the tariff+ The well known rule about taxation according inverse-elasticity is in evidence here: the lower is the absolute elasticity, ei, the greater is the price distortion, and conversely+ Known as the Ramsey-pricing rule in the economics literature, it is the least inefficient way to distort prices, since it creates the small-est welfare loss+
What Governments Maximize:
Comparative Estimates of a
Equation ~8! suggests a simple way of estimating the trade-off parameter a+ Rewrite ~8! as ti 1⫹ ti {ei{ Mi Xi ⫽ 1 a i⫽ 1, + + + , n+ ~9!
We use a stochastic version of this equation to estimate the parameter a+ The data, described below, are across industries and time for each of fifty-four countries+ Indexing the time series by t, the econometric model we use to estimate the a’s is
tit 1⫹ tit {ei{ Mit Xit ⫽ b0⫹ eit i⫽ 1, + + + , n, ~10!
where the error term eit is identically independently normally distributed across observations for any specific country, with homoscedastic variance s2
+ The vari-ance is allowed to vary across countries+ The coefficient b0 ⫽ 10a+ Taking the output-to-import ratio and the import elasticity to the left-hand side ~lhs! of the equation mutes issues concerning endogeneity to tariffs of output, imports, and the elasticity of import demand+
Model 10 is estimated for a set of fifty-four high, middle, and low-income coun-tries+9 For these countries we have tariff data ~incompletely! across twenty-eight three-digit ISIC industries over the 1988–2000 period+10
9+ They are Argentina, Bolivia, Brazil, Chile, China, Colombia, Ecuador, Hungary, Indonesia, India, Korea, Sri Lanka, Mexico, Malawi, Malaysia, Peru, Philippines, Poland, Thailand, Trinidad and Tobago, Turkey, Taiwan, Uruguay, Venezuela, South Africa, Bangladesh, Cameroon, Costa Rica, Morocco, Nepal, Egypt, Ethiopia, Guatemala, Kenya, Latvia, Pakistan, Romania, Austria, Denmark, Spain, Finland, France, United Kingdom, Germany, Greece, Ireland, Italy, Japan, Netherlands, Norway, Sweden, United States, Hong Kong, and Singapore+
10+ Tariffs are applied most-favored nation rates from the United Nations Conference on Trade and Development ~UNCTAD! TRAINS database at the six-digit HS, which were mapped into the
three-Industry level output and trade data are from the World Bank’s Trade and Pro-duction database constructed by Nicita and Olarreaga+11We use the import demand elasticities estimated for each country at the six-digit Harmonized System ~HS! level by Kee, Nicita, and Olarreaga+12 Since the standard errors of the elasticity estimates are known, they are treated as variables with measurement error and adjusted using a Fuller-correction+13 The import demand elasticities are missing for four countries—Ecuador, Nepal, Pakistan, and Taiwan+ For them we use the industry averages of the elasticity estimates taken across all other countries+
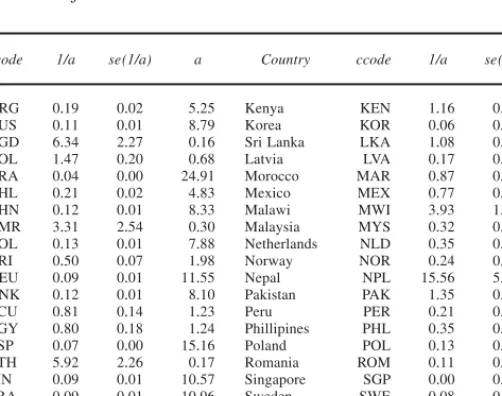
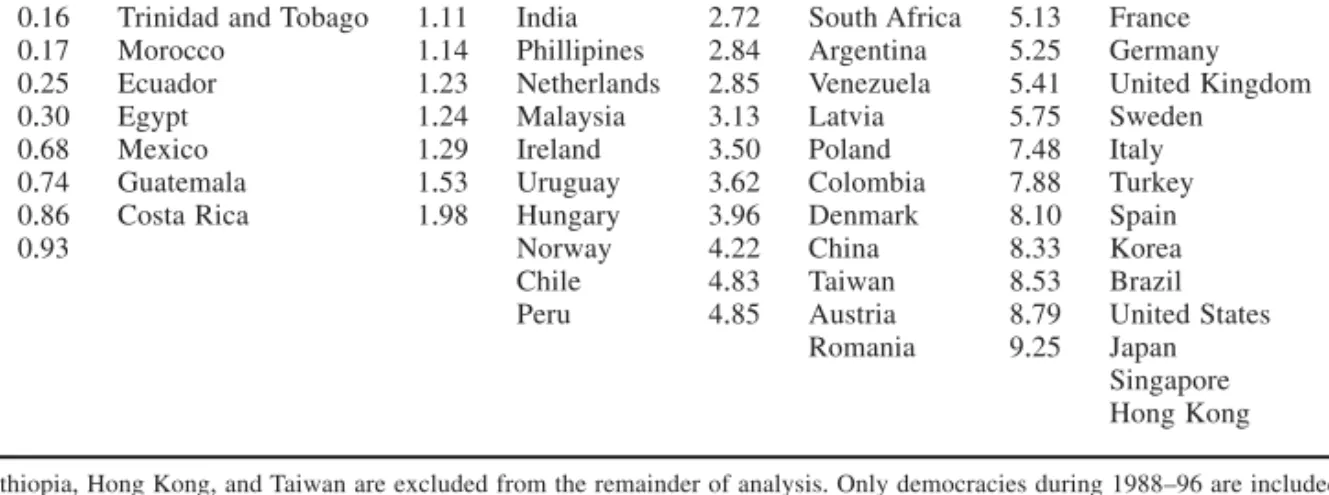
Estimates of the coefficient b0 in equation ~10!, denoted 10a, and its standard error are displayed in Table 1 for the fifty-four countries+ Inverting these coeffi-cients yield estimates of the parameter a+ They appear in the last column of Table 1+ Several interesting and surprising features of these estimates are evident in Table 2, where countries are sorted by their a estimates+ In general, richer countries have higher values of a than poorer countries+ That is, governments of richer countries are revealed by their trade data to place a much greater weight on a dollar of welfare relative to a dollar of private gain ~contributions!+ The last two columns indicate that countries with a⬎ 10 have per capita incomes at the level of Orga-nization for Economic Cooperation and Development ~OECD! countries ~with the exception of Brazil and Turkey!+ Middle income countries have fairly high values of a+ All South American economies in our sample, with the exception of Bolivia ~0+68!, fall within this group+ Other notable liberalizers come from Asia: India ~2+72!, Indonesia ~2+62!, Malaysia ~3+13!, Philippines ~2+84!+ The lowest a’s belong to the poor Asian nations of Nepal ~0+06!, Bangladesh ~0+16!, Pakistan ~0+74!, and Sri Lanka ~0+93!, and the African nations of Ethiopia ~0+17!, Malawi ~0+25!, Cam-eroon ~0+30!, and Kenya ~0+84!+
An important feature of our results is that, in contrast with previous examina-tions of the Grossman-Helpman model,14our estimates of a are reasonable, both qualitatively ~poorer countries have smaller a’s than richer countries! and quanti-tatively ~only extremely low-tariff or zero-tariff countries like Hong Kong and Singapore have a’s greater than 50, while this was routinely found for Turkey, Australia, and the United States in the studies referenced above!+ We find the cross-country variation in a to be striking and intuitively pleasing+ Countries with low a’s accord with the widely accepted view that governments in those countries are also among the most corrupt in the world+ Indeed the Spearman rank correlation
digit ISIC industry level+ Where missing, tariffs are augmented by World Trade Organization ~WTO! applied rates, constructed from the WTO’s IDB and WTO’s Trade Policy Reviews+ They are closely correlated+
11+ Nicita and Olarreaga 2007+ 12+ Kee, Nicita, and Olarreaga 2008+
13+ Fuller 1986; see also Gawande and Bandyopadhyay 2000+ This correction limits the influence of outlying estimates with large standard errors, which would otherwise grossly overstate the true elasticity+
14+ Goldberg and Maggi 1999; Gawande and Bandyopadhyay 2000; Mitra, Thomakos, and Uluba-soglu 2002; McCalman 2004; and Eicher and Osang 2002+
498 International Organization
terms of use, available at https:/www.cambridge.org/core/terms. https://doi.org/10.1017/S0020818309090171
between the Transparency International Corruption Perception Index for the year 2005 and our measure of government willingness to trade off social welfare for political rents is 0+67, and we can statistically reject the assumption that the two series are uncorrelated+ In 2005 the Transparency International Corruption Percep-tion index rank of the two countries at the bottom of our a rankings ~Nepal and Bangladesh! were 121 and 156 out of 157 countries, respectively+ Similarly, the Transparency International Corruption index rank of the two countries at the top of our a rankings ~Singapore and Taiwan! were 5 and 15, respectively+
Some results we find to be surprising are ~1! the low a for Mexico, despite its membership in the North American Free Trade Agreement ~NAFTA!, ~2! the lower than expected a for the OECD countries of Norway, Ireland, and the Netherlands ~in the 3⬍ a ⱕ 5 group!, ~3! the relatively high a’s for the socialist countries in transition, including Poland, Hungary, and Romania, ~4! the relatively high a’s for Japan and China, both of whom have been criticized for being mercantilistic— protectionist and export-oriented+
TABLE 1. Estimates of a
Country ccode 1/a se(1/a) a Country ccode 1/a se(1/a) a
Argentina ARG 0+19 0+02 5+25 Kenya KEN 1+16 0+33 0+86 Austria AUS 0+11 0+01 8+79 Korea KOR 0+06 0+00 16+15 Bangladesh BGD 6+34 2+27 0+16 Sri Lanka LKA 1+08 0+18 0+93 Bolivia BOL 1+47 0+20 0+68 Latvia LVA 0+17 0+01 5+75 Brazil BRA 0+04 0+00 24+91 Morocco MAR 0+87 0+14 1+14 Chile CHL 0+21 0+02 4+83 Mexico MEX 0+77 0+07 1+29 China CHN 0+12 0+01 8+33 Malawi MWI 3+93 1+17 0+25 Cameroon CMR 3+31 2+54 0+30 Malaysia MYS 0+32 0+02 3+13 Colombia COL 0+13 0+01 7+88 Netherlands NLD 0+35 0+05 2+85 Costa Rica CRI 0+50 0+07 1+98 Norway NOR 0+24 0+05 4+22 Germany DEU 0+09 0+01 11+55 Nepal NPL 15+56 5+66 0+06 Denmark DNK 0+12 0+01 8+10 Pakistan PAK 1+35 0+31 0+74 Ecuador ECU 0+81 0+14 1+23 Peru PER 0+21 0+03 4+85 Egypt EGY 0+80 0+18 1+24 Phillipines PHL 0+35 0+03 2+84 Spain ESP 0+07 0+00 15+16 Poland POL 0+13 0+01 7+48 Ethiopia ETH 5+92 2+26 0+17 Romania ROM 0+11 0+01 9+25 Finland FIN 0+09 0+01 10+57 Singapore SGP 0+00 0+00 404+29 France FRA 0+09 0+01 10+96 Sweden SWE 0+08 0+03 12+28 U+K+ GBR 0+08 0+01 11+86 Thailand THA 0+94 0+17 1+06 Greece GRC 0+20 0+02 5+11 Trinidad and TTO 0+90 0+16 1+11 Guatemala GTM 0+65 0+08 1+53 Tobago
Hong Kong HKG 0+00 0+00 ` Turkey TUR 0+07 0+00 14+53 Hungary HUN 0+25 0+02 3+96 Taiwan TWN 0+12 0+01 8+53 Indonesia IDN 0+38 0+09 2+62 Uruguay URY 0+28 0+02 3+62 India IND 0+37 0+05 2+72 United States USA 0+04 0+01 26+14 Ireland IRL 0+29 0+04 3+50 Venezuela VEN 0+18 0+01 5+41 Italy ITA 0+07 0+01 13+42 South Africa ZAF 0+19 0+02 5+13 Japan JPN 0+03 0+00 37+81
Notes: Hong Kong has zero tariffs+ In the runs with fifty-four observations ~full sample! Hong Kong’s a is set to
TABLE 2. Countries ranked by their estimates of a
a , 1 2 , aⱕ 1 3 , aⱕ 5 5 , aⱕ 10 10 , a
Nepal 0+06 Thailand 1+06 Indonesia 2+62 Greece 5+11 Finland 10+57
Bangladesh 0+16 Trinidad and Tobago 1+11 India 2+72 South Africa 5+13 France 10+96
Ethiopia 0+17 Morocco 1+14 Phillipines 2+84 Argentina 5+25 Germany 11+55
Malawi 0+25 Ecuador 1+23 Netherlands 2+85 Venezuela 5+41 United Kingdom 11+86
Cameroon 0+30 Egypt 1+24 Malaysia 3+13 Latvia 5+75 Sweden 12+28
Bolivia 0+68 Mexico 1+29 Ireland 3+50 Poland 7+48 Italy 13+42
Pakistan 0+74 Guatemala 1+53 Uruguay 3+62 Colombia 7+88 Turkey 14+53
Kenya 0+86 Costa Rica 1+98 Hungary 3+96 Denmark 8+10 Spain 15+16
Sri Lanka 0+93 Norway 4+22 China 8+33 Korea 16+15
Chile 4+83 Taiwan 8+53 Brazil 24+91
Peru 4+85 Austria 8+79 United States 26+14
Romania 9+25 Japan 37+81
Singapore 404+00
Hong Kong `
Notes: China, Ethiopia, Hong Kong, and Taiwan are excluded from the remainder of analysis+ Only democracies during 1988–96 are included+
terms of use, available at
https:/www.cambridge.org/core/terms
.
https://doi.org/10.1017/S0020818309090171
Downloaded from
https:/www.cambridge.org/core
. University of Basel Library
, on
30 May 2017 at 13:50:04
These unexpected results emphasize the fact that the theoretical model does not base its prediction simply on openness ~low or high tariffs!, but also on the import-penetration ratio, and import demand elasticities, as well as their covari-ance with tariffs, and each other+ The incidence of tariffs in industries with high import demand elasticities reveals the willingness on the part of governments to ~relatively! easily trade public welfare for private gain,15since in welfare-oriented countries the most price-sensitive goods should be distorted the least+ The inci-dence of tariffs in industries with high import-to-output ratios also reveals the will-ingness on the part of those governments to trade public welfare for private gain since distorting prices in high-import sectors creates large deadweight losses+ Empir-ically, this is not only revealed by the surprising estimates discussed above, but also by the relatively low correlation between our estimates of a, and average tar-iffs, which is estimated at 0+33, and compares badly with the correlation with the index of perceived corruption+ Thus, the estimates underscore the need to consider more than simplistic measures of openness in order to make inferences about the terms at which different governments trade public welfare for private gain+ The Grossman-Helpman measure is not only theoretically more appropriate, but also empirically appears to be quite distinct from simpler measures+
We are ultimately interested in the deeper question of why governments behave as they do+ What explains the variation in the estimates of a across countries? Why do some countries have low a’s and others high a’s? Are polities in poorer countries content to let their governments cheaply trade their welfare away? If so, why? And why in richer countries do we observe the opposite? These are the ques-tions to which we devote the remainder of the article+
Explaining the Variation in a: Theory
To explain why a varies across countries we delve into institutional foundations of policymaking+ In this, we can take one of two routes+ One is a data-driven approach that involves choosing a set of variables that adequately describe institutional details of the policy process in different countries, and use them to econometrically explain the cross-country variation in a+ Such a method would shed light on those institu-tions that motivate governments to behave as they do in setting trade policy+ The second is to seek structural explanations of how institutions might explain the vari-ation in a across countries+ We opt for the latter in this article, since it continues in the tradition of the GH94 model that delivered our estimates for a+16
Positive theories that model policy outcomes based on institutional details of the policy process fall into three broad categories+17Electoral competition models
15+ This results in a high estimate of b0and low estimates of a+
16+ A data-driven factor-analytic approach yields results that reinforce many of the findings in this article+ They are available to interested readers+
focus on the process by which parties are represented in the legislature, and fea-ture details about the strucfea-ture of voter characteristics ~informed versus uninformed! and voter preferences+ Lobbying models focus on lobbying process and feature details about the lobbying game+ Legislative bargaining models feature specific legislative decision making processes that may emphasize, for example, agenda-setting and the allocation of policy jurisdictions ~for example, ministers, commit-tee chairs!+ In the first part of this paper, we used the GH94 lobbying model to estimate the weight put on social welfare from trade policies of governments+ But the determinants of these weights were a “black box+” The objective of this sec-tion is to unravel the determinants of a as viewed from the theoretical lens of electoral competition and legislative bargaining models+
Electoral Competition and Lobbying
Integrating lobbying and electoral competition has been done in three important models, respectively, by Austen-Smith, Baron, and Grossman and Helpman+18They model policies as outcomes from the interaction of two parties and special interest groups that make lobbying contributions to them+ They differ in the motives of the lobbyists+ Lobbyists are purely interested in altering electoral outcomes in Austen-Smith and Baron+ In Grossman and Helpman, lobbyists are also able to influence policy outcomes by altering party platforms via lobbying+ We will abstract from the electoral motive and focus on this influence-seeking motive in order to con-nect the a parameter with more primitive institutional details+ To this end, we describe the 1996 Grossman-Helpman ~henceforth GH96! model+
Two parties, A and B, contest an election for seats in the legislature+ Each party advances a slate of candidates, and the country votes as a single constituency+ Once elections are over, and the votes counted, both parties occupy seats in leg-islature in proportion to the popular vote count ~more on the distinction between this proportional system and a pluralitarian system below!+
There are two classes of voters, informed and uninformed+ The former have immovable preferences based on ~1! the policy position of each party and ~2! other characteristics of the party ~liberal, conservative!+ Uninformed voters, on the other hand, may be induced to move from their current position via campaign expendi-tures on slogans, advertising, and other informational devices designed to impress them+ The difference in campaign spending by the two parties crucially deter-mines how many uninformed voters they will be able to move to their side+ For this reason, politicians representing each party demand contributions+ Lobbies form to supply contributions+
On the lobbying side we consider the case, as in the GH94 model, where each sector is represented by a single lobby, but the fraction of the organized popula-tion represents a negligible proporpopula-tion of the total populapopula-tion+ Each lobby is
inter-18+ See Austen-Smith 1987; Baron 1994; and Grossman and Helpman 1996+
502 International Organization
terms of use, available at https:/www.cambridge.org/core/terms. https://doi.org/10.1017/S0020818309090171
ested only in protecting its own sector, and there is no competition or conflict among lobbies+19 Each party thus receives contributions from multiple lobbies, with each lobby’s interest being a single element of the vector p+ The game com-prises of two stages+ In the first stage, lobbies announce their contribution sched-ules ~as a function of the tariff afforded to their sector!, one to each of the two parties ~party A and party B!+ In the second stage, the two parties choose their vector of tariffs ~their policy platforms! in order to maximize the representation of their party in the legislature+ The lobbies then pay their promised contributions, the parties wage their campaigns, and the legislature0congress that assumes office implements one of the party’s tariff vector ~legislative processes are a black box in electoral competition models—we unpack this box below!+
A political microfoundation for a is found in the structural analog of the expres-sion for the joint surplus in equation ~5!, which may be written separately for each lobby i as:
Vi⫽ Wi~ti!⫹ aW~ti!, i⫽ 1, + + + , n+ ~11!
In the GH94 unitary government case, the politically optimal tariffs in each sector i is set by the government in a way that maximizes the weighted sum of the aggre-gate welfare of lobby i and the aggreaggre-gate welfare of the country’s citizens+ The government is induced by lobby i to weight the lobby’s interest by ~1⫹ a!, which is greater than the weight of a it places on the public’s aggregate interest+ We will observe a parallel between equation ~11! and the joint surplus in the electoral com-petition game, and we use it to pin down the determinants of a from the param-eters of the electoral competition game+
Grossman and Helpman ~1996, p+ 274 eq+ ~4!! show that the joint surplus in the electoral competition game involving parties A and B and one ~say, sector i ! lobby is ViK⫽ fKW i~ti!⫹ 1⫺ a a f hW~ti!, K⫽ A, B+ ~12!
As in equation ~11!, Wi~ti! is the ~net of contributions! welfare of lobby i+ In equation ~12!, W~ti!is the aggregate welfare of informed voters+ There are four parameters to consider+ a is the fraction of voters who are uninformed+ If a⫽ 0, then W~ti!becomes the welfare of the average voter, just as in equation ~11!+ We will see below that buying the support of uninformed voters makes special interests groups important to political candidates, and a determines the magni-tude of the importance of special interest contributions+ f ⬎ 0 quantifies the
diver-19+ This exemplifies Baron’s idea of “particularistic policy” whose benefits are exclusively enjoyed by those who lobby for it, but the costs are not onerous on others; see Baron 1994+
sity of views about the two parties among voters in terms of all fundamental characteristics ~for example, liberal-conservative! except their policy positions about the tariff ti+ The closer is f to zero the greater is the diversity of views; the larger is f the closer are the two parties perceived to be+ This parameter is relevant because the more important these divergences among the parties are to voters— the more committed they are to a particular party for ideological reasons, for example—the less likely they are to be swayed by trade policy+ h⬎ 0 quantifies the ability of campaign spending to move the position of an uninformed voter+ The greater is h, the more productive is a dollar of campaign spending in influ-encing the uninformed voter+ Since money becomes a useful instrument with which to sway the uninformed voter, the sources of this money—special interest groups— become useful to the political candidates+ Finally, fKis the probability that, once elections are over, the legislature actually adopts party K’s trade policy platform ~sector i tariff promised by party K before the election!+ With two parties, fA ⫹ fB⫽ 1+ We will see below the relevance of this key parameter in formulating testable hypotheses+
The parallel with equation ~11! is clear+ Equation ~12! shows that each party is induced by lobby i to maximize a weighted sum of the aggregate interest of informed voters and the aggregate interest of members of organized interest groups+ The aggregate interest of informed voters ~interest groups! receives a weight that increases ~decreases! with the share of informed voters in the population ~1⫺ a!, decreases ~increases! with the diversity of their views about the parties’ ideologi-cal positions, and decreases ~increases! with how easily uninformed voters are swayed by campaign spending+ We will use these and other observations to make empirically testable predictions+
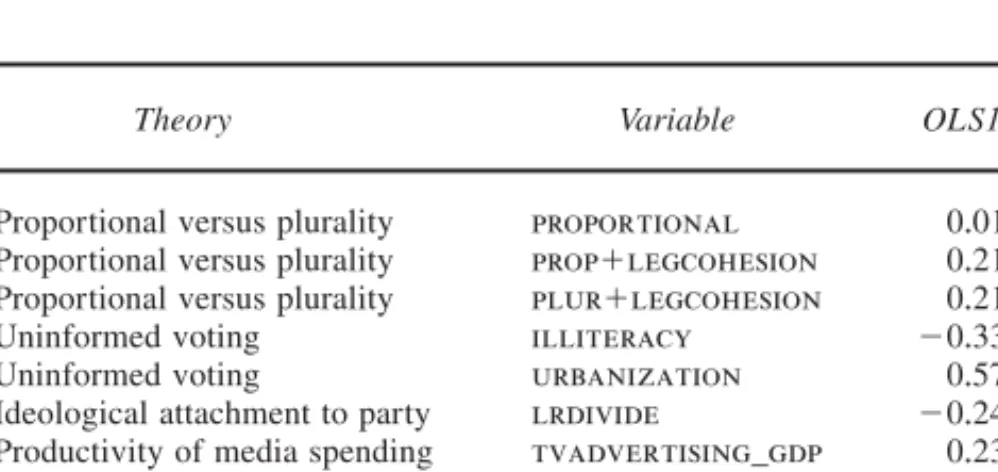
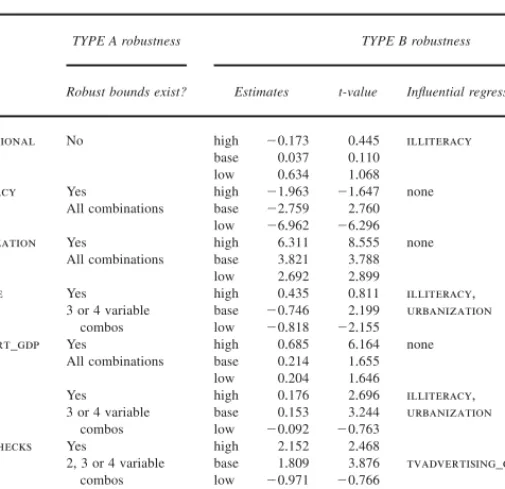
Predictions
Proportional vs. Pluralitarian Systems
In a proportional system seats in the legislature are allocated to the two parties according to the proportion of the popular vote+ With just two parties, and the country voting as a single constituency, the objective of maximizing the number of seats in legislature is equivalent to maximizing plurality+ That is, the outcome is exactly the same as if the system of representation were majoritarian+ The GH96 model is such a two-party one-constituency model+ The real world is different in two important respects+
First, a country typically votes not as a single constituency, but as several geo-graphically distinct constituencies+ In a typical majoritarian system each district elects a single representative to the legislature+ In a typical proportional system each district is represented by multiple candidates so that a district’s seats are divided between the two parties in proportion to the popular vote+ If districts are heterogeneous, say, with respect to the composition of specific factors, then it is possible for a majoritarian system to favor special interests more than a
propor-504 International Organization
terms of use, available at https:/www.cambridge.org/core/terms. https://doi.org/10.1017/S0020818309090171
tional system+ This is demonstrated theoretically in Grossman and Helpman+20They advance a two-party three-good, three-district model in which the districts are het-erogeneous in the composition of ~three! specific factors+ There are no lobbies, however, each legislator seeks to represent the interests of their average constitu-ent+ Grossman and Helpman show that if both parties seek a majority21 in the legislature then, because the election of legislators is tied to particular geographic or economic interests, there is greater protection than if legislators’ interests were more closely tied to the national, not regional, interests+
Consider the two-party three-district example under a system of proportional representation in which candidates from both parties compete for multiple seats within the same district+ Evans22shows that it is more likely in the case of pro-portional representation that one party sweeps the election, that is, wins a major-ity in all three districts, than under a majoritarian system ~in which the single seat per district is determined by majority vote in each district!+ If one party sweeps the election, the policy it chooses reflects national, not regional, interests, that is, free trade+23Thus, a majoritarian system of representation leads to greater protec-tion than proporprotec-tional one+24
This result does not require the presence of lobbies because the model is devoid of uninformed voters+ If lobbies were admitted, what does this result imply about the distribution of a across the two systems of political representation? We sur-mise that since a majoritarian system is predisposed to being protectionist ~it has a lower probability of sweeping the states than a proportional one!, lobbies will ensure their interests are weighed more heavily in equation ~12! in majoritarian systems than in proportional ones+ That is, all else constant, a’s are lower in proportional than in majoritarian systems+ A formal demonstration of this requires extending the GH96 single-district electoral competition model with uninformed voters ~whose presence motivates the existence of lobbies! to n districts+25 We state our first hypothesis as:
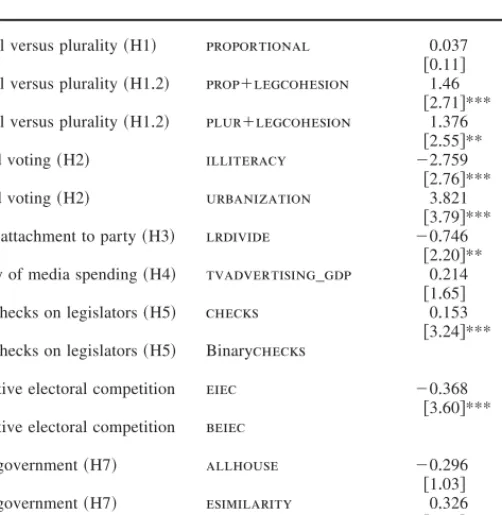
H1: A majoritarian system favors special interests more than does a proportional system. Majoritarian systems are therefore associated with low a’s.
It is possible that the three-district example exaggerates the predisposition of proportional systems to be less protectionist than majoritarian ones, so that as the
20+ Grossman and Helpman 2005+
21+ Ibid+ This objective is different from maximizing the number of seats as in GH96+ 22+ Evans 2008+
23+ Grossman and Helpman 2005, eq+ 4+
24+ Rogowski’s 1987, 208, prescient logic argued that since proportional systems make states more independent from rent-seekers than majoritarian systems, the former lead to more stable and long-lived political commitments to free trade than the latter+ The reason for this is that proportionate sys-tems result in stronger ~and fewer! parties than majoritarian syssys-tems+
number of districts increases, the probability of sweeping the districts becomes more remote and the distinction between the two systems disappears+ A rejection of hypothesis ~1! would then indicate that the world is well-approximated by the GH96 two-party single-district model in which proportional representation is equiv-alent to plurality+
The second difference between the GH96 construct and the real world is that democracies typically have more than two parties+ In the data section we attempt to reconcile the two-party theoretical model with multiparty governments that we find in the data+
Uninformed Voters
Consider the fraction a of uninformed voters+ A comparison of the weights on W in equations ~11! and ~12! indicates that, all else held constant, ar 0 as a r 1+ The intuition for this result is this+ In the absence of lobbying, parties will choose their platform to attract the maximum number of informed voters+ Denote this tariff as ti
*
+ To persuade party A to adopt a tariff ti, lobby i must contribute an amount that delivers at least as many uninformed votes as would ti
*
+26The larger is the proportion of uninformed voters a, the more pivotal the uninformed voter becomes+ Since the resources for launching a campaign to sway uninformed vot-ers are provided by lobby i, the lobby’s welfare ~here profits! gets greater weight in equation ~12!+ This leads to our second prediction:
H2: The larger is the proportion of uninformed voters in the population, the lower is a, and conversely.
Given the cross-country distribution of a, testing this hypothesis amounts to testing the validity of the uninformed voter construct itself+ The existence of uninformed voters is central to the GH96 model since it motivates the existence of lobbies+ It is also central to a number of models that feature Baron’s idea of the uninformed voter+
Party Ideology
Consider the ideological divide between the two parties given by parameter f+ The larger is f, the smaller is the diversity of views among voters over the fun-damental characteristics of the two parties+ A comparison of the weights on W in equations ~11! and ~12! indicates that, all else held constant, a r 0 as f r 0+ The reason why the weight put on social welfare increases as f increases is this+ With little diversity of views among voters, a tariff that deviates from that favored
26+ Grossman and Helpman 1996 ~p+ 274! show that this amount equals ~~1⫺ a!0a!~ f0h!@W~ti *!
⫺ W~ti!# +
506 International Organization
terms of use, available at https:/www.cambridge.org/core/terms. https://doi.org/10.1017/S0020818309090171
by the average voter does great damage electorally+ When there is great diversity of views and the two parties are considered to be very dissimilar, the parties can afford to set ~district i ’s! tariffs different from ti* and still retain the favor of voters who were inclined to vote for them on the basis of, say, ideology+ In con-trast, if voters are indifferent between the two parties’ basic characteristics, a pol-icy that deviates from ti*risks losing many voters to the other party+ This leads to our third prediction:
H3: The greater is the perceived difference in the fundamental characteristics of the two parties in the eyes of voters, the lower is a, and conversely.
In sum, if voters are clearly predisposed to one party or the other on the basis of attributes other than their policy platforms, then both parties are more cheaply able to impose welfare costs on the public+ The parties will calculate that they gain more uninformed voters than lose the votes of their supporters+
Susceptibility of the Uninformed Voter
Finally, consider the productivity of campaign spending parameter h+ A compari-son of the weights on W in equations ~11! and ~12! indicates that, all else held constant, ar 0 as h r `+ With greater power of the dollar to influence uninformed voters, it is less costly to deviate from ti*
+ Hence, as h increases, both parties are induced to place greater weight on the interest of lobby i than on the interest of the informed public+ This leads to our fourth and last prediction from the electoral competition model:
H4: The greater is the ability of a dollar of campaign spending to influence uninformed voters, the lower is a, and conversely.
We now turn to the interactions among legislators and the process by which decisions are made within legislatures+
Legislative Bargaining and Lobbying
The Baron-Ferejohn model27is the proven workhorse in the area of legislative bar-gaining+ Models of legislative decision making have had to struggle with Arrow’s28 result that it is not possible to select the best action from a set of alternatives accord-ing to some votaccord-ing rule ~for example, majority wins!+ The breakthrough has been the introduction of an agenda setter who is granted institutional power to cham-pion a specific alternative and who attempts to guide voting in the direction of that
27+ Baron and Ferejohn 1989+ 28+ Arrow 1963+
agenda+ Regardless of whether that agenda is selected over the status quo, a voting equilibrium exists+
We adapt Persson’s legislative bargaining model29 of public goods provision with lobbying to search for more hypotheses about the determinants of a+ An attractive feature of the legislative bargaining model is that it allows us to link a with asymmetric powers of legislators+ Specifically, it motivates the role of checks and balances on those powers, without which there would be extreme redistribution+
To make our point simply, consider legislation of a slate of tariffs $ti, i⫽1, + + + , n%+ Assume that sectors are regionally concentrated—in each of the n districts is located one sector+ Every district sends one representative to the legislature+ However, there is an exogenous institutional constraint on the amount of protection: the welfare loss from the set of tariffs0subsidies may not exceed a prespecified amount+ This constraint may be satisfied by limiting the number of sectors that receive protec-tion, or limiting the level of tariffs0subsidies, or both+ The existence of such a constraint is motivated below+ Each legislator maximizes an objective function that is the sum of the welfare of the constituents in her district and the rents obtained from tariff policy+30That is, a legislator cares specially about the rents from the tariff to her sector, over and above other components of welfare+ There are two reasons for this assumption+ One is that it is consistent with the existence of lob-bies that pay the legislators for producing these rents+ The other is votes: the elec-toral competition model in which the money is used to get uninformed voters to vote for the legislator may be embedded here+
First, consider how the legislature sets the tariff vector when there are no lob-bies+ The legislative bargaining game follows a typical sequence of events: ~1! a legislator is chosen to be an agenda setter S; ~2! she makes a policy proposal for adopting the vector $tiS%; ~3! the legislature votes on the proposal, and if it gets simple majority $tiS%is implemented+ Otherwise, the status quo outcome, say $t
i o%, is implemented+ The agenda setter is obviously interested in using her powers to benefit her district, but must obtain a majority that goes along with her tariff agenda $tiS%+ She must therefore guarantee at least the same payoff to the legislators she courts as they would receive under the status quo+31Persson shows that the agenda setter will set an agenda that forms a minimum winning coalition composed of a simple majority such that ~1! legislators ~sectors! outside of the winning coalition get no tariffs0subsidy even though they bear part of the welfare loss, ~2! the mem-bers of the winning coalition get just enough protection0subsidy that they are not worse off than in the status quo+
29+ Persson 1998+
30+ In Persson’s model legislators may each attach different weights+ We presume all legislators attach the same positive weight+
31+ In the presence of the welfare loss constraint, she must sacrifice some rents that would have otherwise gone to her district in order to form a coalition of legislators that would implement her agenda+ More on this below+
508 International Organization
terms of use, available at https:/www.cambridge.org/core/terms. https://doi.org/10.1017/S0020818309090171
The logic behind this stark, rather pessimistic, result is that intense competition among legislators to be part of the winning coalition enables the agenda setter to dictate terms+ This competition drives down the “price” ~or weakens the terms! a legislator can charge the agenda setter+ The agenda setter uses her powers to pro-vide the highest rents possible to her district, since the competition among legis-lators endows her with bargaining power+
The same logic drives the results when we introduce lobbying into the game+ Suppose every sector ~district! has an organized lobby that makes contributions to their legislator+ Their fierce desire to have their legislator be part of the winning coalition cedes any bargaining ability they may have to the agenda setter+ Their contributions are unable to move the agenda in their favor+ An interesting result in the lobbying game is that since no sector outside the district of the agenda setter receives any protection0subsidy, they contribute close to zero+32
Checks and Balances. Checks against the agenda setter’s powers may be placed by an individual with influence over policy at the national level, say, a president+ His policy platform consists of a specific limit on welfare losses from price dis-tortions+ Our exogenously specified limit on welfare loss is thus motivated as a way of instituting checks and balances+ Once again, the same conclusion applies— competition among legislators still enables the agenda setter to get away with what rents are possible+ The difference is that the rents are lower if the elected president’s platform is more limiting than the status quo+33
Clearly, a direct way of enhancing the bargaining power of legislators other than the agenda setter, and thus checking her powers, is via a binding limit on the rents the agenda setter can direct to her district+ Such a national policy would then allow the legislative bargaining game to allocate rents to other districts+ Regard-less, both types of presidential platforms—limits on the amount of total welfare loss, or limits to the rents accruing to the agenda setter’s district—will result in a lower redistribution compared with a legislature that does not allow representa-tion of a narepresenta-tionwide polity capable of checking legislators+ We state the first hypoth-esis from the legislative bargaining game+34
H5: Executive checks will limit the ability of legislators to impose their politically optimal welfare losses. Greater checks are therefore associated with higher values of a.
32+ The model may be extended to incorporate the two-party electoral competition model in deter-mining the legislator chosen to represent a district+ Then, the diversity across districts in the param-eters a, h, f, and f then underlies each legislator’s a parameter+ This may well determine which legislators are in the winning coalition ~that is, the cheapest for the agenda setter to buy off !, but the fact still remains that competition among legislators will lead to the same policy+
33+ Persson, Roland, and Tabellini 1997 give deeper meaning to what it means for the executive to wield checks and balances, specifically via separation of powers+
34+ The legislative bargaining game has an additional step: the executive chooses a limit on the total welfare loss ~or the rents to the agenda setter’s district!+ The other three steps follow as before+
Our final two hypotheses go beyond the existing literature, and feature electoral competition for the executive+ An unsatisfactory aspect of legislative bargaining theory is its presumption that the executive represents median voter interests+ In most real-world democracies the executive is elected and lobbied+ We therefore embed the two-party electoral competition game into the legislative bargaining model+
Electoral Competition for the Executive. Two candidates, representing par-ties A and B respectively, contest the presidential election+ The structure of the game is essentially similar to the game used to model electoral competition for legislative seats+ The main difference here is that the presidential platforms con-cern not the tariff directly but limits on the total welfare loss from trade protection denoted OL+ The executive is presumed to maximize an objective function such as equation ~4!, except that the argument is OL ~the set of tariffs t are determined con-ditional on OL, see ~13! below!+ When there are no lobbies, the executive seeks to maximizes national welfare and sets OL ⫽ 0, eliminating the possibility of any tar-iff or subsidy+ Lobbies representing import-competing producers attempt to move OL away from zero so that they might benefit from tariffs, conditional on OL, that are decided in the legislative bargaining process+
The cap on welfare loss, OL, is determined as the outcome of the two-party elec-tion in which a naelec-tional polity of informed and uninformed voters participate+ Thus, OL for each of the two presidential candidates is determined as the Nash bargaining solution to35 MaxOLVPK⫽ fPK
(
i Wi~ OL! ⫹ 1⫺ a a f hW~ OL!, K ⫽ A, B, ~13!where Wi~ OL! is the ~net of contributions! welfare of the lobby from district i and W~ OL! is the welfare of the average informed voter, a is the fraction of uninformed voters, f quantifies the diversity of views about the two parties among voters, and h is productivity of campaign spending+ fPis the probability that, once elected, the president is able to get the legislature to adopt OL+
The first result follows directly from equation ~13!+ The parameter fPK—the probability of successfully legislating candidate K’s executive platform—determines the weight that special interests get in the executive electoral competition game+ If fPKis non-negative then the first term on the right-hand side of equation ~13! indicates that OL is selected to be greater than zero by both candidates+ Thus, elec-toral competition with lobbies and uninformed voters induces both candidates to impose welfare loss on the national polity+ The parameters a, h, and f work to
35+ The logic behind equation ~13! is similar to the logic behind equation ~12! in the legislative electoral competition game+
510 International Organization
terms of use, available at https:/www.cambridge.org/core/terms. https://doi.org/10.1017/S0020818309090171
change a in the same direction when there is electoral competition for the exec-utive as they did with electoral competition for seats in legislature+ We state this hypothesis as the next hypothesis+
H6: Electoral competition for the executive is associated with lower values of a than if there were no electoral competition for the executive.
Importantly, the parameter fPK determines the executive’s ability to impose checks on legislature’s powers+ When government is undivided, that is, when the executive and legislature both belong to the same party, the executive’s platform is more likely to make it past the legislature than were government divided+36Thus, ~13! implies that the higher is fPK~undivided government!, the more the executive platform of candidate K is bent to satisfying special interests at the expense of the public+ Conversely, if fPK is low ~divided government!, the executive is a more effective check on the legislature’s ability to impose welfare costs on the public+37 We state this as our final hypothesis+38
H7: Divided government leads to higher values of a than if the party of the exec-utive were the same as the majority party in the legislature.
Explaining the Variation in a: Data and Results
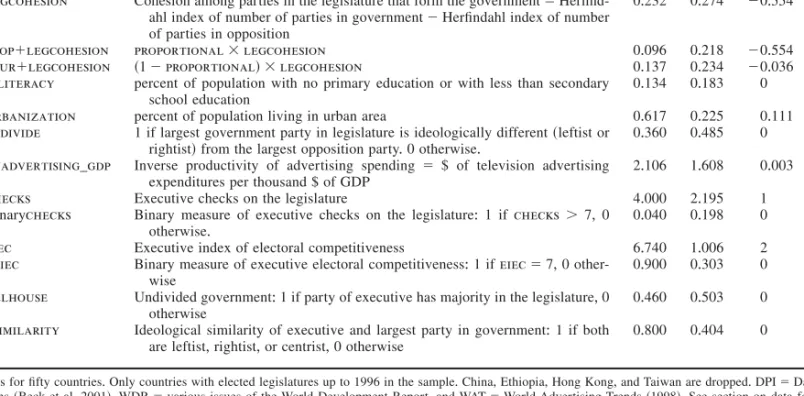
DataRecent interest in the influence of institutions over economic and political out-comes has led to the creation of cross-country databases of political institutions+ We draw on the high-quality Database on Political Institutions ~DPI! constructed by Beck and colleagues+39The database contains a number of variables measuring the nature of “government,” “legislatures,” “executive,” and “federalism+” They are measured both qualitatively and quantitatively, and admirably serve our pur-pose of measuring the variables required to test the hypotheses+ We also use eco-nomic data from various issues of the World Development Indicators ~WDI!+ Media cost data are from World Advertising Trends ~WAT!+40
36+ See, for example, Elgie 2001+
37+ An opposite argument, advanced by Lohmann and O’Halloran 1994, is that a divided govern-ment does not delegate policymaking powers to the president, while a governgovern-ment with a clear major-ity in the legislature does+ Divided government favors protectionism since each legislator cares about private benefits and costs of protection to their own district and not the social costs+
38+ Our working paper with the same title shows how the legislative bargaining theory may be completed+
39+ Beck et al+ 2001+
The theory upon which we base the empirical investigation requires us to con-sider only democracies+41We rely on the variable LIEC ~Legislative Index of Elec-toral Competitiveness! in the DPI database to identify democracies+ LIEC scores vary between 1 ~no legislature! and 7 ~largest party received less than 75 percent of the seats!+ Lower scores are given to unelected legislatures ~score⫽ 2! or if the legislature is elected but comprises just one candidate ~score⫽ 3! or just one party ~score⫽ 4!+ Countries with scores of 4 or less are not considered to have legisla-tures featuring electoral competition+ Only countries in which multiple parties con-tested for seats in the legislature ~scores of 5 or more! are considered in the sample+ Among the fifty-four countries for which we have estimated the parameter a, only four are dropped on this count ~China, Hong Kong, Ethiopia, Taiwan!+42
Testing hypothesis ~1!, requires identifying legislatures elected using a propor-tional system of representation—where seats are allocated on the basis of the pro-portion of votes received—versus a pluralitarian first-past-the-post system+43The variable housesys in the DPI is used to identify countries with proportional ver-sus pluralitarian systems+ housesys is coded 1 in the DPI only if the majority of the house is elected on a plurality basis+ We define the binary variable propor-tionality⫽ 1 ⫺ housesys to indicate legislatures in which parties are ~largely! represented proportionally to the votes they receive+44
We must reconcile the theoretical model, which admits only two parties, with the presence in our data of many countries with multiparty governments+ How the probability of successfully legislating the platform of the party in power changes when there are more than two parties is the main question that must be addressed+ The greater this probability ~that is, large fK!, the greater the weight given to special interests in equation ~12!, and the lower is a+ In a government comprising more than one party and0or an opposition that also comprises a coalition of par-ties, the probability of successfully legislating the winning party’s platform hinges on party concentration and cohesiveness+45Furthermore, Powell and Whitten46have argued that retrospective economic voting ~giving the government credit or blame
41+ A recent literature has argued in favor of democracies on the broader issue of whether democ-racies produce better trade policy outcomes than nondemocdemoc-racies+ See Milner and Kubota 2005; and Mansfield, Milner, and Rosendorff 2000, 2002+
42+ Taiwan had an LIEC score of 2 during the early 1990s, the period from which we used data to estimate its a+
43+ The influence of proportional versus other systems of electing legislatures has been well researched in the context of protection+ See Mansfield and Busch 1995; Willmann 2005; and Evans 2008+
44+ The DPI contains the variable pr that takes the value 1 if any candidates are elected based on the proportion of votes received by their party and 0 otherwise+ Even a small fraction the legislature is elected using both, then pr is coded 1+ Another variable plurality does similarly for pluralitarian systems+ A problem with using either of these measures is that a number of countries have pr⫽ plu-rality⫽ 1, indicating the presence of both systems+ Coding according to housesys is cleaner and leads to a measure that is either proportional or pluralitarian, but not both+
45+ See, for example, McGillivray 1997+ 46+ Powell and Whitten 1993+
512 International Organization
terms of use, available at https:/www.cambridge.org/core/terms. https://doi.org/10.1017/S0020818309090171
for economic outcomes! will be more likely the easier it is for voters to attribute economic outcomes to a particular party or coalition+ So more cohesive coalitions have greater incentives to use economic policies for political purposes, while looser ones have fewer incentives+47
We extend the hypothesis about proportionate versus majoritarian systems by interacting proportional and ~1⫺ proportional! with Herfindahl indices of party concentration in the government ~herfgov! and opposition ~herfopp!+ We define the difference govcohesion⫽ herfgov ⫺ herfopp to measure party cohesion in the government relative to the opposition+ The greater is herfdiff, the more cohe-sive is the government coalition; the smaller is herfdiff, the more fractured the government and0or the more united the opposition+ We use the two interactions, prop⫹ govcohesion ⫽ proportional ⫻ herfdiff and plur ⫹ govcohesion ⫽ ~1 ⫺ proportional! ⫻ herfdiff, to test the idea that plurality plus party cohesion in government ~relative to the opposition! leads to greater success in legislative vot-ing than proportionality plus party cohesion within the government+
H1.2: A majoritarian system with cohesion among parties in power favors special interests more (that is, have lower a’s) than does a proportional system with the same party cohesion.
At the heart of electoral competition models with lobbying is the fraction a of uninformed voters+ We capture two different dimensions of what it means for vot-ers to be “uninformed+” In the GH96 model ~and the Baron model upon which it is based! uninformed voters are impressionable voters who do not know the pol-icy positions of candidates+ We capture the idea of uninformed voters as impres-sionable voters using two variables+ The first variable is the proportion of the population that is illiterate ~illiteracy!, which directly measures that part of the population whose opinions are more vulnerable to campaign spending+ There is some evidence that lower literacy is associated with being uninformed politically, even in developed countries+ A primary survey by Blais and colleagues48of Cana-dian voters indicated that high school dropouts indicated not knowing about a large proportion of high-profile political candidates, relative to those who had com-pleted university+ In developing countries this problem is worse+ Bardhan and Mookherjee49add that political capture by lobbies in developing countries is ~1! decreasing in the average level of political awareness, and ~2! increasing in the awareness disparity across economic classes+ These, in turn are correlated with illiteracy and poverty+
47+ In order to admit more than two parties, we assume that each party uses its platform to seek absolute majority in the legislature+The largest winning party’s platform may be bent after the coali-tion forms in legislature, but in its final form it is close to the winning party’s platform+
48+ Blais et al+ 2000, tab+ 1+ 49+ Bardhan and Mookherjee 2000+
The second variable is the proportion of the population that is urbanized ~urban-ization!+ It captures two ideas+ One is the well documented evidence in devel-oped and developing countries that rural voters are likely to be less informed than urban voters+ In Majumdar, Mani, and Mukand50information discrepancy between rural and urban populations is the reason why urban areas get more than a dispro-portionate share of public goods+ Rural residents are poorly positioned to ascer-tain the relative importance of government neglect versus exogenous shocks in bringing about a low output in rural areas+51Active media and better education make the urban population less easy to fool+ A government will therefore expend resources in generating more favorable urban outcomes, despite the fact that they are outnumbered by their rural populations+ Majumdar and colleagues present strik-ing facts about the information divide ~measured by newspaper readership, and per capita radio and television ownership! between the rural versus urban popula-tions in Nepal, Pakistan, India, and Philippines+ They especially starkly document the difference in literacy rates in the poorer Asian and Latin American countries+52 Thus, while the variable illiteracy captures the cross-sectional variation in lit-eracy across our sample, the variable urbanization captures the intracountry dif-ferences in informed versus uninformed voters+53
The second is that information externalities make densely populated urban areas naturally positioned to obtain information+54 Scale economies afforded by urban agglomeration support an explosion of radio stations, TV channels, and news-papers, while the smaller and more scattered rural populations elude these scale economies+ The news barrage that accompanies elections is more likely to sway the rural population unused to the blitz than the more habituated urban population+ The diversity of views about characteristics of the parties other than their trade policy positions ~the parameter f in hypothesis ~3!! is measured by a variable lrdi-vide that indicates the left-right dilrdi-vide between the largest party in government and the largest party in opposition+55It takes the value 1 if the former leans left or right and the latter leans the other way+ If both lean the same way, or if either party is centrist, then the two sides are not considered to be ideologically polar-ized, and lrdivide takes the value 0+ If extra-issue characteristics are strong in the minds of voters, then they will not turn away from their preferred parties even
50+ Majumdar, Mani, and Mukand 2004+
51+ Despite the poor government response to weather shocks in February 2008 in China, the ~gen-erally less informed! Chinese population blamed the weather more than their government+ The more informed population of the U+S+ were much less forgiving of their government for their laxity during Hurricane Katrina in 2005+
52+ Majumdar, Mani, and Mukand 2004, tab+ 1+
53+ Dutt and Mitra’s 2002 findings suggest that inequality can work both ways: an increase in inequal-ity raises trade barriers in capital-abundant economies and lowers them in capital-scarce economies+ Since urbanization and illiteracy are both positively correlated with inequality, this finding sug-gests we should find evidence for or against this hypothesis+
54+ See, for example, Stromberg 2004+
55+ In the DPI they are, respectively, fgovrlc and fopprlc+
514 International Organization
terms of use, available at https:/www.cambridge.org/core/terms. https://doi.org/10.1017/S0020818309090171