HAL Id: hal-02347010
https://hal.archives-ouvertes.fr/hal-02347010
Submitted on 2 Dec 2020
HAL is a multi-disciplinary open access
archive for the deposit and dissemination of
sci-entific research documents, whether they are
pub-lished or not. The documents may come from
teaching and research institutions in France or
abroad, or from public or private research centers.
L’archive ouverte pluridisciplinaire HAL, est
destinée au dépôt et à la diffusion de documents
scientifiques de niveau recherche, publiés ou non,
émanant des établissements d’enseignement et de
recherche français ou étrangers, des laboratoires
publics ou privés.
Magellanic Cloud II: An early stage of high-mass star
formation embedded at colliding clouds in N159W-South
Kazuki Tokuda, Yasuo Fukui, Ryohei Harada, Kazuya Saigo, Kengo
Tachihara, Kisetsu Tsuge, Tsuyoshi Inoue, Kazufumi Torii, Atsushi
Nishimura, Sarolta Zahorecz, et al.
To cite this version:
Kazuki Tokuda, Yasuo Fukui, Ryohei Harada, Kazuya Saigo, Kengo Tachihara, et al.. An ALMA view
of molecular filaments in the Large Magellanic Cloud II: An early stage of high-mass star formation
embedded at colliding clouds in N159W-South. The Astrophysical Journal, American Astronomical
Society, 2019, 886 (1), pp.15. �10.3847/1538-4357/ab48ff�. �hal-02347010�
arXiv:1811.04400v5 [astro-ph.GA] 20 Dec 2019
AN ALMA VIEW OF MOLECULAR FILAMENTS IN THE LARGE MAGELLANIC CLOUD. II. AN EARLY STAGE OF HIGH-MASS STAR FORMATION EMBEDDED AT COLLIDING CLOUDS IN N159W-SOUTH
Kazuki Tokuda,1, 2 Yasuo Fukui,3, 4 Ryohei Harada,1 Kazuya Saigo,2 Kengo Tachihara,3Kisetsu Tsuge,3 Tsuyoshi Inoue,3 Kazufumi Torii,5 Atsushi Nishimura,1 Sarolta Zahorecz,1, 2 Omnarayani Nayak,6
Margaret Meixner,7, 6 Tetsuhiro Minamidani,5 Akiko Kawamura,2 Norikazu Mizuno,2, 8 Remy Indebetouw,9, 10 Marta Sewi lo,11, 12 Suzanne Madden,13 Maud Galametz,13 Vianney Lebouteiller,13 C.-H. Rosie Chen,14 and
Toshikazu Onishi1
1Department of Physical Science, Graduate School of Science, Osaka Prefecture University, 1-1 Gakuen-cho, Naka-ku, Sakai, Osaka
599-8531, Japan
2
National Astronomical Observatory of Japan, National Institutes of Natural Science, 2-21-1 Osawa, Mitaka, Tokyo 181-8588, Japan
3Department of Physics, Nagoya University, Chikusa-ku, Nagoya 464-8602, Japan
4Institute for Advanced Research, Nagoya University, Furo-cho, Chikusa-ku, Nagoya 464-8601, Japan
5Nobeyama Radio Observatory, 462-2 Nobeyama Minamimaki-mura, Minamisaku-gun, Nagano 384-1305, Japan 6Space Telescope Science Institute, 3700 San Martin Drive, Baltimore, MD 21218, USA
7Department of Physics & Astronomy, Johns Hopkins University, 3400 N. Charles Street, Baltimore, MD 21218, USA 8Department of Astronomy, School of Science, The University of Tokyo, 7-3-1 Hongo, Bunkyo-ku, Tokyo 133-0033, Japan 9Department of Astronomy, University of Virginia, P.O. Box 400325, Charlottesville, VA 22904, USA
10National Radio Astronomy Observatory, 520 Edgemont Road, Charlottesville, VA 22903, USA
11CRESST II and Exoplanets and Stellar Astrophysics Laboratory, NASA, Goddard Space Flight Center, Greenbelt, MD 20771, USA 12Department of Astronomy, University of Maryland, College Park, MD 20742, USA
13AIM, CEA, CNRS, Universit´e Paris-Saclay, Universit´e Paris Diderot, Sorbonne Paris Cit´e, F-91191 Gif-sur-Yvette, France 14Max Planck Institute for Radio Astronomy, Auf dem Huegel 69, D-53121 Bonn, Germany
(Received December 23, 2019)
Submitted to ApJ ABSTRACT
We have conducted ALMA CO isotopes and 1.3 mm continuum observations toward filamentary molecular clouds of the N159W-South region in the Large Magellanic Cloud with an angular resolution of ∼0.′′25 (∼0.07 pc). Although
the previous lower-resolution (∼1′′) ALMA observations revealed that there is a high-mass protostellar object at an
intersection of two line-shaped filaments in13CO with the length scale of ∼10 pc, the spatially resolved observations,
in particular, toward the highest column density part traced by the 1.3 mm continuum emission, the N159W-South clump, show complicated hub-filamentary structures. We also discovered that there are multiple protostellar sources with bipolar outflows along the massive filament. The redshifted/blueshifted components of the13CO emission around
the massive filaments/protostars have complementary distributions, which is considered to be a possible piece of evidence for a cloud–cloud collision. We propose a new scenario in which the supersonically colliding gas flow triggers the formation of both the massive filament and protostars. This is a modification of the earlier scenario of cloud–cloud collision, by Fukui et al., that postulated the two filamentary clouds occur prior to the high-mass star formation. A recent theoretical study of the shock compression in colliding molecular flows by Inoue et al. demonstrates that the formation of filaments with hub structure is a usual outcome of the collision, lending support for the present scenario. The theory argues that the filaments are formed as dense parts in a shock compressed sheet-like layer, which resembles “an umbrella with pokes.”
Corresponding author: Kazuki Tokuda
Keywords: stars: formation — stars: protostars — ISM: clouds— ISM: kinematics and dynamics — ISM: individual (N159W)
1. INTRODUCTION
Though high-mass stars are considered to have great impacts on the galaxy evolution, their formation process is not fully understood. There are a number of works that investigated the high-mass star formation mechanism (for reviews, e.g.,Zinnecker & York 2007;Tan et al. 2014). Although the precursors of massive stars are supposed to be very dense and massive (∼100 M⊙) cores (e.g.,Krumholz et al. 2009;Peretto et al. 2013), it may be a problem how such peculiar
cores are formed as an initial condition of massive star formation. Habe & Ohta(1992) suggested that molecular cloud collisions form a dense shock compressed layer, which is massive enough to form a massive star based on their numerical simulations in a short timescale less than 1 Myr (see also, Takahira et al. 2014; Matsumoto et al. 2015; Shima et al. 2018). Inoue et al. (2018) demonstrated that shock compressions induced by cloud–cloud collision promote massive filament formation, which is perpendicular to the background magnetic field (see also Inoue & Fukui 2013). O-type stars are formed by the global collapse of the massive filament with a high mass-accretion rate, >10−4M
⊙yr−1.
Because the high-mass protostars are supposed to be formed in giant molecular clouds (GMCs), detailed obser-vational studies toward the GMCs are thus needed to examine the initial conditions of high-mass star formation. Large-scale surveys with high-angular resolution (<0.1–1 pc) in the Galaxy have been providing us with fruitful knowl-edge on the physical properties of molecular clouds and (high-mass) star formation. Recent high-angular resolution observations with ground-based single-dish telescopes and the Herschel satellite revealed that filamentary structures are ubiquitous in both dark clouds and GMCs (e.g., Mizuno et al. 1995; Nagahama et al. 1998; Onishi et al. 1996,
1999; Arzoumanian et al. 2011, 2019; Andr´e et al. 2014, 2016). High-mass young stellar objects (YSOs) tend to be located at the intersection of multiple filamentary clouds, called “hub filament” (e.g.,Myers 2009;Peretto et al. 2013). The central part of hub filaments is as massive as &1000 M⊙pc−1, which is sometimes referred to as a “ridge” (e.g.,
Motte et al. 2007; Hill et al. 2012;Nguyen-Lu’o’ng et al. 2013). Motte et al.(2018) and references therein suggested that such massive filaments are supposed to be products of the global hierarchical collapse of molecular clouds. Be-cause the line mass of the ridges is significantly higher than the critical line mass of an isothermal filament (see
Inutsuka & Miyama 1997), by up to two orders of magnitude, they are supposed to be unstable against the global collapse and fragmentation. Although some formation/stabilization mechanism of the hub filaments and the ridges, such as large-scale compression and internal MHD (magneto-hydrodynamic) waves, have been proposed (Andr´e et al. 2016), the true nature is not fully understood, possibly due to the lack of the suitable targets in the solar neighborhood. ALMA is capable of resolving internal structures of molecular clouds even in external galaxies. In particular, the Large Magellanic Cloud (LMC) is an ideal laboratory to investigate high-mass star formation thanks to its nearly face-on view (Balbinot et al. 2015) and the close distance, ∼50 kpc (Schaefer 2008;de Grijs et al. 2014). It is also a great advantage to directly compare the distributions of molecular gas observed by ALMA and positions of massive YSOs identified by Spitzer and Herschel (e.g.,Gruendl & Chu 2009;Chen et al. 2010;Seale et al. 2014) without any serious contamination in the line of sight. Earlier studies using the H i gas observations by Fukui et al. (2017) found that there are supergiant shells (Kim et al. 1999, 2003) and kiloparsec-scale gas flows caused by the last tidal interaction between the LMC and the Small Magellanic Clouds (SMC). Therefore, we may be able to examine the relation between such large-scale gas kinematics and the local star formation activities. Our present target in this paper is the N159W-South clump, which was discovered by our previous ALMA Cycle 1 observations (Fukui et al. 2015, hereafter Paper I) with an angular resolution of ∼1′′
(∼0.24 pc) toward a GMC in the N159W region (e.g., Johansson et al. 1998; Minamidani et al. 2008, 2011). Paper I revealed that the GMC is composed of many filamentary molecular clouds and discovered the first example of protostellar outflows in the external galaxies. Paper I also found that the protostellar source with a stellar mass of ∼37 M⊙ in the N159W-South clump is located toward an intersection of two
filaments and suggested that the filament–filament collision triggered the protostar formation. Although the ALMA observations significantly improved our understanding of molecular cloud structures and star formation in this object, much higher-angular-resolution studies are needed to further resolve the filamentary structures down to a width of .0.1 pc (see,Arzoumanian et al. 2011,2019) and investigate the star formation activities therein.
In this paper, we present high-angular resolution observations obtained in ALMA Cycle 4 (P.I.: Y. Fukui #2016.1.01173.S) with ∼0.′′
25 (∼0.07 pc) resolution toward the South clump. We also observed the N159W-North and the N159E-Papillon region in the same project. The observational results of the N159E-Papillon region, which is considered to be in a later evolutionary stage than the N159W-South clump (Saigo et al. 2017), are presented in a separate paper (Fukui et al. 2019, hereafter FTS19).
We carried out ALMA Cycle 4 Band 6 (211–275 GHz) observations toward the N159W with the main array 12 m antennas. The observations of N159W-South centered at (αJ2000.0, δJ2000.0) = (5h39m41.s0, −69◦46′06.′′0) were carried
out between 2016 November and 2017 July. There were three spectral windows targeting12CO (J = 2–1), 13CO (J
= 2–1) and C18O (J = 2–1) with a bandwidth of 58.6 MHz. The frequency resolutions were 30.6 kHz for 12CO (J =
2–1) and 61.0 kHz for the others. We used two spectral windows for the continuum observations with the aggregated bandwidth of 3.75 GHz. The observed frequencies include some line emission, such as the radio recombination line of H30α and SiO (J = 5–4). The projected baseline length ranges from 14 to 1940 m.
The data were processed with the CASA (Common Astronomy Software Application) package (McMullin et al. 2007) version 5.0.0. We used the tclean task in the imaging process with the multi-scale deconvolver to recover the extended emission. The imaging grid and velocity channels were 0.′′07 and 0.2 km s−1, respectively, and we applied
the Briggs weighting with the robust parameter of 0.5. We used the auto-multithresh procedure in tclean to select the emission mask in the dirty and residual images. We continued the deconvolution process until the intensity of the residual image reached ∼1σ noise level. The synthesized beams of the continuum and the13CO (J = 2–1) observations
are 0.′′26 × 0.′′23 and 0.′′29 × 0.′′25, respectively. The (1σ) RMS noise levels of the line and the 1.3 mm continuum
are ∼4.5 mJy beam−1 (∼1.5 K) at a velocity resolution of 0.2 km s−1 and ∼0.027 mJy beam−1. We concluded that
the previous ALMA Cycle 1 observations (Paper I, see also Nayak et al. 2018) did not show significant missing flux of this source based on a comparison between the ALMA and the single-dish observations. The total fluxes of the
12CO,13CO, and the 1.3 mm continuum data of the Cycle 4 were ∼20% lower than those of the Cycle 1. Because the
current observations fully cover the baseline range of the previous one, 16–395 m, the discrepancies are supposed to be mainly caused by the calibration error instead of the missing flux. We thus use the Cycle 4 data alone in the following analysis.
3. RESULTS
3.1. A dense filamentary cloud traced by the 1.3 mm dust-continuum emission associated with molecular outflows Figures1(a-c) show 1.3 mm dust continuum distributions toward the N159W-South clump. Although the previous low-resolution (∼1′′) data shown in the panel (a) identified the clump as a single-source with a north–south elongation
(see also Paper I), the present Cycle 4 high-resolution observations clearly resolved the filamentary structure with multiple local maxima. We named the four major continuum maxima as MMS-1, 2, 3, and 4 labeled in Figure 1
(c). The positions of MMS-1 and MMS-2 correspond to near-infrared (NIR) sources, #121 and #123, respectively (Testor et al. 2006). These sources were originally discovered as a single source (P2) by Jones et al.(1986), and the subsequent high-resolution observations with the VLT (Very Large Telescope) resolved it into more than two sources (Testor et al. 2006, see also the Gemini observations by Bernard et al. 2016). In the Ks-band observations, the two
NIR sources have almost the same magnitude (13.59 mag for #121, and 13.40 mag for #123), and are the brightest ones and highly reddened among the Testor’s sample. Testor et al. (2006) concluded that the two sources are considered to be YSOs. MMS-3 and 4 have no counterparts in the infrared observations. The sources detected by Testor et al.
(2006) were in the Ksmagnitude range of 13.40–19.4 mag. Although this means that the embedded sources in MMS-3
and 4 are much fainter than the known NIR sources, the presence of the outflow activities (see the later paragraph) strongly indicates that there are YSOs in the sources. We derived the physical properties of the millimeter-sources as listed in Table1. We assumed the absorption coefficient per unit dust mass at 1.3 mm, and the dust-to-gas mass ratio and the dust temperature to be 1 cm2g−1, 3.5 × 10⁻³, and 20 K, respectively, to derive the gas mass from
the dust emission (see,Ossenkopf & Henning 1994;Herrera et al. 2013;Gordon et al. 2014; Paper I). The separations among the dust peaks are roughly ∼0.2 pc.
We characterized the properties of the 1.3 mm filamentary clouds. The total mass of the filamentary structure traced by the continuum above the 3σ detection is ∼4 × 10³M
⊙, which is consistent with the previous estimate (Paper I).
We searched the peak positions (i.e., crests of the filament) in the R.A. direction along each decl. bin of Figure1(c). The length of the filament crests is ∼1.7 pc. We performed the Gaussian fitting to the cross section taken along the filament crest. The averaged width (FWHM) of the filament is ∼0.14 pc. The resultant line mass (=total mass/length) of the filament is ∼2 × 10³M
⊙pc−1. These properties are consistent with those of “ridges” in Galactic high-mass
star-forming clouds (e.g., NGC 6334,Andr´e et al. 2016).
We have detected compact high-velocity wings in the12CO (J = 2–1) observations tracing outflows from the
proto-stellar sources. We identified the outflow components as follows. Based on the12CO channel map, we searched
(a)
(b)
(c)
(c)
1.3 mm (Cycle 1) 1.3 mm (Cycle 4) + CO outflows 1.3 mm (Cycle 4) Beam (0."26 ! 0."23) Beam (0."26 ! 0."23) Beam (1."3 ! 0."8) MMS-1 MMS-2 MMS-3 YSO-SN mm sources NIR sources N 159W ÐS out h cl um p MMS-4Figure 1. 1.3 mm continuum distributions and molecular outflows toward the N159W-South clump. (a) Gray-scale image of the 1.3 mm continuum emission obtained in the previous Cycle 1 study (Paper I). The white crosses represent the positions of the infrared sources identified with the VLT observations (Testor et al. 2006). The yellow and green crosses denote the dust-continuum peaks of MMS-3 and 4, and the median position between the redshifted and blueshifted outflow lobes shown in panel (b), respectively. (b) The gray-scale image and white contours are the same as (a) but for the high-resolution Cycle 4 data. The minimum contour level and the subsequent steps are 0.1 and 0.2 mJy beam−1, respectively. Redshifted and blueshifted outflow
lobes in12
CO (J = 2–1) are shown in blue and red contours, respectively. The contour levels are 10, 20, 30, and 40 K km s−1.
The integrated-velocity ranges are shown in dashed lines in panels (a-d) of Figure2. (c) Zoomed-in view of the N159W-South clump in 1.3 mm continuum showing the filamentary structure. The white dashed lines, corresponding to ∼0.4 mJy beam−1,
represent the boundary of the identified millimeter sources.
Table 1. Properties of 1.3 mm continuum sources in the N159W-South clump
Name α(J2000.0) δ(J2000.0) Fν(mJy)
a Fmax(mJy beam−1) Npeak(cm−2)b M(M⊙)c NIR sourced
MMS-1 5h39m41.s97 -69◦46′12.′′05 1.5 0.82 1.2 × 1024 2.1 × 10² 121 MMS-2 5h39m41.s88 -69◦46′11.′′69 0.47 0.52 8.5 × 10²³ 6.2 × 101 123 MMS-3 5h39m41.s81 -69◦46′10.′′93 1.6 0.63 1.0 × 1024 2.1 × 10² · · · MMS-4 5h39m41.s79 -69◦46′10.′′25 0.43 0.41 6.5 × 10²³ 5.6 × 101 · · · a Flux of the millimeter emission integrated above the white dashed lines in each source.
b H2column density at the peak position.
c Total mass integrated above the white dashed lines in each source. d Name of associated near infrared sources (Testor et al. 2006).
the spectra of the high-velocity emission. We manually selected the lowest velocities of the redshifted/blueshifted outflows to avoid the strong emission of the parental filamentary clouds. Using the velocity-smoothed data, we defined the highest velocities where the intensities of the wing components are close to zero levels. The red and blue contours in Figure1(b) show the distributions of the outflow components, and the averaged spectra in each outflow are shown in Figure2. For the sources in Figure1(c), the previous12CO observations identified these multiple flows as a single
bipolar flow due to the lack of the angular resolution (Figure 2 in Paper I). The blue/red wings from MMS-1 and 2 are possibly merged, as shown in Figure1(b). Especially for the blue component, it is hard to separate the individual components. We plotted the same spectra in the Figures2 (d), (e) and listed as the blue wing of MMS-1. Although the redshifted components around the MMS-1 and 2 are also spatially merging, there are multiple local peaks in the contours. The presence of at least two individual YSOs (#121, and #123) in each millimeter source indicate that the spatially merging blue/redshifted lobes are originated from the protostars. Nevertheless, higher-angular-resolution observations in CO will be able to clearly resolve the individual outflow components. On the other hand, the out-flows around MMS-2 and 3 are well spatially separated, indicating that they are individual outout-flows launched by the embedded YSOs. Note that the broadening of the 12CO linewidths toward the millimeter sources is considered to be
originate from not only the outflowing gas but from cloud–cloud collision. We discuss the latter effect in Sect. 3.2. In addition to the above, we discovered a new candidate of bipolar outflow ∼2 pc away from the N159W-South clump (Figures1(b) and2(a)). The green crosses indicate the position of the center of the high-velocity gas in Figures
1 (a,b). This strongly indicates that there is at least one embedded protostar; we hereafter call this source YSO-SN. Although this source is located in the13CO filamentary cloud, as shown in Figure3, we could not detect any 1.3 mm
continuum emission with the present sensitivity. This suggests that the parental core is less massive than the other millimeter sources in the N159W-South clump. We need high-sensitivity and high-angular resolution observations in millimeter/submillimeter continuum or high-density molecular gas tracers to characterize the nature of the parental core of YSO-SN.
We estimated the physical parameters of these outflows and have listed them in Table 2. In order to derive the masses of the outflows, we adopted a conversion factor from12CO (J = 1–0) intensity to the column density of X
CO
= 7 × 1020cm−2 (K km s−1) and the12CO (J = 2–1)/12CO (J = 1–0) ratio = 1.0, with the case of a gas kinematic
temperature of ∼30 K and a volume density of ∼104cm−3(Beuther et al. 2002b). We measured the projected distances
to the peak intensity of the outflow lobes from the continuum peaks MMS-1, 2, 3, and 4. For YSO-SN, we adopted the length of the blueshifted and redshifted lobes as the distance. Using the maximum velocity with respect to the systemic velocity measured from the13CO spectra (Figure2), we estimated the dynamical time (t
d = distance/velocity) of the
flow by assuming an inclination angle of 30◦–70◦. We calculated the outflow force (F
CO) by using the procedure in
Beuther et al.(2002b). The relations between the FCOand the core mass derived from the dust emission for MMS-1,
2, 3 and 4 roughly follow those seen at massive protostellar sources in the Galaxy (Beuther et al. 2002b). Although we could not detect dust emission from YSO-SN, this is also considered to be a massive source because the outflow parameters are very similar to those of the other massive sources. We thus conclude that at least five protostellar sources with separations of ∼0.2–2 pc are forming along the filamentary cloud without significant time delay more than ∼104 yr based on the dynamical time of the outflows (Table 2). We also found similar star formation activities in the N159E-Papillon region (FTS19). Note that the directions of the outflows in the N159W-South clump are roughly perpendicular to the orientation of the filament, indicating that the magnetic field directions are also perpendicular to that. We discuss the formation scenario of the YSOs and the filament in Sect. 4.
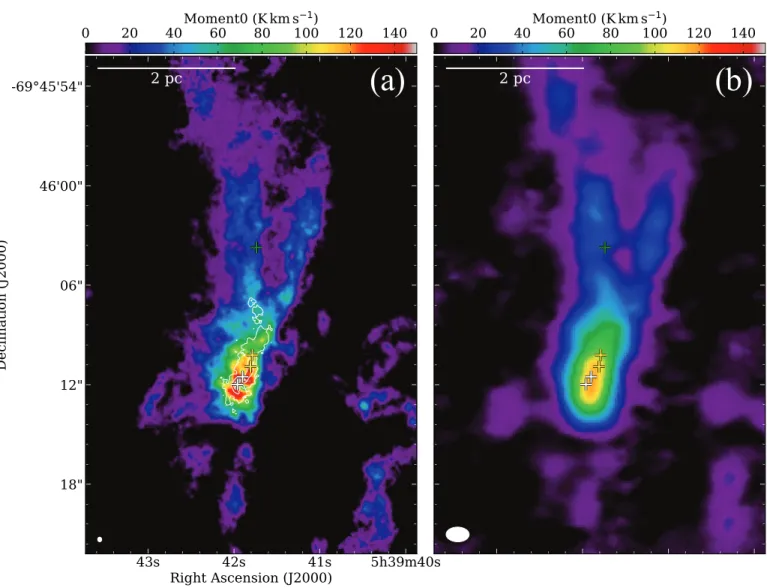
3.2. Velocity and spatial structures of the13CO filamentary clouds
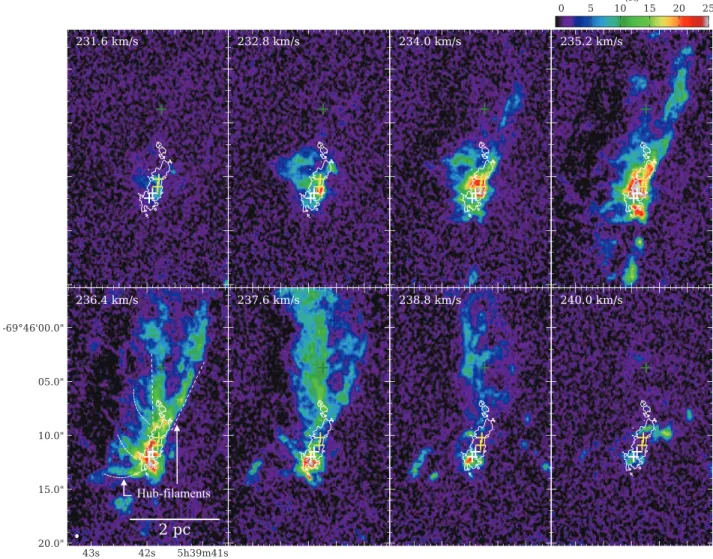
Figure3shows the13CO (J = 2–1) distributions around the N159W-South clump. The overall distributions of both
Cycle 1 and 4 data are quite similar, suggesting that the new observations well recover the total flux of the previous one (see Sect. 2). The previous Cycle 1 data represent a relatively simple shape, which is composed of overlapping by the two linear-shaped filaments. In contrast to this, the Cycle 4 data trace further complex substructure of the filaments entangled by the multiple filaments. Looking into the velocity structures as shown in the channel maps of Figure4, the complexity becomes more apparent. For example, one of the most striking features is hub-like filaments entangled toward the dust filament around the velocity channel of ∼237 km s−1 (dashed lines in the lower left panel
in Figure 4). Similar morphologies are seen in the Galactic high-mass star-forming clumps (e.g., Motte et al. 2007;
Peretto et al. 2013;Williams et al. 2018). We calculated the column densities using the13CO (J = 2–1) data assuming
210 220 230 240 250 260 270
Velocity (km/s)
0
25
50
Brightness temp. (K)
(e1) MMS-1
0
25
50 (d1) MMS-2
0
25
50 (c1) MMS-3
0
25
50 (b1) MMS-4
0
25
50 (a1) YSO-SN
12CO Blue
12CO Red
13CO
220
230
240
250
260
Velocity (km/s)
0
25
50
Brightness temp. (K)
(e2) MMS-1
0
25
50 (d2) MMS-2
210 220 230 240 250 260 270
0
10
20 (c2) MMS-3
0
10
20 (b2) MMS-4
0
10
20 (a2) YSO-SN
12CO Blue
12CO Red
13CO
Figure 2. Outflow spectra toward the N159W-South clump. (a1)–(d1) Red and blue lines of averaged spectra of the outflow wings for MMS-1,2,3,4 and YSO-SN over the regions inside the lowest red and blue contours, respectively, in Figure1(b). The blue and red dotted lines show the defined velocity ranges of the outflows (see also Table2). Note that the same spectra are plotted as the blue wings in panels (d1) and (e1) (see the text). The red lines are offset by +10 K for the visualization. The gray lines show the13CO (J = 2–1) spectra at the positions of MMS-1, 2, 3 and YSO-SN. Black lines indicate the central velocities obtained by fitting the13
CO spectra with a single Gaussian profile. (a2)–(e2) Same as (a1)–(e1) but for the enlarged views (in Y-axis for (a)–(c), and X-axis for (d) and (e)), to stress the wing features of the outflow spectra.
to search the connecting structures (i.e., filaments) in the PPV space (see also the detailed procedure in FTS19). The column density, line mass, and width (FWHM) of the typical filaments are ∼1022–1023cm−2, a few hundred M⊙pc−1,
and ∼0.1 pc, respectively, except for the highest column density part with the 1.3 mm continuum detection. These filaments are significantly more massive than those in the solar neighborhood (seeArzoumanian et al. 2011) and close to those in the high-mass star-forming region (e.g., Vela C,Hill et al. 2012).
The velocity analysis of the 13CO data found that the blueshifted (230.0–233.2 km s−1) and redshifted (239.0–
242.0 km s−1) components have the complementary distributions (Figure5 (a)). The first-moment intensity-weighted
velocity map using the full-velocity range of the 13CO data also shows a similar trend. Complementary gas
distribu-tions are often found in regions with cloud–cloud collision events (e.g,Furukawa et al. 2009; Matsumoto et al. 2015;
Torii et al. 2017; Hayashi et al. 2018; Nishimura et al. 2018; Sano et al. 2018; Tokuda et al. 2018; Fukui et al. 2017,
Table 2. Outflow properties in the N159W-South clump
Source Name Outflow Lobe Mass (M⊙) Distance (pc) Velocitya(km s−1) Velocity Range (km s−1) t bb(yr) MMS-1 Blue lobe c 7.2 0.13 14.5 223–227 5.1–25 × 103 Red lobe 2.8 0.07 15.5 249–253 2.6–13 × 103 MMS-2 Red lobe 3.4 0.12 19.1 249–255 3.6–17 × 103 MMS-3 Blue lobe 4.4 0.06 24.9 210–222 1.4–6.5 × 10 3 Red lobe 4.5 0.05 21.1 242–256 1.3–6.1 × 10³ MMS-4 Blue lobe 1.2 0.05 24.8 210–223 1.1–5.4 × 10 3 Red lobe 2.6 0.06 20.2 243–255 1.7–8.0 × 10³
YSO-SN Blue lobe 1.5 0.17 22.1 210–230 4.3–20 × 10
3
Red lobe 3.2 0.17 27.9 242–260 3.4–16 × 103
a Maximum radial velocity of the outflow lobe with respect to the systemic velocity. b Dynamical time assuming the inclination angles of 30◦
–70◦ .
c This blue lobe is considered to be merged with that from MMS-2 (see the text and Figure1(c)).
investigate the gas kinematics (Figure 5). The 13CO PV diagram shows two high-velocity components both in the
redshifted and blueshifted sides, as indicated by the green dotted lines in Figure 5 (b). The positions of the high-velocity (V-shaped) features are close to those of star-forming protostellar sources (MMS-1, 2, 3, and 4). Although the V-shaped structures seem to be related to the protostellar activities, they are not explained by the outflows alone. With respect to the12CO PV diagram (Figure5(c)), the positions of the high-velocity components due to the outflows
indeed correspond to those of millimeter sources. On the other hand, there are position discrepancies between the crests of the V-shaped features in13CO and those of the outflows in12CO. The spatial extent of the V-shaped features
is ∼0.5 pc, which is much broader than that of the outflows, ∼0.1 pc. We interpret that the V-shaped features as originating from the cloud–cloud collision as the trigger of the protostar formation in this region (see also discussions in Sect. 4.2). A similar position discrepancy between a V-shaped feature and an outflow on the PV diagram is also found in the Galactic high-mass star-forming region RCW34 (Hayashi et al. 2018).
4. DISCUSSIONS
4.1. Dynamical state of the massive filament in the N159W-South clump
In this section, we discuss the formation scenario of the high-mass protostars and the filamentary molecular clouds in the N159W-South region. The line mass of the filaments in this region is as large as ∼a few × 102–103M
⊙pc−1.
Such massive filaments should be in a “supercritical” state (see Inutsuka & Miyama 1997), and are considered to fragment and radially collapse within the freefall time. We speculate that the massive filaments that we see in the present observations are formed quite recently and may be gravitationally unstable objects (see also discussions in
Andr´e et al. 2016). The typical velocity dispersion (σv) of the N159W-South clump is ∼1.7 km s−1 in13CO, and the
resultant virial mass per unit length (Mvir,line= 2σv/G) is calculated to be 1.3 × 10³M⊙pc−1. Note that the magnetic
field can be an additional factor to stabilize the filament, depending on the strength as expressed byInoue et al.(2018). In this case, a strong magnetic filed (&2 mG) is needed to stabilize the observed massive filament with the line mass of ∼2 × 10³M
⊙pc−1 in the N159W-South clump. This is inconsistent with recent observations toward Galactic
massive star-forming regions (e.g.,Pillai et al. 2015; Pattle et al. 2018). In summary, we suggest that the turbulent and magnetic pressure may not stabilize the filament.
Assuming the cylindrical shape of the filament with a width of ∼0.14 pc (Sect. 3.1), the averaged density is calcu-lated to be ∼106cm−3. The freefall time of the gas density is ∼104yr, which is consistent with the lifetime of the
starless phase of massive dense cores suggested by the observations toward the Galactic massive star-forming regions (Motte et al. 2018and references therein). The short dynamical time of the outflows (∼104yr) indicates the embedded
YSOs are in an extremely young phase after their formation. In addition, the presence of an outflow source YSO-SN without the 1.3 mm continuum detection may imply that the star formation was initiated before the formation of the parental dense material (i.e., dense core), although further careful investigations are needed to obtain a robust
(a)
(b)
Figure 3. 13CO (J = 2–1) distributions of the N159W-South region. (a) Color scale of the velocity-integrated intensity map of13
CO (J = 2–1) obtained by the Cycle 4 observations. The white, yellow, and green crosses and white contours are the same as those in Figure1. The angular resolution, 0.′′29 × 0.′′25, is given by the white ellipse in the lower left corner. (b) Same as (a)
but for the Cycle 1 data. The angular resolution, 1.′′3 × 0.′′8, is given by the white ellipse in the lower left corner.
conclusion through follow-up observations, as mentioned in the Sect. 3.1. In summary, we suggest that there is a possibility that the filaments and the protostars in the N159W-South region were formed at almost the same time, within an order of ∼104yr.
4.2. Possible formation mechanisms of the massive filament and high-mass protostars
Recent studies of Galactic star-forming regions suggest that massive filaments (ridges) have hub- or web-like struc-tures, which may be a consequence of the global hierarchical collapse (Motte et al. 2018 and references therein). Such an interpretation is based on the gas kinematics traced by molecular line observations showing a parsec-scale (line-of-sight) velocity gradient along with the filamentary structures (e.g.,Peretto et al. 2014). In the N159W-South clump, the velocity gradient is small, with a velocity of ∼237 km s−1 on the top side and a quickly changed velocity
of ∼235 km s−1 close to the positions of the millimeter sources with outflows (yellow crosses in the dotted rectangle
of Figure5(a)). Although this type of velocity sequence (i.e., positive–negative–positive) can be regarded as gravita-tional contraction toward the center of the gravitagravita-tional potential (e.g.,Hacar et al. 2017) if we directly rely on the 2D
Hub-filaments
Figure 4. Velocity-channel maps toward the N159W-South clump in13
CO (J = 2–1). The lowest velocities are given in the upper left corners in each panel. The white contours show the 1.3 mm continuum emission as shown in Figure1. The contour level is 0.1 mJy beam−1. The angular resolution is given as a white ellipse in the lower left corner of the lower left panel, 0.′′29
× 0.′′25. The white, yellow, and green crosses are the same as those in Figure1.
velocity map, recent 3D numerical simulation byLi & Klein(2019) cautioned that such an interpretation based on the line-of-sight velocity map could lead to an incorrect conclusion. They demonstrated that this type of velocity map is reproduced by a collision of the gas flow of two clouds and our velocity map in Figure5(a) is very similar to the middle panel of Figure 16 in Li & Klein (2019). With respect to the PV diagram of Figure 5 (b), we found two V-shaped features and indicate them with green lines on the blueshifted and redshifted sides around the high-mass star-forming millimeter sources. Numerical simulations (Takahira et al. 2014) and the synthetic observations (Fukui et al. 2018b) of colliding clouds also reproduce similar V-shaped structures in the PV diagram. The present gas characteristics are consistent with the previous cases of the cloud–cloud collision as the trigger of massive star formation. Additonally,
Arzoumanian et al. (2018) found a young filament in Taurus with a similar V-shape feature in the PV diagram and they suggested that convergence of flow is a convincing mechanism of the filament formation. In summary, we conclude that the convergent flows or collisions between two clouds are more likely rather than a global hierarchical collapse, to interpret the velocity structure of the13CO data in this system.
Figure 5. Velocity structures in13
CO (J = 2–1) toward the N159W-South clump. (a) The first-moment intensity-weighted velocity map of13
CO (J = 2–1) is shown in color scale. The blue and black contours show the velocity-integrated intensity of 13
CO (J = 2–1) with a range of 230.0–233.0 km s−1 and 239.0–242.0 km s−1. The lowest contour level and the subsequent
contour step are 3 and 4 K km s−1, respectively. The white and yellow crosses are the same as those in Figure1. The angular
resolution is given by the ellipse in the lower right corner. (b) A 13
CO (J = 2–1) position-velocity diagram along the regions shown by the dashed rectangle in panel (a). The X-axis represents angular distances in parsecs from the position of MMS-1. The vertical dashed lines in panel (b) represent the position of the millimeter sources with the outflows. The cyan and red horizontal lines show the velocity ranges for the blueshifted and redshifted components, respectively, in panel (a). The green dashed lines stress V-shaped features, possible signs of cloud–cloud collision (see the text). (c) Same as (b) but for12CO (J = 2–1).
We previously discussed that a collision between two massive filaments with a line mass of a few 100 M⊙pc−1
triggered the massive star formation, based on the lower-resolution results (Paper I, see also Figure3(b)). However, such a simple model of two colliding filaments may be hard to reconcile with the complex hub filaments revealed by the present observations. The complex filaments themselves are considered to have originated from-much larger scale kinematics, such as colliding flows. Based on the observational study in Taurus,Tafalla & Hacar (2015) proposed a “fray and fragment” scenario composed of two steps. The supersonic collision between two flows creates a network of filaments/fibers, and then the filament system fragments into individual cores or groups of cores (chains). Although the mass of the cores in the N159W-South clump is one or two orders of magnitude higher than that in Galactic low-mass star-forming regions, such as Taurus, there are some common features: the separation of individual cores (∼0.1–0.2 pc) and its chain-like morphology, as presented by Tafalla & Hacar (2015). With respect to the outside of the N159W region, there is another star-forming filament complex in the N159E region located at ∼50 pc away from the N159W-South clump (Saigo et al. 2017; FTS19). The N159E region has a compact H ii region, the Papillon Nebula at the edge/intersection of the hub filament, and thus it is slightly more evolved than the N159W-South clump. Nevertheless, there are little observable differences between the two objects in the filament properties and star-formation activities. The filamentary complexes in both the N159W-South and N159E-Papillon regions have conical shapes with a vertex on the south sides and hub-like features around the high-mass protostars, as well as the massive/dense filaments traced by the 1.3 mm continuum emission. In the velocity structures of 13CO (Figures 4, and 5; see also Figures 2 and 3
in FTS19), there are velocity gradients that are redshifted and blueshifted along the north–south direction, although the degree of the gradient (∼1 km s−1pc−1) in N159W is little smaller than that of the N159E, possibly due to the
continuum filament in both regions. In summary, the N159W-South clump is supposed to be an almost twin of the N159E-Papillon region. To explain the synchronized high-mass star and filament formation over a ∼50 pc scale, we consider a large-scale (>100 pc) triggering event rather than the local ∼10 pc motion around the N159W/E regions.
A systematic search of large H i structures in the LMC (Kim et al. 1999) found that the N159 region is located along the western edge of a H i supergiant shell, SGS19, which has a radius of ∼390 pc and an expansion velocity of ∼25 km s−1 (Dawson et al. 2013). More recently, Fukui et al. (2017) pointed out that the molecular ridge, the
most massive molecular complex in the LMC, contains the N159 region was formed by large-scale H i gas flows, with a relative velocity of ∼50 km s−1 induced by the last galactic tidal interaction between the LMC and the SMC.
The presence of the ongoing large-scale collision is also supported by the distribution of the Av map in this region
(Furuta et al. 2019). Such a high-velocity H i flow could be a promising candidate as the origin of the strong shock compression that produces the massive filaments and massive protostars in the N159W/E regions.
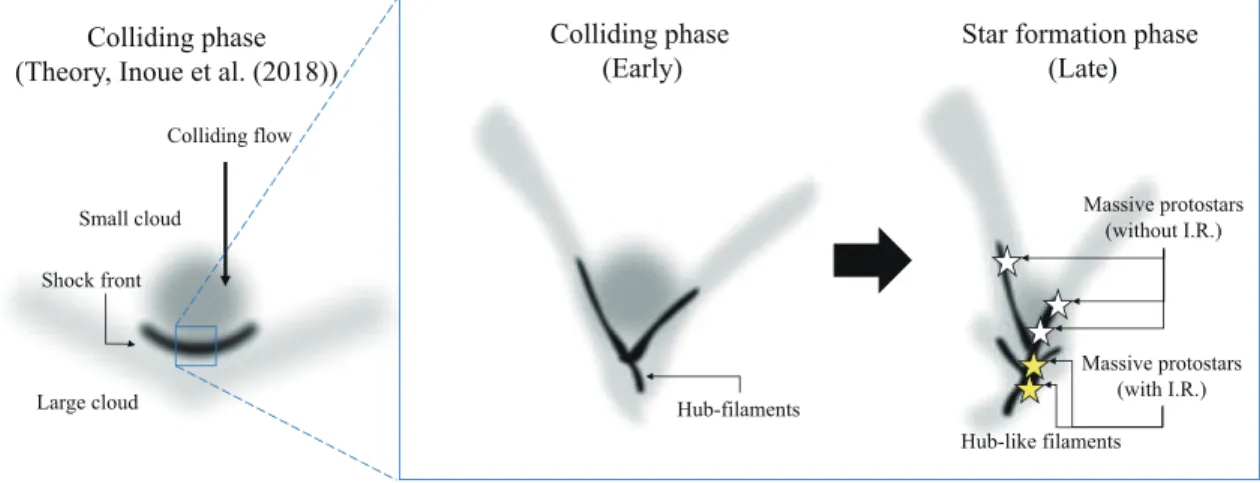
Inoue et al. (2018) performed numerical simulations of colliding clouds with magnetic field and turbulence and demonstrated that the turbulent inhomogeneous cloud is compressed by the shock wave, and hub filaments are de-veloped within a few 0.1 Myr after the collision. The first protostar (sink particle) is created in a few × 104yr after
the development of the filaments. A picture of star formation as understood by the theoretical study and the current observations is schematically shown in Figure6. Although there are no large differences in the dynamical time of the outflows toward each protostellar source of more than ∼104yrs, the evolutionary stages of the northern three sources
(MMS-3, 4, and YSO-SN) are supposed to be younger than the others based on the detection of the infrared emission (Figures1and6). This distribution is qualitatively explained if the initial small cloud collided with the extended cloud (Inoue et al. 2018) and the star-formation took place as the propagation of the interaction layer. The evolutionary sequence is also consistent with that in the N159E-Papillon region where the compact H ii region is growing at the southern edge of the filamentary clouds (FTS19).
Colliding phase (Theory, Inoue et al. (2018))
Colliding phase (Early)
Star formation phase (Late) Colliding flow Small cloud Large cloud Shock front Hub-like filaments Massive protostars (with I.R.) Hub-filaments Massive protostars (without I.R.)
Figure 6. Schematic views of the star formation triggered by a cloud–cloud collision in the N159W-South. A similar figure was presented by FTS19.
According to the simulations byInoue et al. (2018), a large velocity difference between the colliding clouds of the order of 10 km s−1 is initially needed to promote high-mass star formation activities (see also Inoue & Fukui 2013).
However, the density-weighted gas velocity is as small as ∼1–2 km s−1 with respect to the systemic velocity along
the star(sink particle)-forming filament, because the shock speed is decelerated in the dense region when the shock wave induced by the collision hits a dense clump (Fukui et al. 2018a; see also Inoue & Inutsuka 2012;Inoue & Fukui 2013). In the N159W-South clump, the mass-weighted velocity (i.e., local peaks on the PV diagram of Figure5 (b)) around the protostellar sources is also not significantly shifted, not more than a few tens of km s−1, with respect to
the systemic velocity, ∼236 km s−1. This is consistent with the simulations. We thus suggest that the initial collision
velocity might be at least a few × 10 km s−1 based on the H i studies as mentioned in this section, and then, the
collision shock velocity was considered to be decelerated in the dense region. In the H i colliding flow scenario, we note that there is an issue regarding the formation time-scale of H2 molecules if the large-scale H i compression quickly
on dust grains is considered to be as long as ∼107yr, with an atomic gas density of 102cm−2(Hollenbach & Salpeter
1971;Jura 1974), which is much longer than that of the filament formation as discussed above. Although it is possible, in principle, to make ∼104M
⊙ molecular filaments after the H i gas flow if there is a sufficient mass reservoir around
the filamentary cloud (Fukui et al. 2018a), further theoretical and observational investigations are needed to clearly understand the relation between the filament formation and high-velocity H i flows.
Another interesting feature is that the orientations of the observed outflows are roughly perpendicular to that of the filament (Sect. 3.1). This may indicate that the directions of magnetic fields are also perpendicular to the filament if the outflows were launched along the magnetic field direction. Simulations in Inoue et al. (2018) suggest that the magnetic field strength is significantly enhanced at the post-shock layer and massive filaments become perpendicular to the magnetic field. From an observational prespective, for example,Palmeirim et al.(2013) revealed that high-density filaments are perpendicular to the magnetic fields, while low-density striations are parallel in low-mass star-forming filaments in Taurus. Recent ALMA observations byKong et al.(2019) toward an infrared dark cloud found that large numbers of CO outflows are preferentially orthogonal to the parental filaments and discussed the presence of strong magnetic field as their origin. Future polarization observations toward the N159W-South clump with ALMA may provide us with further evidence of the cloud–cloud collision as the trigger for massive filament/protostar formation in terms of magnetic field.
5. SUMMARY
We have carried out ALMA observations with an angular resolution of ∼0.′′
25 (∼0.06 pc) toward the N159W-South region in the LMC. The 1.3 mm dust continuum traces a clear filamentary feature with a line mass of ∼2 × 10³M
⊙
and it has four local peaks with a strong indication of outflow activities. We have identified a new bipolar outflow source embedded at a 13CO filament, but it is located at ∼2 pc away from the massive dust filament. We have
revealed an early stage of multiple high-mass star formation as a few additional outflow sources along the 1.3 mm filamentary cloud. The molecular line observations in 13CO (J = 2–1) revealed the complex hub structures toward
the dust filament, rather than simple linear filaments, as reported in our previous lower-resolution observations. We propose that the massive protostars and filaments are formed from the large-scale flow, which is consistent with the recent theoretical simulations.
We thank Doris Arzoumanian and Shu-ichiro Inutsuka for discussions about the filamentary molecular clouds. This paper makes use of the following ALMA data: ADS/ JAO.ALMA#2012.1.00554.S and #2016.1.01173.S. ALMA is a partnership of the ESO, NSF, NINS, NRC, NSC, and ASIAA. The Joint ALMA Observatory is operated by the ESO, AUI/NRAO, and NAOJ. This work was supported by NAOJ ALMA Scientific Research grant No. 2016-03B and JSPS KAKENHI (grant No. 22244014, 23403001, 26247026, 18K13582, 18K13580, and 18H05440). The work of M.S. was supported by NASA under award number 80GSFC17M0002.
Software:
CASA (v5.0.0;McMullin et al. 2007)REFERENCES
Andr´e, P., Di Francesco, J., Ward-Thompson, D., et al. 2014, in Protostars and Planets VI, ed. H. Beutheret al. (Tucson, AZ: Univ. Arizona Press), 27
Andr´e, P., Rev´eret, V., K¨onyves, V., et al. 2016, A&A, 592, A54
Arzoumanian, D., Andr´e, P., Didelonet, P. et al. 2011, A&A, 529, L6
Arzoumanian, D., Andr´e, P., K¨onyves, V., et al. 2019, A&A, 621, A42
Arzoumanian, D., Shimajiri, Y., Inutsuka, S.-i., Inoue, T., & Tachihara, K. 2018, PASJ, 70, 96
Balbinot, E., Santiago, B. X., Girardi, L., et al. 2015, MNRAS, 449, 1129
Bernard, A., Neichel, B., Samal, M. R., et al. 2016, A&A, 592, A77
Beuther, H., Schilke, P., Gueth, F., et al. 2002a, A&A, 387, 931
Beuther, H., Schilke, P., Sridharan, T. K. 2002b, A&A, 383, 892
Chen, C.-H. R., Indebetouw, R., Chu, Y.-H., et al. 2010, ApJ, 721, 1206
Dawson, J. R., McClure-Griffiths, N. M., Wong, T., et al. 2013, ApJ, 763, 56
de Grijs, R., Wicker, J. E., & Bono, G. 2014, AJ, 147, 122 Fujii, K., Minamidani, T., Mizuno, N., et al. 2014, ApJ,
796, 123
Fukui, Y., Harada, R., Tokuda, K., et al. 2015, ApJL, 807, L4
Fukui, Y., Hayakawa, T., Inoue, T., et al. 2018a, ApJ, 860, 33
Fukui, Y., Kawamura, A., Minamidani, T., et al. 2008, ApJS, 178, 56
Fukui, Y., Kohno, M., Yokoyama, K., et al. 2018, PASJ, 70, S44
Fukui, Y., Tokuda, K., Saigo, K., et al. 2019, ApJ, 886, 14 Fukui, Y., Torii, K., Hattori, Y., et al. 2018b ApJ, 859, 166 Fukui, Y., Torii, K., Ohama, A., et al. 2016, ApJ, 820, 26 Fukui, Y., Tsuge, K., Sano, H., et al. 2017, PASJ, 69, L5 Furukawa, N., Dawson, J. R., Ohama, A., et al. 2009,
ApJL, 696, L115
Furuta, T., Kaneda, H., kokusho, T., et al. 2019, PASJ, 71, 95
Gordon, K. D., Roman-Duval, J., Bot, C., et al. 2014, ApJ, 797, 85
Gruendl, R. A., & Chu, Y.-H. 2009, ApJS, 184, 172 Habe, A., & Ohta, K. 1992, PASJ, 44, 203
Hacar, A., Alves, J., Tafalla, M., & Goicoechea, J. R. 2017, A&A, 602, L2
Hartmann, L. & Burkert, A. 2007, ApJ, 654, 988 Herrera, C. N., Rubio, M., Bolatto, A. D., et al. 2013,
A&A, 554, A91
Hayashi, K., Sano, H., Enokiya, R., et al. 2018, PASJ, 70, S48
Hill, T., Andr´e, P., Arzoumanian, D., et al. 2012, A&A, 548, L6
Hollenbach, D., & Salpeter, E. E. 1971, ApJ, 163, 155 Inoue, T., & Fukui, Y. 2013, ApJL, 774, L31
Inoue, T., & Inutsuka, S.-i. 2012, ApJ, 759, 35
Inoue, T., Hennebelle, P., Fukui, Y., et al. 2018, PASJ, 70, S53
Inutsuka, S., & Miyama, S., 1997, ApJ, 480, 681
Johansson, L. E. B., Greve, A., Booth, R. S., et al. 1998, A&A, 331, 857
Jones, T. J., Hyland, A. R., Straw, S., et al. 1986, MNRAS, 219, 603
Jura, M. 1974, ApJ, 191, 375
Kim, S., Dopita, M. A., Staveley-Smith, L., & Bessell, M. S. 1999, AJ, 118, 2797
Kim, S., Staveley-Smith, L., Dopita, M. A., et al. 2003, ApJS, 148, 473
Kong, S., Arce, H. G., Jos´e Maureira, M., et al. 2019, ApJ, 874, 104
Krumholz, M. R., Klein, R. I., McKee, C. F., Offner, S. S. R., & Cunningham, A. J. 2009, Science, 323, 754 Li, P. S., & Klein, R. I. 2019, MNRAS, 485, 4509
Matsumoto, T., Dobashi, K., & Shimoikura, T. 2015, ApJ, 801, 77
McMullin, J. P., Waters, B., Schiebel, D., Young, W., & Golap, K. 2007, in ASP Conf. Ser. 376, Astronomical Data Analysis Software and Systems XVI, ed. R. A. Shaw, F. Hill, & D. J. Bell (Tucson, AZ: Univ. Arizona Press), 127
Minamidani, T., Mizuno, N., Mizuno, Y., et al. 2008, ApJS, 175, 485
Minamidani, T., Tanaka, T., Mizuno, Y., et al. 2011, AJ, 141, 73
Mizuno, A., Onishi, T., Yonekura, Y., et al. 1995, ApJL, 445, L161
Motte, F., Bontemps, S., Schilke, P., et al. 2007, A&A, 476, 1243
Motte, F., Bontemps, S., & Louvet, F. 2018, ARA&A, 56, 41
Myers, P. C. 2009, ApJ, 700, 1609
Nagahama, T., Mizuno, A., Ogawa, H., & Fukui, Y. 1998, AJ, 116, 336
Nayak, O., Meixner, M., Fukui, Y., et al. 2018, ApJ, 854, 154
Nguyen-Lu’o’ng, Q., Motte, F., Carlhoff, P., et al. 2013, ApJ, 775, 88
Nishimura, A., Minamidani, T., Umemoto, T., et al. 2018, PASJ, 70, S42
Onishi, T., Kawamura, A., Abe, R., et al. 1999, PASJ, 51, 871
Onishi, T., Mizuno, A., Kawamura, A., Ogawa, H., & Fukui, Y. 1996, ApJ, 465, 815
Ossenkopf, V., & Henning, T. 1994, A&A, 291, 943 Palmeirim, P., Andr´e, P., Kirk, J., et al. 2013, A&A, 550,
A38
Pattle, K., Ward-Thompson, D., Hasegawa, T., et al. 2018, ApJL, 860, L6
Peretto, N., Fuller, G. A., Duarte-Cabral, A., et al. 2013, A&A, 555, A112
Peretto, N., Fuller, G. A., Andr´e, P. et al. 2014, A&A, 561, 83
Pillai, T., Kauffmann, J., Tan, J. C., et al. 2015, ApJ, 799, 74
Sano, H., Enokiya, R., Hayashi, K., et al. 2018, PASJ, 70, S43
Saigo, K., Onishi, T., Nayak, O., et al. 2017, ApJ, 835, 108 Schaefer, B. E. 2008, AJ, 135, 112
Schneider, N., Csengeri, T., Bontemps, S., et al. 2010, A&A, 520, A49
Seale, J. P., Meixner, M., Sewi lo, M., et al. 2014, AJ, 148, 124
Shima, K., Tasker, E. J., Federrath, C., & Habe, A. 2018, PASJ, 70, S54
Sousbie, T. 2011, MNRAS, 414, 350
Tafalla, M., & Hacar, A. 2015, A&A, 574, A104
Takahira, K., Tasker, E. J., & Habe, A. 2014, ApJ, 792, 63
Tan, J. C., Beltr´an, M. T., Caselli, P., et al. 2014, in Protostars and Planets VI, ed. H. Beuther et al. (Tucson, AZ: Univ Tucson Press), 149
Testor, G., Lemaire, J. L., Field, D., et al. 2006, A&A, 453, 517
Tokuda, K., Onishi, T., Saigo, K. et al. 2018, ApJ, 826, 8 Torii, K., Hattori, Y., Hasegawa, K., et al. 2017, ApJ, 835,
142
Williams, G. M., Peretto, N., Avison, A., Duarte-Cabral, A., & Fuller, G. A. 2018, A&A, 613, A11