HAL Id: hal-01373238
https://hal.inria.fr/hal-01373238
Submitted on 28 Sep 2016
HAL is a multi-disciplinary open access
archive for the deposit and dissemination of
sci-entific research documents, whether they are
pub-lished or not. The documents may come from
teaching and research institutions in France or
abroad, or from public or private research centers.
L’archive ouverte pluridisciplinaire HAL, est
destinée au dépôt et à la diffusion de documents
scientifiques de niveau recherche, publiés ou non,
émanant des établissements d’enseignement et de
recherche français ou étrangers, des laboratoires
publics ou privés.
STACOM-SLAWT Challenge: Left Atrial Wall
Segmentation and Thickness Measurement Using Region
Growing and Marker-Controlled Geodesic Active
Contour
Shuman Jia, Loïc Cadour, Hubert Cochet, Maxime Sermesant
To cite this version:
Shuman Jia, Loïc Cadour, Hubert Cochet, Maxime Sermesant. STACOM-SLAWT Challenge: Left
Atrial Wall Segmentation and Thickness Measurement Using Region Growing and Marker-Controlled
Geodesic Active Contour. 7th International Statistical Atlases and Computational Modeling of the
Heart (STACOM) Workshop, Held in Conjunction with MICCAI 2016, Oct 2016, Athens, Greece.
pp.211-219. �hal-01373238�
Left Atrial Wall Segmentation and Thickness
Measurement Using Region Growing and
Marker-Controlled Geodesic Active Contour
Shuman Jia1
, Lo¨ıc Cadour1
, Hubert Cochet2
, and Maxime Sermesant1
1
Universit´e Cˆote d’Azur, Asclepios Research Group, Inria, Sophia Antipolis, France
2
IHU Liryc, CHU Bordeaux, University of Bordeaux, Pessac, France
Abstract. Analyzing the structure of the left atrium can provide
pre-cious insights into the pathology of atrial fibrillation, eventually result-ing in optimization of treatment plans. In this paper, an interactive and patient-specific method is presented to segment the left atrial
en-docardium3
, the left atrial epicardium and measure the left atrial wall thickness from cardiac computed tomography images. A region growing algorithm was adapted to segment the left atrial endocardium, whereas the left atrial epicardium was segmented indirectly: a marker-controlled geodesic active contour model was defined on its surrounding environ-ment. The results of the left atrial wall thickness were then mapped onto meshes generated from the endocardium segmentation. We tested our pipeline on 10 datasets as a part of the STACOM 2016 Left Atrial Wall Segmentation Challenge and we compared our method with man-ual segmentation. Aimed at facilitating the segmentation of the left atrial thin-wall structure, this pipeline is partially implemented in MUSIC soft-ware for clinical use. The expertise of clinicians can be added through the choice of specific parameters for each patient, although this remains optional owing to the robustness of the approach.
Keywords: atrial fibrillation, left atrial wall thickness, 3-dimensional
image segmentation, cardiac computed tomography (CT), region grow-ing, geodesic active contour.
1
Introduction
Atrial fibrillation (AF) is the most common type of cardiac arrhythmia, charac-terized by uncoordinated electrical activation and disorganized contraction of the atria. Around 2% to 3% of the population in Europe and North America, as of 2014, were affected, and its prevalence rate is increasing worldwide [1]. This epi-demic, with or without symptoms, is likely to be associated with life-threatening consequences, including heart failure, heart attack and stroke.
3
We refer to the segmentation of the region inside the left atrial endocardium as the segmentation of the left atrial endocardium, the same for epicardium.
2 S. Jia, L. Cadour, H. Cochet, and M. Sermesant
Atrial ablation, an effective treatment for AF, may be recommended for drug refractory patients. This invasive procedure establishes transmural lesions to block the arrhythmia while avoiding impairing extra-cardiac tissues. Thereby the radio-frequency power dose, delivered for ablation during the procedure, relies on local myocardial thickness, which demonstrates variations by region and by subject [2, 3]. Reduction of left atrial (LA) wall thickness also appears in AF patients when compared with controls, according to study by autopsy [4].
Model-based segmentation and region growing approach have been tested on the segmentation of the left atrium [5, 6]. Furthermore, several methods have been developed to measure automatically the LA wall thickness from computed tomography (CT) images. In [7], a segmentation of the wall on four regions, inter-atrial septum, below right inferior pulmonary vein, appendage and anterior wall was performed whereas [8, 9] chose to build a pipeline based on multi-region segmentation method. However, this task remains challenging, because the LA wall is heterogeneous, possibly consisting of fat granules and fibrosis, especially in patients of myocardial diseases or persistent AF. The accuracy of the segmentation is also difficult to validate, as few manual segmentations or reliable ground truths are available.
In this paper, we present an interactive pipeline to segment the LA wall and measure wall thickness from cardiac CT images. The expertise of clinicians can be introduced through the choice of parameters. Compared to previous works, we propose an inverse way to segment the LA thin-wall structure. The segmenta-tion was divided into 2 parts, LA endocardium and LA epicardium. The former was segmented with high accuracy using region growing combined with patient-specific intensity value threshold. The latter was segmented indirectly from its surrounding environment, to address the fuzzy boundaries problem. Algorithms employed were in 3-dimensional (3D) space.
The rest of the paper is organized as follows: we summarize our method using a flowchart in section 2, along with detailed illustration of region growing and marker-controlled geodesic active contour algorithms. Results and evaluation are shown in section 3, and a discussion of the limitations of this study in section 4.
2
Materials and Methods
2.1 Data Acquisition and Pre-processing
The method was applied to a database consisting of 10 3D CT image datasets, provided by the STACOM Left Atrial Wall Thickness Challenge.
Coronary Computed Tomography Angiography (CCTA) was performed on a Philips 256 iCT scanner. All patients were injected with an intravenous contrast agent. The scans were ECG-gated in a single breath hold. The images were acquired at 0.5 mm in-plane resolution with a slice thickness of 1 mm, and reconstructed to a 0.8 to 1.0 mm slice thickness with a 0.4 mm slice increment and a 250 mm field of view. The image matrix was kept at 512 × 512 matrix, constructed with a sharp reconstruction kernel [10]. The pixel values were in Hounsfield units (HU).
The images were manually cropped around the region of interest, namely the left atrium. The intensity values outside the range from -500 HU to 500 HU were set to nearer bound, so as to obtain a better visualization of blood pool, muscles and fat within the region that was meant to be segmented.
2.2 Methodology
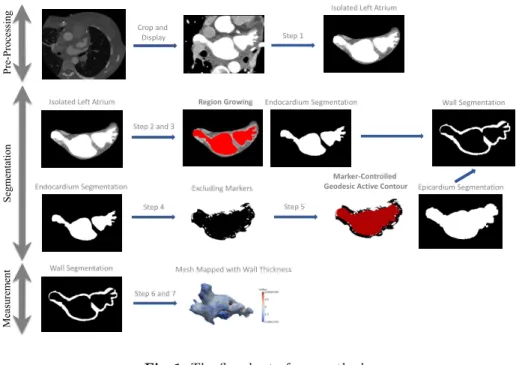
We summarize our method into following steps, as shows the flowchart in Fig. 1: 1. Drawing polygons on axial slices of CT images to isolate the left atrium4
. 2. Sampling intensity values of blood and muscles.
3. Segmenting the LA endocardium using region growing according to inten-sity values statistics.
4. Thresholding neighboring tissues (fat, other blood pools) of the LA wall. 5. Segmenting the LA epicardium using geodesic active contour based on markers of neighboring tissues.
6. Calculating distance map of the LA endocardium segmentation. 7. Mapping the distance onto meshes of the LA endocardium.
Pre -Processing Segm ent at ion Measurem ent Crop and Display Step 1 Step 2 and 3
Region Growing Endocardium Segmentation
Excluding Markers Epicardium Segmentation Step 5
Mesh Mapped with Wall Thickness Step 6 and 7
Marker-Controlled Geodesic Active Contour
Wall Segmentation
Isolated Left Atrium
Isolated Left Atrium
Endocardium Segmentation Step 4
Wall Segmentation
Fig. 1.The flowchart of our method.
4
For step 1, polygons are drawn manually on a dozen of slices for each case and then interpolated automatically on the rest. Images are shown in axial planes.
4 S. Jia, L. Cadour, H. Cochet, and M. Sermesant
Currently most steps are implemented in MUSIC software (multimodality software for specific imaging in cardiology, developed by IHU Liryc, University of Bordeaux and Inria Sophia Antipolis) [11].
2.3 Region Growing
We chose one pixel inside the left atrium, a connected component, as seed. The seed was raised into a gowning region. Neighboring pixels next to the growing region whose intensity values fell within a certain range were considered part of the left atrium. The region evolved iteratively until no more pixel was assigned. To determine whether a pixel belonged to the left atrium, statistical analysis was performed on intensity values of tissues samples. Given the histogram of muscles samples and blood samples, we computed the mean and standard devi-ation of intensity values, for muscles I(µ, σ2
) and for blood I′(µ′, σ′2). Then we
set a threshold to distinguish these two classes as
th= µσ
′+ µ′σ
σ+ σ′ . (1)
Neighbor pixels of the growing region with intensity values upper than the threshold th were assigned to the left atrium. Accordingly, spatial constraint and user-provided intensity information are combined in the algorithm.
To further negate the impact of noise in original CT images, alternating sequential filters (ASFs) were used to post-process the LA endocardium seg-mentation. This step is compulsory for CT images with low quality. Alternating sequential filters are composed of pairs of idempotent morphological filters with structuring elements of increasing sizes. They extract the geometrical character-istics and minimize the distortion of objects [12, 13]. In our experiment, we used pairs of closing and opening with structuring elements of increasing radius from 0.25 mm, 0.50 mm to 0.75 mm sequentially.
2.4 Marker-Controlled Geodesic Active Contour (MCGAC)
Geodesic active contour algorithm [14], represents contour as zero crossing of a level-set function. An initial contour propagates to touch the shape boundaries, as the level-set function progresses in time until
∂u
∂t = 0, (2)
where u is the level-set function under following conditions:
u|t=0= u0 (3a)
∂u
∂t = g(c + κ)|∇u| + ∇u∇g, (3b) where u0 is the initial level-set function; c is a constant to provide a steady
velocity; κ is related to the curvature of the level-set function as κ = div( ∇u |∇u|);
g is an edge detector function of image, which is strictly decreasing towards the outside of the region to be segmented and has values near 0 at the boundary to stop the evolution of curves.
In equation 3b, three terms affect the way that a level-set function evolves: • Advection term: gc|∇u|, related to progression speed of curves.
• Curvature term: gκ|∇u|, related to curvature of curves. • Propagation term: ∇u∇g, related to expansion of curves.
The algorithm is implemented in Insight Segmentation and Registration Toolkit (ITK), which uses three parameters (advection, curvature and propa-gation scaling, noted here as Sa, Sc and Sp) to assign weighting ratios to each
term and adjust their influence in the evolution process of the level-set function. We chose manually Sa= 10 × Sc= Sp= 5. The initial level-set function u0was
computed as a distance map of the LA endocardium segmentation. The edge detector function g was simply set to 0 on excluded regions and 1 on the rest of the image.
As for excluded regions, neighboring tissues other than muscles outside the LA wall were marked as excluded for the segmentation. Since CT images display relative linear attenuation values of tissues, and correspond to Hounsfield units (HU) scale, they may be used to characterize tissues [15]. Based on approximate HU values for air (-1000), fat (-100 to -50), muscle (10 to 50) and blood (300 to 400), we set 0 HU as upper threshold for fat (and air) and th, as defined in equation 1, as lower threshold for blood. Besides, fat granules of size smaller than 1 mm3
were regarded as inside the LA wall, thus not excluded. Margins were kept to avoid misleading markers resulting from noise or density variation. At last, all pixels further than 6 mm away from the left atrium were also excluded, according to studies of the LA wall thickness on excised hearts [2, 3].
The markers of neighboring tissues were introduced to address the fuzzy boundaries problem, as the intensity gradient between the LA wall and its neigh-boring tissues is small and noise may blur original CT images. Then we adapted geodesic active contour model based on excluding markers, because the LA wall may be attached to muscles belonging to other organs such as esophagus, aorta, lung etc., and hence cannot be segmented only based on intensity information. Geodesic active contour, on the other hand, involves curvature constraint of shape to solve this problem.
3
Results
3.1 Parameters
Parameter setting mentioned in Section 2 can be altered depending on cases, but in this study we followed the same rule for all 10 cases to test the robustness of the algorithm with respect to different inputs.
Intensity value thresholds th used during region growing process were shown in Table 1.
6 S. Jia, L. Cadour, H. Cochet, and M. Sermesant
Table 1.Intensity value thresholds used for 10 datasets tested.
Dataset #1 #2 #3 #4 #5
Threshold th 224.3 HU 419.5 HU 485.7 HU 226.6 HU 131.6 HU
Dataset #6 #7 #8 #9 #10
Threshold th 136 HU 448.2 HU 358.4 HU 345.8 HU 267.1 HU
3.2 Left Atrial Wall Segmentation
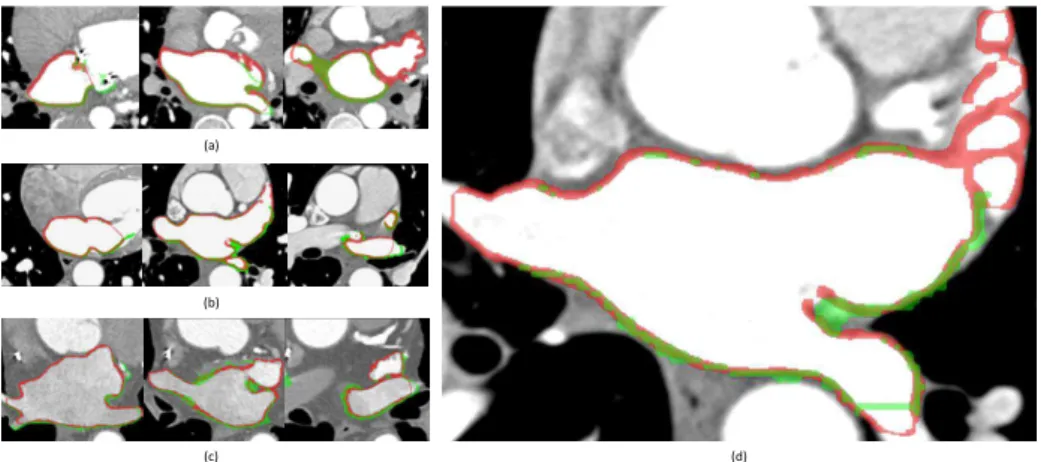
Here we present preliminary results of the LA wall segmentation, and comparison with manual segmentation, as shown in Fig. 2.
(a)
(b)
(d) (c)
Fig. 2. Axial slices of CT images, overlapped with manual segmentation of the left
atrial wall in green, our segmentation in red, intersection of the two in chartreuse. (a) Dataset #2; (b) dataset #3; (c) dataset #5; (d) example slice zoomed in.
The proposed method closely approximated the wall thickness, as compared with manual segmentation. Differences lay in the segmentation of the anterior LA wall, which is not fully involved in the manual segmentation provided. The intersecting surfaces inside pulmonary veins and on mitral valve are presented in our segmentation with rather thinner wall, which should not have been included. Remark. We segmented the LA appendage and pulmonary veins connected to the left atrium as well, which is different from the manual segmentation provided.
3.3 Wall Thickness Measurement
We computed the LA wall thickness using the nearest distance from each point on the LA endocardium to the LA epicardium. Meshes of the LA endocardium were generated using The Visualization Toolkit (VTK).
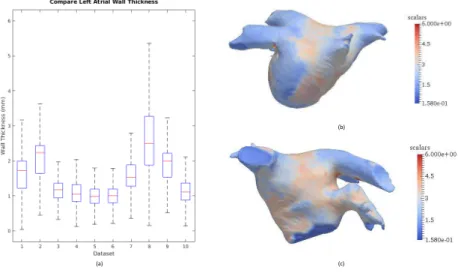
The LA wall thickness varies by subject as well as by region, as shown in Fig. 3. From the mean and range of the wall thickness, we can see that dataset #8 has a thicker LA wall compared with other datasets, whereas dataset #5 and #6 have a thinner LA wall. The results for dataset #8 are shown as an example.
(a)
(b)
(c)
Fig. 3.(a) Mean and interquartile range of the left atrial wall thickness for 10 datasets
tested, with maximum whisker length specified as 1.5 times the interquartile range; (b) left atrial wall thickness map for dataset #8, posterior view; (c) left atrial wall thickness map for dataset #8, anterior view.
Alternating sequential filters may be used to post-process the segmentation results. The LA epicardium segmentation, using marker-controlled geodesic ac-tive contour, takes into account the heterogeneity of the LA wall, and therefore can have small granules excluded. Whether or not to smooth the contour of the LA epicardium, depends on how the LA wall is defined.
4
Conclusion
We proposed a new method to segment the LA wall, making use of patient-specific intensity value information and surrounding environment of the LA wall. Despite good match of wall thickness with manual segmentation, the accuracy of the segmentation is still hard to validate as few reliable ground truths are available.
Although the study reached its aims, there exist some limitations to be men-tioned. The proposed MCGAC method, applying uniform parameters to all re-gions of the LA wall, cannot achieve a region-wise constraint on curvature, which
8 S. Jia, L. Cadour, H. Cochet, and M. Sermesant
could lead to incorrectly assigned pixels. Potential future work to improve the accuracy of the segmentation may include: further eliminating the influence of noise; region-wise segmentation of the LA wall, which takes into consideration different surrounding environments of the LA sub-regions; parameters testing. Besides, alternative methods may be suitable as well to define how to measure the wall thickness, such as using a symmetric minimum distance between the epicardium and the endocardium [16], measuring the thickness in the surface normal direction of the endocardium. Combination of different approaches may be able to ameliorate the results.
Acknowledgments. Part of the research was funded by the Agence Nationale de la Recherche (ANR)/ERA CoSysMed SysAFib and ANR MIGAT projects. The authors would like to thank Marc-Michel Roh´e and Herv´e Delingette for their constructive feedback and Inria dtk team (Nicolas Schnitzler and Thibaud Kloczko) for helping in implementing the pipeline.
References
1. Massimo Zoni-Berisso, Fabrizio Lercari, Tiziana Carazza, Stefano Domenicucci, et al. Epidemiology of atrial fibrillation: European perspective. Clin Epidemiol, 6(213):e220, 2014.
2. Siew Yen Ho, Damian Sanchez-Quintana, Jose Angel Cabrera, and Robert H An-derson. Anatomy of the left atrium: implications for radiofrequency ablation of atrial fibrillation. Journal of cardiovascular electrophysiology, 10(11):1525–1533, 1999.
3. Damian S´anchez-Quintana, Jos´e Angel Cabrera, Vicente Climent, Jer´onimo Farr´e,
Maria Cristina de Mendon¸ca, and Siew Yen Ho. Anatomic relations between the esophagus and left atrium and relevance for ablation of atrial fibrillation. Circula-tion, 112(10):1400–1405, 2005.
4. Rutger J Hassink, H Thomas Aretz, Jeremy Ruskin, and David Keane. Morphology of atrial myocardium in human pulmonary veins: a postmortem analysis in patients with and without atrial fibrillation. Journal of the American College of Cardiology, 42(6):1108–1114, 2003.
5. Catalina Tobon-Gomez, Jochen Peters, Juergen Weese, Karen Pinto, Rashed Karim, Tobias Schaeffter, Reza Razavi, and Kawal S Rhode. Left atrial segmenta-tion challenge: a unified benchmarking framework. In Internasegmenta-tional Workshop on Statistical Atlases and Computational Models of the Heart, pages 1–13. Springer, 2013.
6. Dominik Kutra, Axel Saalbach, Helko Lehmann, Alexandra Groth, Sebastian PM
Dries, Martin W Krueger, Olaf D¨ossel, and J¨urgen Weese. Automatic
multi-model-based segmentation of the left atrium in cardiac mri scans. In International Con-ference on Medical Image Computing and Computer-Assisted Intervention, pages 1–8. Springer, 2012.
7. Thomas A Dewland, Max Wintermark, Anna Vaysman, Lisa M Smith, Elizabeth Tong, Eric Vittinghoff, and Gregory M Marcus. Use of computed tomography to identify atrial fibrillation associated differences in left atrial wall thickness and density. Pacing and Clinical Electrophysiology, 36(1):55–62, 2013.
8. Jiro Inoue, John SH Baxter, and Maria Drangova. Left atrial wall segmentation from ct for radiofrequency catheter ablation planning. In Workshop on Clinical Image-Based Procedures, pages 71–78. Springer, 2015.
9. Jiro Inoue, Allan C Skanes, James A White, Martin Rajchl, and Maria Dran-gova. Patient-specific left atrial wall-thickness measurement and visualization for radiofrequency ablation. In SPIE Medical Imaging, pages 90361N–90361N. Inter-national Society for Optics and Photonics, 2014.
10. STACOM Left Atrial Wall Thickness Challenge.
11. Hubert Cochet, R´emi Dubois, Fr´ed´eric Sacher, Nicolas Derval, Maxime Sermesant, M´el`eze Hocini, Michel Montaudon, Michel Ha¨ıssaguerre, Fran¸cois Laurent, and Pierre Ja¨ıs. Cardiac arrythmias: multimodal assessment integrating body surface ecg mapping into cardiac imaging. Radiology, 271(1):239–247, 2013.
12. Serra Jean. Image Analysis and Mathematical Morphology. Academic Press, Inc., Orlando, FL, USA, 1983.
13. Soo-Chang Pei, Chin-Lun Lai, and Frank Y Shih. An efficient class of alter-nating sequential filters in morphology. Graphical Models and Image Processing, 59(2):109–116, 1997.
14. Vicent Caselles, Ron Kimmel, and Guillermo Sapiro. Geodesic active contours. International journal of computer vision, 22(1):61–79, 1997.
15. Walter Huda. Review of Radiologic Physics. Lippincott Williams and Wilkins, Philadelphia, United States, 2010.
16. Marta Varela, Christoph Kolbitsch, Adeline Theron, Ross Morgan, Markus Hen-ningsson, Tobias Schaeffter, and Oleg Aslanidi. 3d high-resolution atrial wall thick-ness maps using black-blood psir. Journal of Cardiovascular Magnetic Resonance, 17(1):1, 2015.