HAL Id: hal-00687280
https://hal.archives-ouvertes.fr/hal-00687280
Submitted on 13 Apr 2012HAL is a multi-disciplinary open access archive for the deposit and dissemination of sci-entific research documents, whether they are pub-lished or not. The documents may come from teaching and research institutions in France or abroad, or from public or private research centers.
L’archive ouverte pluridisciplinaire HAL, est destinée au dépôt et à la diffusion de documents scientifiques de niveau recherche, publiés ou non, émanant des établissements d’enseignement et de recherche français ou étrangers, des laboratoires publics ou privés.
Women’s relative position and the division of household
work: A study of French couples
Catherine Sofer, Sayyid Salman Rizavi
To cite this version:
Catherine Sofer, Sayyid Salman Rizavi. Women’s relative position and the division of household work: A study of French couples. European Journal of Social Systems, 2009, 22 (2), pp.13-26. �hal-00687280�
Women‟s relative position and the division of
household work: A study of French couples
Catherine Sofer*
Sayyid Salman Rizavi**
A version submitted to
European Journal of Economic and Social Systems
________________________
* University of Paris 1- Pantheon-Sorbonne and Paris School of Economics ** University of Paris 1- Pantheon-Sorbonne
1. Introduction
The modeling of the decision-making of the family is one of the fields in which the economic theory brought new and interesting elements in the recent years. New windows of empirical applications have been opened that provide new and increasingly realistic results enabling us to apprehend the processes of household decision making. With the availability of increasing number of time use and household surveys in different countries, we are able now to make international comparisons of household division of work leading to development of new models related to household decision making.
The participation rate of women in the labour market which was low in most of the countries at the beginning of the 20th century (Marchand & Thélot, 1991, Thévenon, 2008) has been observed to strongly increase during the second half of the century. Besides this massive participation of women in the labour market in most of the developed countries, the sharing of time among men and women between market work and household work is still highly gender specific (Goldschmidt-Clermont and Pagnossin-Aligisakis,1995, Rizavi and Sofer, 2008). A report of the European Commission (Winqvist, 2004) shows that European women share roughly about 60 to 70% of household work and the rest, 30 and 40% is shared by men. About the division between market work and household work, European women, in these countries, spend roughly between 60 and 70% of their working time doing household work and between 30 and 40% working in the market, while men devote between 55% and 65% of their working time to market work and thus between 35% and 45% only to household work, with a total working time nearly always higher for women than for men. Though it may be thought that observed individual characteristics of men and women, such as wages, might explain, at least partly, that women invest less than their partner in the labour market and more in the family (Becker, 1981), the gender division of labour still is an unsolved issue for economists. Studies show that education, wages or other measurable variables have a very small impact, if any, upon the sharing of household work (Hersch and Stratton, 1994, Anxo & Carlin, 2004, Aronsson et al, 2001, Rapoport and Sofer, 2005).
When the division of the labour in the market and within the household is analyzed, the choice to work in the market or household also should be taken into consideration. These choices are the central part of gender studies and are at the heart of the equality between men and women. Economic models, at least those which integrate the household production (Becker, 1981, Gronau, 1977, Kooreman and Kapteyn, 1987, Apps and Rees, 1997, Chiappori, 1997) provide predictions about the sharing of work (either market or household
work) which are far from being totally met in the real world, especially when considering household work.
In this paper, we first show, using existing international comparisons (Winqvist, 2004), that
some regularities can be found in the sharing of total work between men and women. We then try to find which, if any, economic variables can explain the sharing of household work. To do this, we look at those couples where the relative economic position of women is better than average, using a battery of criteria. The aim is at highlighting the variables that most likely influence the division of labour within the household (Rapoport and Sofer, 2005, Rizavi, 2006, Sofer, 1999). We use French data from the INSEE (Survey “Emploi du Temps”), which gives information on the allocation of time for both partners in couples and simultaneously estimate the household work of both partners looking at the influence of a good relative position of the wife as defined along several criteria.
What we find is that women who are in a better economic position, especially relative to their partner do less household work and, conversely, that their partners do more1. But there is no reversal: women always do more household than their husband, whatever their relative position in the labour market.
We first present in section 2 some stylized facts about the division of work within the household and in the market in Europe. In the next section, we survey briefly different economic approaches to household decision making. Section 4 is devoted to the presentation of the data we use. The results of th estimations are given in section 5. Section 6 concludes.
2. A few stylized facts
2.1 Labour force Participation
The remarkable increase in the labour force participation of women in Europe during the twentieth century is reshaping, although not very speedily, not only the gender division of labour within the household but the gender division of total work (including both paid and unpaid work) as a whole. Thévenon (2008) shows that the female employment continues to increase even beyond the 1990s. In the earlier 15 members of the European Union, we can observe a very sharp increase during that period in case of women (7.7%) as compared to men (0.4%). The data presented by Thévenon (2008) that was taken from the European Union
1
This is an opposite result to what is found for the U.S (see Bittman et al, 2001), where high paid women tend to do more household, not less.
Labour force surveys also shows that the gap between men‟s and women‟s labour force participation has narrowed considerably.
2.2 The gender division of household work
Table 1 below shows how much men and women share the household work in the countries under consideration, and shows the total time spent in household work by men and women aged 20 to 74. It seems that the sharing of household work between men and women is remarkably stable among the different countries of Europe. European women, in these countries share about 60 % to 66 percent of household work. Sweden and the Nordic countries (Norway and Finland) are the most egalitarian with a sixty-forty sharing. Conversely, France is the country where inequality is the highest (with men doing only 34% of all domestic work, but note that more southern European countries, like Italy or Greece, are not included here).
Table 1: Household work of persons aged 20 to 74 in 10 EU countries
BE DE EE FR HU SI FI SE UK NO
Hours and minutes per day
Women 4:32 4:11 5:02 4:30 4:57 4:57 3:58 3:42 4:15 3:47
Men 2:38 2:21 2:48 2:21 2:39 2:39 2:16 2:29 2:18 2:22
Both 7:10 6:32 7:50 6:51 7: 36 7:36 6:14 6:11 6:33 6:09
Share of total time spent by women and by men %
Women
63 64 64 66 65 65 64 60 65 62
Men
37 36 36 34 35 35 36 40 35 38
Source: Winqvist, 2004 (Tables 1.1 & 1.2)
We cannot ignore the fact either that this unequal sharing also corresponds to a strong specialization among domestic tasks, with women rather specialized in laundry and cooking, for example, and men rather in repairs. Only a few tasks, like shopping and gardening, are shared quite equally according to the same report. Also we can note the differences between countries in the total number of hours spent on domestic tasks, with much more time spent in eastern countries (Estonia, Slovenia and Hungary) than in Nordic Countries where it is the lowest.
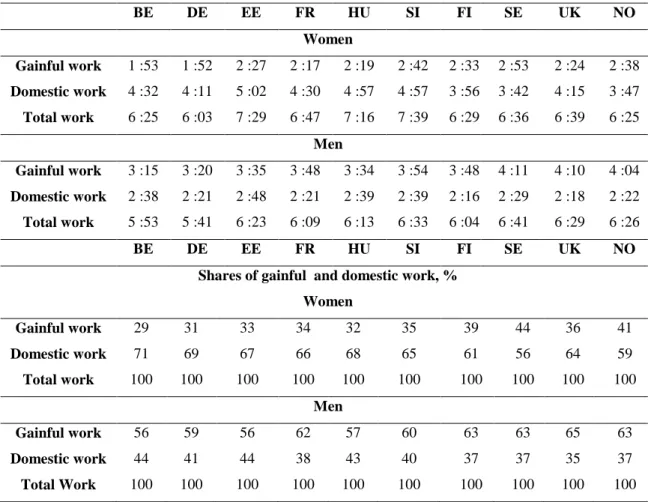
Table 2 shows that women work more hours than men at home, conversely men work longer hours in the market, often even twice more than women, as in Belgium, in Germany, or in the U.K. However, almost everywhere, women spend more time than men in total work: more than one extra hour per day on average in eastern countries (Slovenia, Estonia and Hungary), nearly 45 minutes more in France. Here, we define „total work‟ as the sum of gainful work and household work. Another observation may be that the countries where this difference is less are the ones where the time spent by women on household work is considerably less. The least time spent by women in household is in Sweden. This possibly may be due to greater use of household equipment, a phenomenon that may be checked with the available data. Only very few countries show a more equal division of labour: Norway with a difference between men and women of 1 minute, Sweden, which is the only country in the list (and probably the only one in the world) where men work –slightly- more than women. It can also be noted that domestic work represents between 56 % and slightly more than 70 % of women‟s total work while the corresponding figures for men are 35 % to 45 % of total work spent at domestic work.
Table 2: Gainful and domestic work of persons aged 20 to 74 (Hours & minutes per day)
BE DE EE FR HU SI FI SE UK NO Women Gainful work 1 :53 1 :52 2 :27 2 :17 2 :19 2 :42 2 :33 2 :53 2 :24 2 :38 Domestic work 4 :32 4 :11 5 :02 4 :30 4 :57 4 :57 3 :56 3 :42 4 :15 3 :47 Total work 6 :25 6 :03 7 :29 6 :47 7 :16 7 :39 6 :29 6 :36 6 :39 6 :25 Men Gainful work 3 :15 3 :20 3 :35 3 :48 3 :34 3 :54 3 :48 4 :11 4 :10 4 :04 Domestic work 2 :38 2 :21 2 :48 2 :21 2 :39 2 :39 2 :16 2 :29 2 :18 2 :22 Total work 5 :53 5 :41 6 :23 6 :09 6 :13 6 :33 6 :04 6 :41 6 :29 6 :26 BE DE EE FR HU SI FI SE UK NO
Shares of gainful and domestic work, % Women Gainful work 29 31 33 34 32 35 39 44 36 41 Domestic work 71 69 67 66 68 65 61 56 64 59 Total work 100 100 100 100 100 100 100 100 100 100 Men Gainful work 56 59 56 62 57 60 63 63 65 63 Domestic work 44 41 44 38 43 40 37 37 35 37 Total Work 100 100 100 100 100 100 100 100 100 100
Note : Gainful work includes hours worked in first and second jobs, overtime, work brought home, training during working hours and business trips. Working hours do not include lunch breaks and daily travel to and from work. Domestic work includes work done for own household. Source : Winqvist, 2004, tables 1.1 & 1. 2
It is clear that in spite of the now massive participation of women in the labour market, the gender division of labour, though it generally does not imply anymore a complete specialization still remains highly differentiated by gender. Is it only a result obtained on average, possibly due to average differences in women‟s and men‟s wages, for example? Or are usual economic variables of little help in explaining this phenomenon?.
3. Some theoretical considerations
The earlier unitary model of household (Becker, 1965), based on assumptions like income pooling and that the income from all sources is also pooled, had some inherent weaknesses. Families were treated like single decision-making units (Becker, 1981). The maximization of a common utility function is constrained by considering a total family income that is a sum of incomes from all sources. The division of the labour and the distribution of consumption between partners (as well as the consumption of the children) which results from the maximization of the so called household utility function should thus depend only on the value of this total income, and not of who is the provider of income of any type. In other words, the transfer of non-labour income of a spouse to the other (for example of the family benefits) should have no effect on the equilibrium of the household. However this result was empirically refuted in a nearly all the tests run. (Thomas, 1990, Schultz, 1990, Fortin and Lacroix, 1997, Lundberg, Pollak and Wales, 1997, inter alia). In Becker‟s analysis, the sharing of work in household production is driven only by efficiency, i.e. by cost and productivity considerations. This is also true in more recent and realistic models, which acknowledge the fact that the household is composed of individuals with different tastes and preferences. Cooperative models (Manser and Brown, 1980, Horney and Mc Elroy, 1981, Mc Elroy, 1990) and collective models of the household (Chiappori, 1988, 1992,) take into account that several decision makers exist, or even compete within the household, and that a process of negotiation takes place. A few of these models only include household work and draw predictions about its sharing (see Apps and Rees, 1997, Chiappori, 1997, Aronsson et al, 2001, Rapoport, Sofer, Solaz, 2009). All of them are based upon the efficiency of household production again (like in Becker), which implies that if two partners have the same productivity in household production, the one who has the lowest production costs (the lower
hourly wage) should devote more time to household production than his/her partner. As we shall see, our results challenge either the equal productivity or the efficiency assumption.
4. The Data
The latest available time use survey in France is the French Time-Use survey (Enquête Emplois du temps) conducted by INSEE in 1998-99. It aims at measuring daily activities as precisely as possible. It was conducted throughout the year in successive stages to avoid seasonal effects. On the day of the interview, the respondents wrote down their activities, indicating the time spent on each activity where time was divided in 10-minute periods. As several activities may be performed at the same time, the survey allowed two activities to be listed, one being considered as the main activity and the other as secondary. All household members above 15 were surveyed.
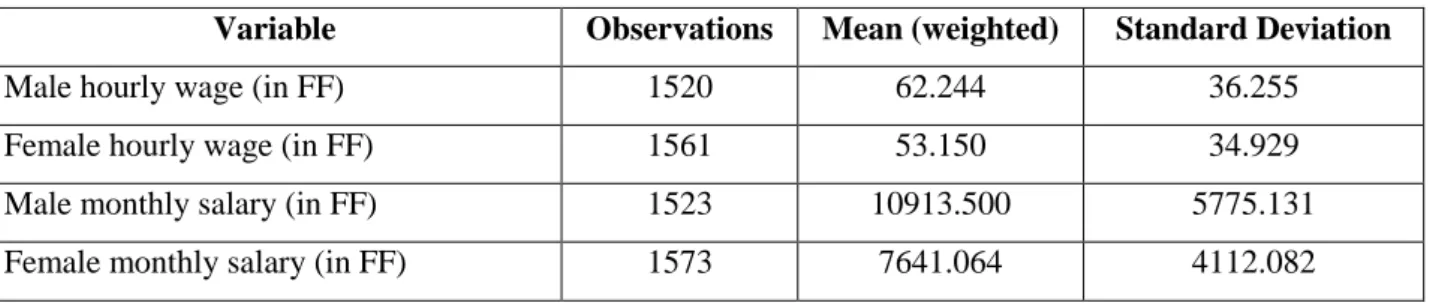
The survey includes a base of 8,186 households, of which 7,460 are complete. This gives 20,370 individuals, among whom 16,442 are at least 15-year old. The activities contain one observation per completed booklet line, with 316,097 observations where 144 different types of activities are listed regrouped by INSEE on the basis of activities being of the same type. For the purpose of this study, we use a reduced sample of couples (married or cohabitants) where both of them work in the labour market. Couples with and without children are included. Table 3 below gives a brief statistical description of the reduced sample of couples where both partners participate in the labour market activities.
It shows that, within our sample, both the hourly wage and monthly salary averages are greater for men as compared to women. This also holds true in case of the average minutes spent per day in the labour market. On the other hand, the average time spent in the household work by women in the sample is greater than that of men by 100 minutes per day. At least one fourth of the women and men in the sample have an education of Bac+2 and greater.
.
Table 3: Description of the sample of 1737 couples (French time use survey 1998)
Variable Observations Mean (weighted) Standard Deviation
Male hourly wage (in FF) 1520 62.244 36.255
Female hourly wage (in FF) 1561 53.150 34.929
Male monthly salary (in FF) 1523 10913.500 5775.131
Employment in labour market in
minutes per day (men) 1737 293.546 248.478
Employment in labour market in
minutes per day (women) 1737 237.665 227.451
Time spent in household work in
minutes per day (men) 1737 158.655 142.826
Time spent in household work in
minutes per day (women) 1737 259.282 157.652
Number of children up to 3 years of age 1737 0.128 0.351
Number of children from to 3 to 15
years of age 1737 1.209 1.068
Age of husband 1737 41.343 8.983
Age of wife 1737 39.239 8.777
Percentage according to different dummy variables
Education Women Men
Without diploma/CEP/DFEO 17.16 18.6
BEPC,CAP,BEP 38.23 43.75
BAC (general and technical) 15.83 12.61
Bac+2 and Greater 28.79 25.04
5. Empirical Results
5.1 Methodology
First, we try to identify the women whose relative position is better then her life partner or other women in her employment position. In relation to the partner, the survey we used provides data on individual monthly salaries, individual education levels and different levels
of individual occupational status. As far as women‟s relative position with respect to her partner is concerned, we create three dummy variables indicating (taking a value of 1) if a woman‟s monthly salary is greater than that of her partner, or if her diploma his higher than her partner‟s, or if her occupational position is higher than her partner‟s . The reason behind using the monthly salary here is simple. In fact, it may be the bargaining power of the woman that may affect the division of work within the household and that may not depend on the hourly wages as many women may work for fewer hours as compared to their partner and hence earn less. The details for the educational levels considered and for the ranking of occupational status are given in Appendix.
Another indicator, high wage/position, is not in relation to a women‟s partner but with reference to her type of employment status. It is based on the same occupational status indicator mentioned above. We believe that a women that exhibits a greater tendency to work in the market, that we may call career oriented, may be earning a higher hourly wage as compared to other women in her subgroup of occupational status. We create a dummy indicating if a woman earns an hourly wage more than the average plus standard deviations of women of her subgroup with respect to her occupational status. We can call it a „Wage / Position‟ variables. This indicates that a woman is earning very high wage as compared to most of the women working in the same type of employment.
Using these variables, we first show below summary statistics.
In a second stage, we run an econometric estimation with the same sub-sample, using 2SLS to simultaneously estimate two equations with the household work of both partners as dependent variables. This is because the household work decisions of the partners in a couple are made simultaneously and are interdependent. As this is clearly an endogenous variable, we do not introduce market time of any partner among the independent variables.
5.2 Results
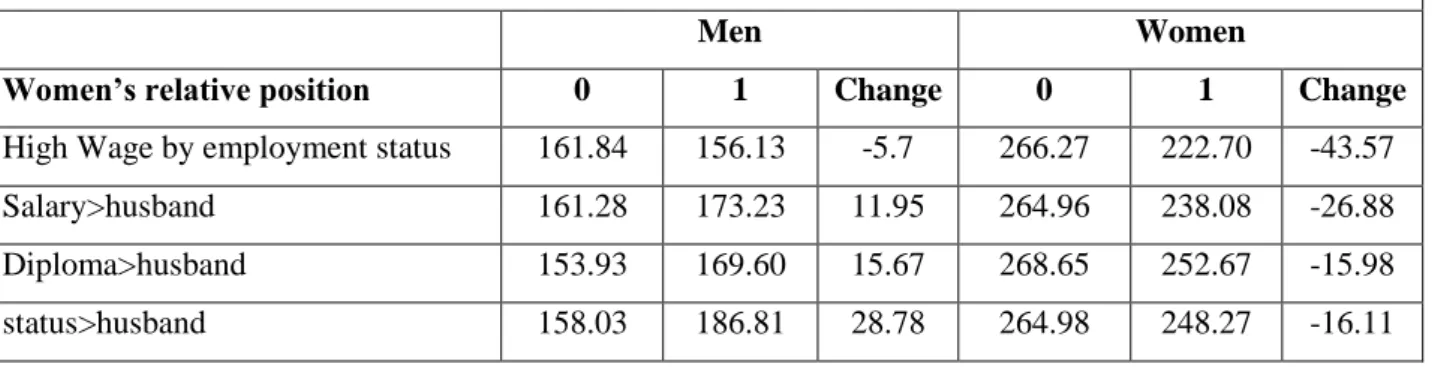
In Table 4 below , we show for the different indicators or value of dummy variables mentioned above the amount of household work spent by both partners in each case.
It can be seen that, on the average, when women‟s relative position is better than her partner‟s in terms of salary, education or her position in employment then she reduces the household work and the partner increases the household work.. An exception is in the case where we do not measure women‟s relative position to her husband but see where she stands relative to other women in her employment position. Here, too, she decreases her household work but the average household work of men does not increase in this case.
Table 4 Household work (minutes per day) according to indicators of relative position of women
Men Women
Women‟s relative position 0 1 Change 0 1 Change
High Wage by employment status 161.84 156.13 -5.7 266.27 222.70 -43.57
Salary>husband 161.28 173.23 11.95 264.96 238.08 -26.88
Diploma>husband 153.93 169.60 15.67 268.65 252.67 -15.98
status>husband 158.03 186.81 28.78 264.98 248.27 -16.11
,
The results of the estimations of men‟s and women‟s household work are shown in Table 5 below. Four models have been estimated, each of them including one of the four dummy variables defined above. In the fifth model, all the variables have been introduced in the equations The dummy variables defined above are significant most of the time (but not in all cases), in models 1 to 4 and have the expected sign: women‟s relative position seems to be very important. In three out of four cases men significantly increase their household work. It may be noticed that these three significant cases are the ones where the women‟s relative position is compared with her partner. In model 5, when introduced together, they are not significant any more, very likely because they are highly correlated. The case where we find insignificant result is where we compare women to other women in her employment status. But this is true only in the man‟s household work equation. The coefficient of this indicator becomes significant in the women‟s household work where she reduces her household work by 33 minutes if she is one of the high earners in her sub-group of employment position. Looking at the women‟s equation, though the impact of the dummies is, as expected, always negative, we find a significant decrease only in the case just mentioned when she has a higher status relative to other women (in models 4 and 5), but also when she has a higher wage as compared with her partner (again, because of the correlation between variables, this variable is significant only in model 1).
Notice that, if we look at the statistical description, we can observe that the average difference in men‟s and women‟s household work is at least 100 minutes per day. It is clear from the results that we can expect a narrowing gap in the household work of men and women when the women is more educated or earns more than her partner but we do not observe a role reversal because the decrease in this difference is much less than the average difference.
Table 5: 2SLS Simultaneous estimations of household work of men and women
Equation 1 - Dependent Variable : Household Work of Men
1 2 3 4 5 Children < 3 42.65 * 37.27 * 39.21 * 42.39 * 44.41* Children 3-15 12.29 * 9.85 * 10.92 * 12.52 * 12.84* Rural 19.11 ** 18.23 ** 18.49 ** 19.52 ** 17.77** Age (Man) 1.11 ** 0.74 *** 0.71 *** 0.82 ** 1.01** Less than
„BEPC/CAP/BEP‟ reference reference reference reference reference
BEPC,CAP,BEP (Man) 19.12 *** 21.17 ** 11.98 17.84 ** 20.02***
BAC (Gen & Technical) -
(Man) 23.21 *** 21.69 *** 10.15 19.92 19.87
Bac+2 and Greater -
(Man) -1.43 6.98 -8.14 -2.60 2.4 Week Day -68.05 * -66.58 * -70.78 * -66.51 * -70.66* Salary>partner 15.51 *** 6.35 Diploma>partner 18.75 ** 11.01 Position>partner 29.97 * 21.72 High wage/position 3.12 6.15 Constant 125.34 * 132.16 * 149.17 * 136.95 * 124.57*
Equation 2 - Dependent Variable : Household Work of Women
1 2 3 4 5 Children < 3 121.51 * 115.02 * 112.72 * 120.98 * 122.57* Children 3-15 27.44 * 25.15 * 24.79 * 25.25 * 26.91* Rural 8.14 13.65 *** 9.29 7.66 6.33 Age (Woman) 1.17 ** 1.26 * 1.31 * 1.56 * 1.46* Less than
„BEPC/CAP/BEP‟ reference reference reference reference reference
BEPC,CAP,BEP
(Woman) -29.44 ** -21.21 ** -23.50 ** -21.61 *** -26.25**
BAC (Gen & Technical)
(Woman) -35.94 ** -31.28 ** -31.23 ** -27.32 ** -32.05**
Bac+2 and Greater
(Woman) -45.94 * -49.13 * -51.42 * -42.19 * -43.46* Week Day -61.72 * -57.75 * -60.25 * -57.37 * -60.66* Salary>partner -17.09 *** -13.33 Diploma>partner -2.16 4.43 Position>partner - 0.34 -2.29 High wage/position -33.66 * -31.58** Constant 237.17 * 229.49 * 232.62 * 217.80 * 226.22* Observations 1447 1737 1640 1573 1429
*significant at 1%, **significant at 5%, ***significant at 10%
A few other variables are observed exerting an effect upon household work. Children, of course, play an important role in the household work distribution. Both men and women tend
to increase their household work when they have children, particularly with children less than three years old. The increase in household work of women is much larger and significant in all cases, where the women put another 110 to 120 minutes into household work. Educational levels have different effect. Men tend to work a little bit more in the household with higher educational levels which is significant in some cases. On the other hand, women tend to reduce their household work with higher educational levels which may be due to increased participation in the labour market. As expected, both men and women work less, within the household, during the weekdays than during the week-ends. Finally, both men and women tend to work more in the household if they belong to a rural area. This result is significant in almost all cases for men and in most of the cases for women.
6. Conclusion
Besides the increased labour market participation of women, the household work sharing still remains highly gender specific. The present paper used the French Time Use Survey, where we considered the couples who are both working in the Labour market. We focused on household work of men and women and tried to see what happens when women are the bread-winners or are more educated or, presumably, more productive than their partner in the labour market. The presence of children and educational levels seem to be important in the household division of Labour. More educated men seem to work a little bit more in the household. On the other hand, highly educated women tend to work a little less within the household but clearly the decrease in household work corresponds to much larger increase in the labour market participation, increasing the total work load of women. Rural couples seem to work more than urban couples within the household.
We especially focused on women‟s relative position in the labour market. We show that this factor is important in determining the sharing of household work. Women‟s better relative situation in the labour market relative to his increases her partner‟s household work, and tend to decrease hers. She still works more at home than he does, though, whatever her situation compared to his, but. the gap in household work of women and men tends to narrow down significantly in this case . This results challenges the usual economic assumption of efficiency in household production. Our results show that policies aiming at improving the women‟s situation on the labour market, hence in many cases the women‟s relative position with reference to their partner may produce also a more egalitarian division of household work. But they also show that direct incentives towards an equal sharing of household tasks is
probably needed if one wishes to promote an equal division of work between men and women.
Bibliography
1. Anxo, D. and Carlin P.. (2004) ,“Intra-family time allocation to housework - French evidence.” , Electronic International Journal of Time Use Research. Vol. 1, No 1, I-IV. Page 14 – 36.
2. Apps, Patricia F., and Rees, Ray. (1997) "Collective Labour Supply and Household Production", Journal of Political Economy, 105: 178-190.
3. Aronsson, T.; Daunfeldt, S-O.; and Wikström, M. "Estimating intra-household allocation in a collective model with household production", Journal of Population
Economics,14 no.4 (December 2001): 569-584.
4. Becker, Gary S.,(1965) “A Theory of the Allocation of Time”, The Economic Journal, Vol. 75, No. 299. (Sep., 1965), pp. 493-517.
5. Becker, Gary S., (1981) A Treatise on the Family , Cambridge, Mass. : Harvard University Press
6. Bergstrom, T. "A survey of Theories of the Family", Handbook of Population and Family Economics, Amsterdam:North-Holland
7. Bittman, M., England, P., Folbre, N. and Matheson, G., (2001). "When Gender Trumps Money: Bargaining and Time in Household Work," JCPR Working Papers 221, Northwestern University/University of Chicago Joint Center for Poverty Research.
8. Chiappori, Pierre-Andre, 1992. "Collective Labor Supply and Welfare," Journal of Political Economy, University of Chicago Press, vol. 100(3), pages 437-67, June 9. Chiappori, Pierre-Andre, 1988. "Rational Household Labor Supply," Econometrica,
Econometric Society, vol. 56(1), pages 63-90, January
10. Chiappori, P.A., 1992. "Collective" Models of Houshold Behavior: The Sharing Rule Approach," DELTA Working Papers 92-02, DELTA (Ecole normale supérieure). 11. Clark, A., Couprie, H. & Sofer, C. (2004) « La modélisation collective de l‟offre de
travail : mise en perspective et application aux données britanniques » Revue Economique vol 55 n° 4 pp767-789.
12. Cudeville, E. & Recoules, M., "Conjugal Contract, Gender Wage Discrimination and Social Norms", Preliminary version presented at 'Seminar in Gender Economics', MSE, University of Paris 1, October 6, 2008
13. Donni Olivier., 2008, "Household behavior and family economics", In: W.-B. Zhang (ed.), Mathematical Models in Economics, in The Encyclopaedia of Life Support
System (EOLSS), Developed under the Auspices of the UNESCO, Eolss Publishers, Oxford,UK, [http://www.eolss.net].
14. Enquête Emplois du temps, INSEE, France, 1998-99
15. Goldschmidt-Clermont L, Pagnossin-Aligisakis E, 1995. “Measures of Unrecorded Economic Activities in Fourteen Countries”, Background paper for Human Development Report 1995.United Nations Development Programme, Human Development Report Office, New York.
16. Gronau R. 1977 “Leisure, Home Production and Work” -- The Theory of the Allocation of Time Revisited », Journal of Political Economy, 85:6, December.
17. Hersch, Joni & Stratton, Leslie S, 1994. "Housework, Wages, and the Division of Housework Time for Employed Spouses," American Economic Review, American Economic Association, vol. 84(2), pages 120-25, May
18. Horney, M., and Mc Elroy, M. B.(1981) "Nash Bargained Household Decisions: Towards a Generalization of the Theory of Demand", International Economic Review, 22 (June): 333-349.
19. Kooreman, P., and Kapteyn, A (1987). "A Disaggregated Analysis of the Allocation of Time Within the Household”, Journal of Political Economy,95, 2 (April): 223-249. 20. Lundberg S., R.A. Pollak and T.J. Wales (1997), « Do Husbands and Wive Pool their
resources ? Evidence from U.K. Child Benefit », Journal of Human Resources, 22, 463-480
21. Manser, M., and Brown, M. (1980) "Marriage and Household Decision Making: A Bargaining Analysis", International Economic Review, 21 (February): 31-44.
22. McElroy, Marjorie B.(1990) "The Empirical Content of Nash-bargaining Household Behavior", Journal of Human Resources, 25 (Fall): 559-583.
23. Marchand O. et C. Thelot. 1991. Deux Siècles de travail en France, 1800-2000. Paris: Nathan, 1997. ISBN: 209190435X.
24. Rapoport, B. et Sofer C. (2005) « Facteurs de production "purs" et règle de partage : estimation d‟un modèle collectif avec production domestique », Mimeo, Université Paris1-Panthéon-Sorbonne.
25. Rapoport B., Sofer C. et Solaz A. (2009). «Household Production in a Collective Model: Some New Results » Journal of Population Economics (forthcoming)
26. izavi, Salman, Sayyid (2006) Estimation de Modèle Collectif avec Production Domestique: Comparaison Internationale, Mémoire de Master de l‟université Paris1-Panthéon-Sorbonne.
27. Schultz T.P. (1990), « Testing the Neoclassical Model of Family Labour Supply and Fertility », Journal of Human resources, 25, 599-634
28. Sofer C (1999), « Modélisations économiques de la prise de décision dans la famille », annexe dans L‟égalité économique entre hommes et femmes, édité par B. d‟Intignano, rapport CAE, La Documentation Française.
29. Thévenon, Olivier, 2008, "Labour force participation of women with children: disparities and developments in Europe since the 1990s, Document de travail, 2008-01, Economix, [http://economix.u-paris10.fr/]
30. Thomas D. (1990), « Intra-Household Resource Allocation: An Inferential Approach », Journal of Human Resources, 25, 635-664.
31. Winqvist, Karin (2004) How Europeans spend their time. Everyday life of women and men, Rapport de la Commission Européenne, Edition Pocketbooks Luxembourg.
Appendix
Education: We create four different levels of education based on the data provided by the survey; less than „BEPC/CAP/BEP‟, „BEPC/CAP/BEP‟, „BAC (Gen & Technical)‟ and „Bac+2 and Greater‟.
Professional position: The survey provides 9 different levels of occupational status as described in the following table. The professional position does not include independently working people so we created a separate category for them.
Category number in the survey Professional position Mapped to variable “status” which we use 0
Miscellaneous cases (other than 1 to 9) (only 1.4% in all survey)
1
1 Manoeuvre ou ouvrier spécialise (OS1, OS2, OS3 etc.) 1
2
Ouvrier qualifié ou hautement qualifié (P1, P2, P3, TA, OQ etc.)
1
3
Agent de maîtrise dirigeant des ouvriers, maîtrise administrative ou commerciale
2
4
Agent de maîtrise dirigeant des techniciens ou d‟autre agents de maîtrise
3
5 Technicien, dessinateur, VRP (non cadre) 4
6
Instituteur, assistant(e) social(e), infirmier(e) , et personnel de la catégorie B de la fonction publique
4
7 Ingénieur ou cadre 5
8
Professeur et personnel de la catégorie A de la fonction
publique 5
9
Employé de bureau, employé de commerce, agent de service, aide soignant(e), gardienne d‟enfants, personnel de la catégorie C ou D de la fonction publique
1