HAL Id: inserm-02962684
https://www.hal.inserm.fr/inserm-02962684
Submitted on 9 Oct 2020
HAL is a multi-disciplinary open access
archive for the deposit and dissemination of
sci-entific research documents, whether they are
pub-lished or not. The documents may come from
teaching and research institutions in France or
abroad, or from public or private research centers.
L’archive ouverte pluridisciplinaire HAL, est
destinée au dépôt et à la diffusion de documents
scientifiques de niveau recherche, publiés ou non,
émanant des établissements d’enseignement et de
recherche français ou étrangers, des laboratoires
publics ou privés.
biomechanical forces is mediated by MMP13
Patricia Pitrez, Luís Estronca, Luís Miguel Monteiro, Guillem Colell, Helena
Vazão, Deolinda Santinha, Karim Harhouri, Daniel Thornton, Claire Navarro,
Anne-Laure Egesipe, et al.
To cite this version:
Patricia Pitrez, Luís Estronca, Luís Miguel Monteiro, Guillem Colell, Helena Vazão, et al..
Vulner-ability of progeroid smooth muscle cells to biomechanical forces is mediated by MMP13. Nature
Communications, Nature Publishing Group, 2020, 11 (1), pp.4110. �10.1038/s41467-020-17901-2�.
�inserm-02962684�
Vulnerability of progeroid smooth muscle cells to
biomechanical forces is mediated by MMP13
Patricia R. Pitrez
1,2
, Luís Estronca
1,2
, Luís Miguel Monteiro
1
, Guillem Colell
3
, Helena Vazão
1
,
Deolinda Santinha
1,2
, Karim Harhouri
4
, Daniel Thornton
5
, Claire Navarro
4,6
, Anne-Laure Egesipe
7
,
Tânia Carvalho
8
, Rodrigo L. Dos Santos
9
, Nicolas Lévy
4,10
, James C. Smith
11
, João Pedro de Magalhães
1,5
,
Alessandro Ori
12
, Andreia Bernardo
11
, Annachiara De Sandre-Giovannoli
4,10,13
, Xavier Nissan
7
,
Anna Rosell
3
& Lino Ferreira
1,2
✉
Hutchinson-Gilford Progeria Syndrome (HGPS) is a premature aging disease in children that
leads to early death. Smooth muscle cells (SMCs) are the most affected cells in HGPS
individuals, although the reason for such vulnerability remains poorly understood. In this
work, we develop a micro
fluidic chip formed by HGPS-SMCs generated from induced
plur-ipotent stem cells (iPSCs), to study their vulnerability to
flow shear stress. HGPS-iPSC SMCs
cultured under arterial
flow conditions detach from the chip after a few days of culture; this
process is mediated by the upregulation of metalloprotease 13 (MMP13). Importantly,
double-mutant Lmna
G609G/G609GMmp13
−/−mice or Lmna
G609G/G609GMmp13
+/+mice
trea-ted with a MMP inhibitor show lower SMC loss in the aortic arch than controls. MMP13
upregulation appears to be mediated, at least in part, by the upregulation of glycocalyx. Our
HGPS-SMCs chip represents a platform for developing treatments for HGPS individuals that
may complement previous pre-clinical and clinical treatments.
https://doi.org/10.1038/s41467-020-17901-2
OPEN
1Center for Neuroscience and Cell Biology, University of Coimbra, Coimbra, Portugal.2Faculty of Medicine, University of Coimbra, Coimbra, Portugal. 3Neurovascular Research Laboratory, Vall d’Hebron Research Institute, Universitat Autònoma de Barcelona, Passeig Vall d’Hebron 119-129, 08035
Barcelona, Spain.4Aix Marseille Univ, INSERM, MMG, Marseille, France.5Integrative Genomics of Ageing Group, Institute of Ageing and Chronic Disease, University of Liverpool, Liverpool L7 8TX, UK.6Progelife, Marseille, France.7CECS, I-STEM, AFM, Institute for Stem Cell Therapy and Exploration of Monogenic Diseases, Evry Cedex, France.8IMM, Instituto de Medicina Molecular, Universidade de Lisboa, Lisbon, Portugal.925 Cambridge Science Park,
Mogrify Ltd, Milton Road, Cambridge CB4 0FW, UK.10Molecular Genetics Laboratory, Department of Medical Genetics, La Timone Children’s Hospital,
Marseille, France.11Developmental Biology Laboratory, Francis Crick Institute, London NW1 1AT, UK.12Leibniz Institute on Aging - Fritz Lipmann Institute,
07745 Jena, Germany.13CRB Assistance Publique des Hôpitaux de Marseille (CRB AP-HM, TAC), Marseille, France. ✉email:lino@uc-biotech.pt
123456789
H
utchinson–Gilford Progeria Syndrome (HGPS) is caused
by a single mutation in the lamin A/C gene (LMNA),
resulting in the generation of an abnormal lamin A
pre-cursor named progerin
1,2. One of the key reasons of premature
death is the loss of smooth muscle cells (SMCs) in the medial
layer of large arteries, followed by the appearance of collagen and
extracellular matrix (ECM) and the development of a severe
arteriosclerotic process that leads to increased arterial stiffness
3–5.
The reasons of SMC loss remain to be determined. It has been
suggested that this may happen due to pathophysiological
changes inherent to prelamin A/progerin accumulation, such as
the acceleration of vascular calcification via the activation of the
DNA damage response and senescence-associated secretory
phenotypes in vascular SMCs
6or the downregulation of PARP1
7.
It has also been shown that the combined effect of progerin
accumulation and mechanical stress in mouse SMCs
over-expressing progerin promoted cell detachment and death, while
the disruption of the linker between nucleoskeleton and
cytos-keleton complex ameliorated the toxic effects of progerin
8.
Nei-ther of these studies have fully addressed the reasons behind SMC
detachment and thus which therapeutic approach could be
effective to prevent SMC loss.
Induced pluripotent stem cells (iPSCs) offer an unlimited
source of SMCs to study HGPS. Recent studies have generated
iPSCs from
fibroblasts obtained from individuals with HGPS
(hereafter referred to as HGPS-iPSCs)
9–11. Strikingly,
HGPS-iPSCs show low lamin A/C and progerin protein expression in the
pluripotent state. However, the expression of progerin is
reacti-vated after HGPS-iPSC differentiation into SMCs
7,9. The
differ-entiated cells show nuclear dysmorphology, cell growth
retardation, susceptibility to apoptosis, proliferation reduction,
and DNA-repair defects; however, SMC performance under
flow
conditions has not been evaluated.
In this work, we develop an in vitro cell system comprising
SMCs derived from HGPS-iPSCs cultured under
flow conditions
in a microfluidic device. We identify MMP13 as a mediator of
SMC detachment using chemical and genetic assays. The
gener-ated double-mutant Lmna
G609G/G609GMmp13
−/−mice show an
increase in SMCs in the aortic arch and a decrease in
progerin-positive cells. In addition, the inhibition of MMP13 in
Lmna
G609G/G609Gmice by Batimastat, a drug that has been
pre-viously tested in clinical trials in cancer patients, reduces SMC
loss. The results present here open perspectives for HGPS
treatment.
Results
SMCs derived from HGPS-iPSCs are functional and share
similar features to progerin-expressing cells. iPSCs were
gen-erated from HGPS skin
fibroblasts and characterized as
pre-viously described
10. iPSCs generated from non-disease cells
(N-iPSCs), HGPS skin
fibroblasts, and non-disease somatic human
vascular smooth muscle cells (hVSMCs) were used as controls.
The mutation in the LMNA gene, both in HGPS skin
fibroblasts
and HGPS-iPSCs, was confirmed by Sanger sequencing
(Sup-plementary Fig. 1). As expected, undifferentiated HGPS-iPSCs
expressed low levels of HGPS markers, such as progerin, as well as
low levels of SMC markers, such as
α-SMA and SMα-22
12,13(Supplementary Fig. 2a). To induce the differentiation of
HGPS-iPSCs or N-HGPS-iPSCs into SMCs, CD34
+cells were isolated by
magnetic-activated cell sorting from embryoid bodies (EBs)
cul-tured for 10 days in suspension (Fig.
1
a)
14. At this stage,
HGPS-CD34
+cells already express higher levels of progerin mRNA
transcripts relative to N-iPSCs but relatively low levels of SMC
mRNA transcripts compared with somatic hVSMCs
(Supple-mentary Fig. 2b). HGPS-CD34
+cells were then cultured in SMC
induction media (Supplementary Fig. 3) followed by SMC
maturation media (Supplementary Fig. 4) for an additional four
passages. Matured SMCs are referred to as HGPS-iPSC SMCs or
N-iPSC SMCs based on their phenotype, genotype, and
func-tional properties (see below). Both HGPS-iPSC SMCs and
N-iPSC SMCs have similar or higher expression of SMC mRNA
transcripts than somatic hVSMCs (Supplementary Fig. 4a).
Greater than 95% of both differentiated cells express
α-SMA,
smooth muscle myosin heavy chain (SMMHC), and calponin
proteins (Fig.
1
b). Moreover, HGPS-iPSC SMCs express progerin
mRNA transcripts (Fig.
1
c) and progerin protein (Supplementary
Fig. 4b, c). Similar results were obtained for SMCs derived from
HGPS-iPSCs generated from a second Progeria individual;
how-ever, the differentiated cells showed higher progerin protein levels
than the
first Progeria individual (Supplementary Fig. 5).
Importantly, HGPS-iPSC SMCs and N-iPSC SMCs are functional
as they respond to vasoactive agents such as histamine and
angiotensin (Supplementary Fig. 4d) and they contract after
exposure to carbachol (Supplementary Fig. 4e).
SMCs derived from HGPS-iPSCs share similar features to
progerin-expressing cells. Cell lines forced to express progerin
show the activation of several NOTCH signaling pathway
effectors
15. Indeed, our results showed that HGPS-iPSC CD34
+cells had higher expression of NOTCH signaling pathway mRNA
transcripts than N-iPSC CD34
+cells (Supplementary Fig. 6).
Mature HGPS-iPSC SMCs also expressed higher levels of NOTCH
ligand and receptors than N-iPSC SMCs (Supplementary Fig. 6a).
In addition, HGPS-iPSC SMCs responded to farnesyltransferase
inhibitors, as has been shown in other Progeria cell models
16–18.
In the current work, HGPS-iPSC SMCs treated with lonafarnib for
48 h accumulated nuclear prelamin A and showed a decrease in
nuclear shape abnormalities and nuclear blebbing (Supplementary
Fig. 7a–c). Taken together, the cells differentiated from
HGPS-iPSCs-expressed SMC and progeroid markers, are functional and
exhibit physiological responses.
HGPS-iPSC SMCs are vulnerable to arterial shear stress. SMCs
differentiated from N-iPSCs or HGPS-iPSCs were seeded in a
microfluidics system and cultured under flow conditions for up to
7 days (Fig.
1
d). Because SMCs from large arteries are the most
affected in blood vessels in HGPS, we used a
flow of 20 dyne/cm
2,
which is typically found in arterial blood vessels
19. N-iPSC SMCs
(Fig.
1
g), hVSMCs, or HGPS
fibroblasts (80% of which express
progerin) (Fig.
1
e, g) can be cultured in the microfluidics system
for at least 7 days without a visible loss in cell number. In
con-trast, HGPS-iPSC SMCs cultured under
flow conditions formed
cell clumps overtime (Fig.
1
f), and most of the cells detached from
the substrate at day 4 as confirmed by cell number (Fig.
1
g) and
metabolic analyses (Fig.
1
h). During this time period, the
per-centage of cells expressing progerin and displaying nuclear
abnormalities increased significantly until day 4 (Supplementary
Fig. 8). Our results indicate that SMC detachment is mediated by
progerin accumulation, as the inhibition of progerin by antisense
morpholinos
20significantly decreased HGPS-iPSC SMC
detach-ment (Suppledetach-mentary Fig. 9). In addition, we showed that
HGPS-iPSC SMCs with high progerin expression (30% of the cells
express progerin at day 0) detached from the surface of the
microfluidics system in a short time (<12 h) (Supplementary
Fig. 5g). To confirm that progerin accumulation is responsible for
SMC loss, a frameshift mutant stem cell line was generated
(HGPSΔ2-iPSCs) to knockout the HGPS mutant allele and
gen-erated a disease cell line, as previously described in the mouse
21(Fig.
2
a and Supplementary Fig. 10). Specifically, a two-base pair
deletion on exon 11, upstream of the HGPS point mutation
(1814C>T), was generated. Notably, HGPSΔ2-iPSCs expressed
little or no progerin upon differentiation into SMCs as
demon-strated at the transcript and protein levels and did not detach
under
flow culture conditions (Fig.
2
).
HGPS-iPSC SMC detachment does not seem to be mediated by
cell apoptosis. Before cell detachment, HGPS-iPSC SMCs showed:
(i) poor proliferation (as monitored by Ki67 staining) confirming
their contractile phenotype (Fig.
1
i), (ii) similar levels of apoptosis
as N-iPSC SMCs as confirmed by caspase-9 activity (Fig.
1
j), (iii)
an osteogenic differentiation program (Supplementary Fig. 11a,
b), (iv) increased DNA damage
6(Supplementary Fig. 12), and (v)
downregulation of NOTCH
15,22(Supplementary Fig. 13)
signal-ing pathways. Because the in vivo shear stress from blood
flow is
not directly sensed by SMCs but by endothelial cells (ECs), we
co-cultured SMCs differentiated from HGPS-iPSCs (directly
attached to the microfluidics substrate) with human umbilical
artery ECs (HUAECs, on top of the SMCs) under
flow conditions.
Initially, we screened different culture conditions and we found
that endothelial growth media-2 (EGM-2) medium was a suitable
medium to support both cells (Supplementary Fig. 14). Then, we
co-cultured HUAECs and HGPS-iPSC SMCs at different ratios
(1.6, 1, and 0.6) under
flow conditions. In all the ratios tested, we
had a monolayer of HUAECs (Supplementary Fig. 15a) and
HGPS-iPSC SMCs at time zero. After 6 days in
flow conditions, a
significant percentage (>40%) of HGPS-iPSC SMCs was lost
(Supplementary Fig. 15b). For the highest ratio tested (1.6), the
loss of HGPS-iPSC SMCs occurred without visible loss of ECs.
Yet, for EC:SMC ratios below 1, part of ECs also detached from
the microfluidic chamber indicating that, a low ECs density,
may turn ECs vulnerable to
flow conditions. Importantly, cell
vulnerability to
flow conditions was only observed in co-cultures
***
**
101 100 10–1 10–2 10–3 10–4 10–5Relative gene expression
LMNA LMNB1 Progerin N-iPSC-SMCs HGPS-iPSC-SMCs HGPS fibroblasts
*
****
****
****
2 4 6 0 10,000 20,000 30,000 40,000 0 5 10 15 Cell clumps Area of cell clumpsTime (days)
Area of cell clumps (
μ
m
2)
Cell clumps (number/
μ m 2 )(x10 6 ) 0 4 0 4 0 4 0 50 100
Normalized caspase 9 acticity
HGPS-iPSC SMCs N-iPSC SMCs HGPS fibroblasts Time (days)
****
*
**
p < 0.0001 p = 0.0123 p = 0.0084 0 2 4 6 0.0 0.5 1.0 1.5 2.0Time in flow shear stress (days)
Normalized cell number
HGPS-iPSCs-SMCs HGPS fibroblasts hVSMCs N-iPSCs-SMCs *** 0 2 4 6 0.0 0.2 0.4 0.6 0 2 4 6 Cell metabolism Cell proliferation Cell apoptosis
Time in flow shear stress (days) Metabolic activity hVSMCs HGPS-iPSCs-SMCs N-iPSCs-SMCs HGPS fibroblasts ***
e
h
Day 1 Day 4 Day 6
Day 1 HGPS Fibroblasts Day 7 HGPS-iPSC SMCs hVSMCs Day 8
g
f
0 20 40 60 80% Ki67 positive cells
N-iPSCs-SMCs HGPS-iPSCs-SMCs HGPS fibroblasts 0 4 0 4 0 4 Time (days)
****
****
*
p < 0.0001 p < 0.0001 p = 0.0305i
j
d
a
Days Cell counting 0 20 40 60 80 100 120 % of cells N-iPSC-SMCs HGPS-iPSC-SMCs α-SMASMMHC Calpb
Differentiation in suspension CD34+ cells Undifferentiated cell colony 4 Passages (≈15 d) Inductive media 4 Passages (≈15 d) Maturation media HGPS-iPSC SMCs N-iPSC SMCsc
of HGPS-iPSC SMCs but not N-iPSC SMCs (Supplementary
Fig. 15c).
It has been shown that a knock-in mouse line carrying a
homozygous
Lmna
c.1827C>T;p.Gly609Gly
mutated
allele
(Lmna
G609G/G609G) recapitulates most of the described alterations
associated with HGPS, including the loss of SMCs
20. Thus, to
validate the results obtained for the HGPS-iPSC SMCs, we
isolated SMCs from wild-type (WT mSMC) and homozygous
Lmna
G609G/G609G(HOZ mSMC) mice. Both cells expressed
calponin and
α-SMA, while HOZ mSMCs, but not WT SMCs,
showed dysmorphic nuclei and nuclear blebbing (Fig.
3
a, b). WT
mSMCs were cultured under
flow conditions (120 dyne/cm
2to
mimic mice arterial
flow shear stress
23,24) for up to 26 days
without visible loss of cells (Fig.
3
c). In contrast, HOZ mSMCs
detached from the substrate after 8–9 days. These results confirm
that HOZ mSMCs are vulnerable to
flow shear stress similar to
HGPS-iPSC SMCs. Overall, our results indicate that HGPS-iPSC
SMCs are vulnerable to
flow shear stress, as in the case of SMCs
isolated from mice carrying a HGPS-like mutation in the Lmna
gene.
HGPS-iPSC SMCs have significant changes in extracellular
matrix (ECM) secretion and MMP expression. To gain insights
into the mechanism behind SMC detachment, we performed
microarray analyses on HGPS-iPSC SMCs and N-iPSC SMCs at
days 0 and 4 (before cell detachment). At day 0, 2084 genes were
differentially expressed (Log2FC
≥ 1; p < 0.05) in HPGS-iPSC
SMCs vs. N-iPSC SMCs. Of these genes, 51 genes were associated
with cell senescence, as determined by the intersection of all the
differentially expressed genes with the CellAge database
25(279
genes) (Supplementary Data 1). At the protein levels, HGPS-iPSC
SMCs expressed higher levels of p21 and SA-β-galactosidase than
N-iPSCs-SMCs and the level of senescence markers increased
after culture of HGPS-iPSC SMCs in
flow conditions
(Supple-mentary Fig. 16a and Supple(Supple-mentary Data 5). We next performed
pathway analysis on the differentially expressed genes from
HGPS-iPSC SMCs at day 0 vs. day 4 (Supplementary Fig. 17 and
Supplementary Data 2, 3). In general, ECM activation, secretion,
and cell adhesion pathways were upregulated, whereas cell cycle
and DNA replication pathways were downregulated under
arterial
flow conditions at day 4. Among the fifty-seven genes that
were at least threefold down- or upregulated compared with day 0
(p < 0.001) (Fig.
4
a),
five were related to ECM secretion (COL6A3,
IBSP, BGN, SGCG, and EPPK1) and one to metalloproteases
(MMP13). The expression of these genes, as well as others, was
confirmed by qRT-PCR (Fig.
4
a), and the molecular network of
genes that were differentially expressed between days 0 and 4 in
the HGPS-SMCs was examined by Ingenuity Pathway Analysis
(Supplementary Fig. 17). Interestingly, pathway analysis
sug-gested that MMP13 is either a direct or indirect target of multiple
genes upregulated at day 4. Moreover, MMP13 transcript levels
are elevated in HGPS-iPSC SMCs when compared with SMCs
generated from the attenuated disease version of this line
(HGPSΔ2-iPSC SMCs), specially post shear stress (Fig.
2
g).
To further explore the gene array results, we evaluated whether
the presence of ECM secreted by hVSMCs could prevent the
detachment of HGPS-iPSC SMCs under arterial
flow conditions.
Thus, we cultured HGPS-iPSC SMCs on decellularized ECM
deposited by hVSMCs or directly on top of mitotically inactivated
hVSMCs (Supplementary Fig. 18). Both conditions were unable
to prevent HGPS-iPSC SMC detachment. Next, we tested whether
conditioned media collected from HGPS-iPSC SMCs in
flow
conditions for 4 days could induce the detachment of
flow shear
stress-insensitive hVSMCs (Fig.
4
b). Surprisingly, hVSMCs
detach after perfusion with HGPS-iPSC SMC-conditioned media
but not with N-iPSC SMC-conditioned media (Fig.
4
c). Following
these results and given that MMP13 appears to be the
downstream effector for the genes misregulated at day 4
(Supplementary Fig. 17b) we decided to quantify the
concentra-tion of MMP13 in HGPS-iPSC SMC and N-iPSC SMC culture
media after
flow shear stress. Remarkably, MMP13 levels
increased 30-fold in the HGPS-iPSC SMC culture media, but
not in the control cell culture media (Fig.
4
d). Similarly, higher
MMP13 levels were observed in media collected from HOZ
mSMCs under
flow shear stress, when compared with media from
WT mSMCs (Fig.
3
d). Because MMP13 is produced by cells as an
inactive form (proMMP13), which is then activated by cell
membrane MMPs, namely MMP14 (also called MT1-MMP) and
MMP2 (also called gelatinase A)
26, the catalytic activity of
MMP13 secreted by HGPS-iPSC SMCs was analyzed
(Supple-mentary Fig. 19). The concentration of proMMP13 and active
MMP13 increased approximately eight- and
five-fold,
respec-tively, in culture media of HGPS-iPSC SMCs cultured in
flow
conditions from day 0 to day 4. Moreover, the concentration of
proMMP13 and active MMP13 in cell culture media collected
from N-iPSC SMCs cultured in
flow conditions for 4 days was
more than fourfold lower than the one observed with HGPS-iPSC
SMCs. Altogether, our results indicate that HGPS-iPSC SMCs
cultured under
flow conditions showed increased cell senescence,
ECM activation, secretion, and cell adhesion pathways
upregula-tion and dysregulaupregula-tion in the expression of MMP13.
Fig. 1 Vulnerability of HGPS-iPSC SMCs to arterialflow conditions. a Schematic representation of the methodology used to differentiate iPSCs into SMCs.b Expression of SMC markers on iPSC-derived SMCs. Percentage of positive cells expressing SMC markers as evaluated by immunofluorescence (at least 100 cells were counted per each marker). Results are mean ± SEM (n= 3 independent experiments). c Expression of progeria markers on iPSC-derived SMCs. Gene expression by qRT-PCR (gene expression was normalized by the housekeeping gene GAPDH). HGPSfibroblasts were used as control. Results are mean ± SEM (n= 4 technical replicates from a pool of three independent experiments). *, **, ***, **** denote statistical significance (p < 0.05, p < 0.01, p < 0.001, p < 0.0001). Statistical analyses were performed by one-way ANOVA followed by Newman–Keuls’s post test. d Schematic representation of the protocol used. Cells were cultured for 6–8 days in arterial flow conditions (20 dyne/cm2).e Light microscopy images of HGPS
fibroblasts, hVSMCs, or HGPS-iPSC SMCs (10% of the cells accumulate progerin protein) at different culture days. Only HGPS-iPSC SMCs detached from the microfluidic system at day 4. Scale bar is 50 μm. f Number and area of cell clumps in HGPS-iPSC SMCs at different times (at least two images (×10) have been quantified per time). For area of cell clumps n > 2 images examined over three independent experiments; for cell clumps, n = 3 independent experiments.g Number of cells per surface area (mm2) during cell culture under arterialflow (at least three images (×10) have been quantified per time;
n = 3–7 independent experiments). Cell number was normalized by the number of cells present at day 0. h Cell metabolism evaluated by the Presto Blue assay. Absorbance at 570 nm was measured and normalized to the 600-nm values for the experimental wells. n= 3 independent experiments. i Expression of nuclear proliferation marker, Ki67 (at least three images (×10) have been quantified per time). The percentage of Ki67 positive cells was evaluated by immunofluorescence. n > 3 images examined over three independent experiments. j Cell apoptosis evaluated by caspase-9 activity. Results were normalized by cell number. n= 3 independent experiments. From c to g, results are mean ± SEM. *, **, ***, **** denote statistical significance (p < 0.05, p < 0.01, p < 0.001, p < 0.0001). Statistical analyses were performed by a two-tailed unpaired Student’s t test i and j.
MMP13 mediates HGPS-iPSC SMC loss under
flow conditions.
Next, we tested whether the chemical inhibition of MMPs could
prevent HGPS-iPSC SMC detachment. For this purpose, we used
Batimastat (BB-94)
27, a broad spectrum matrix metalloprotease
inhibitor (IC50
= 33 nM for MMP13
28), and a specific MMP13
inhibitor
pyrimidine-4,6-dicarboxylic
acid,
bis-(4-fluoro-3-methyl-benzylamide) (IC50
= 8 nM)
29. Remarkably, both
inhi-bitors significantly decreased the detachment of HGPS-iPSC
SMCs cultured under arterial
flow conditions (at least until day
12) (Fig.
4
e), and this effect was much superior to that of
lona-farnib (Supplementary Fig. 7d) or inhibition through the
pyr-ophosphate calcification process
30(Supplementary Fig. 11c). To
confirm these results, HGPS-iPSC SMCs were subjected to siRNA
knockdown of MMP13 and cultured under arterial
flow
condi-tions for 10 days (Fig.
4
f, g). Our results show that the
knock-down of MMP13 in SMCs increased the stability of HGPS-iPSC
SMCs in
flow culture conditions compared with non-treated
cells. We also analyzed the effects of MMP13 and BB94 inhibition
in HOZ mSMCs (Fig.
3
e). Similar to what was observed with
HGPS-iPSC SMCs, the detachment was significantly delayed
when one of the inhibitors was used. To further demonstrate the
importance of MMP13 in HGPS-iPSC SMC detachment, we
enforced the expression of MMP13 in somatic SMCs (hVSMCs)
and cultured the modified cells in flow culture conditions
0 2 4 6 0.0 0.5 1.0 1.5 2.0
Normalized cell number
(by day 0) Time (days) HGPS-iPSC SMCs HGPSΔ2-iPSC SMCs
****
Calp SMMHC 0 30 60 90 120 % of cellsLamin AProgerinD.NucleiBlebbing
0 30 60 90 120 % of cells LMNA G608G expression
****
HGPS fibroblasts HGPS-iPSC SMCs HGPS Δ2-iPSC SMCs p < 0.0001Morphology Nuclei Lamin A Nuclei Progerin
b
Nuclei SMMHC Nuclei Calponinc
d
f
e
a
100 10–1 10–2 10–3 100 10–1 10–2 10–3 10–4 10–4 MMP13 expression HGPS-iPSC SMCsLMNA gene locus
Exon 11 HGPS allele HGPS Point Mutation Site
Chromosome 1 sgRNA PAM 5’ 3’ 5’ 3’ 3’ 3’ 3’ 3’ 3’ 3’ 5’ 5’ 5’ 5’ 5’ 5’ WT allele N-iPSC HGPS-iPSC HGPS Δ 2-iPSC WT allele WT allele WT allele HGPS allele HGPSΔ2-iPSC SMCs 0 4 Time (days)
**
**
***
p = 0.0035 p = 0.0002 p = 0.0016g
Fig. 2 Expression of progeria and SMC markers in HGPSΔ2-iPSC SMCs. a gRNA directs Cas9 nuclease against mutated exon 11 of LMNA gene, upstream the HGPS mutation, disrupting progerin, without altering lamin A and lamin C. Sanger sequencing for LMNA (NM_170707.4 transcript) exon 11 was performed for: N-iPSCs, HGPS-iPSCs and HGPSΔ2-iPSCs, confirming the deletion of two-base pairs in the HGPSΔ2-iPSCs. b Expression of lamin A, progerin, and SMC proteins monitored by immunofluorescence. Scale bar is 100 μm. n = 6 independent experiments. c Expression of progerin (LMNA G608G gene) in HGPS and HGPSΔ2 cell lines. Results are mean ± SEM (n = 4 technical replicates from a pool of three independent experiments). Statistical analyses were performed by a two-tailed unpaired Student’s t test. d Quantification of lamin A, progerin, dysmorphic nuclei, and nuclei blebbing. Results are mean ± SEM (n= 6 independent experiments). **** denotes statistical significance (p < 0.0001). e Percentage of cells that have been differentiated from HGPSΔ2-iPSCs that express SMC markers at protein level. Results are mean ± SEM (n = 5–6 independent experiments). f Number of cells per surface (mm2) as quantified by high-content microscopy (at least three images (×10) have been quantified per time). The number of cells was
evaluated after 6 days under arterialflow and was normalized by the number of cells present at day 0. n > 3 images examined over three independent experiments.g MMP13 mRNA transcripts quantified by qRT-PCR analyses in HGPS-iPSC SMCs or HGPSΔ2-iPSC SMCs cultured under flow conditions. MMP13 mRNA transcripts were normalized by GAPDH. n= 4 technical replicates from a pool of three independent experiments. **, *** denote statistical significance (p < 0.01, p < 0.001). Statistical analyses were performed by a two-tailed unpaired Student’s t test.
0 8 0 8 0.00 0.01 0.02 0.03 Concentration of MMP13 (pg/cell)
**
HOZ mSMCs WT mSMCs Time (days) p = 0.0022D. NucleiBlebbing Calponinα
-SMA 0 20 40 60 80 100 0 20 40 60 80 100 % of cells
% of cells with organized fibers
a
WT mSMCs HOZ mSMCsb
0 5 10 15 0 20 40 60 80 100 120 Time (days) % of adhered cells HOZ HOZ MMP13i HOZ BB94d
Lamin A α -SMA 0 20 40 60 80 100 120 % of adhered cells Time (days) 0 3 9 26 HOZ mSMC WT mSMC****
c
e
Fig. 3 Characterization and impact offlow shear stress in SMCs isolated from wild-type (WT) and homozygous (HOZ) LmnaG609G/G609Gmice. a Mouse SMCs were cultured for 9–26 days in arterial flow conditions (120 dyne/cm2). Immunofluorescence analyses performed on mouse SMCs
(6-week-old WT and HOZ LmnaG609G/G609Gmice) at passage 4 forα-SMA and Lamin A. Nuclei were stained with DAPI. Scale bar is 20 µm. n = 3–4 images examined over three independent experiments.b Percentage of dysmorphic nuclei, nuclei blebbing, and SMC organizedfibers in mSMCs (assessed in static conditions). n= 3-4 images examined over three independent experiments. c Percentage of adhered cells over time. Cells were cultured under flow conditions. n = 3–4 independent experiments. Statistical analyses were performed by one-way ANOVA followed by Newman–Keuls’s post test. d Quantification of MMP13 in HOZ mSMCs and WT mSMCs. Cells were analyzed at day 0 and day 8 under flow. Fluorescence signal was normalized by cell number. n= 3–4 independent experiments. Statistical analyses were performed by a two-tailed unpaired Student’s t test. e Percentage of adhered cells over time. Cells were cultured underflow conditions. n = 5–6 independent experiments. In graphs b–e, results are mean ± SEM. *,**,***,**** denote statistical significance (p < 0.05, p < 0.01, p < 0.001, p < 0.0001).
(Supplementary Fig. 19). Notably, the number of cells observed at
day 7 is lower than the one observed in WT cells indicating that
some of the modified cells were lost during the flow culture
conditions.
We then asked whether the modulation of MMP13 activity
could affect progerin expression associated with the vulnerability
of HGPS-iPSC SMCs to
flow shear stress. Interestingly, chemical
inhibition of MMP13 in HGPS-iPSC SMCs cultured for 7 days in
flow conditions reduced the percentage of progerin-positive cells
(Fig.
4
h); however, it did not decrease progerin expression in cells
with high levels of progerin, such as HGPS
fibroblasts. In
addition, the chemical inhibition of MMP13 did not reduce the
activity of alkaline phosphatase in HGPS-iPSC SMCs cultured for
7 days in
flow conditions (Fig.
4
i). Overall, the results obtained
0 12 24 36 48 0 25 50 75 100 125 150 Time (h) % of adhered hVSMCs HGPS-iPSC SMC CM N-iPSC SMC CM Non-treated BB94 MMP13i BB94MMP13i 0.0 0 4 0 4 0 4 0 4 0.5 1.0 1.5 2.0Normalized cell number
to day 0 d7 d12 **** **** **** **** 0 50 100 150
% of cells with progerin
HGPS fibroblasts HGPS-iPSC SMCs MMP13 inhibition – + – +
****
p < 0.0001 0.00 0.01 0.02 0.03 0.04Relative gene expression
*** No transfection siRNA control siRNA MMP13 *** 0 2 4 6 8 Concentration of MMP13 (x10 –4, pg/cell) **** * * Time (days) HGPS-iPSC SMCs N-iPSC SMCs hVSMCs HGPS fibroblasts p < 0.0001 p = 0.0156 p = 0.0417 EPS8NR4A3 PXK OLFML2A LIPH AMTN
TNFAIP6ANGPTL4EPPK1SESN2 SGCGMMP13 IBSP HAS3 COL6A3 BGN –4 –2 0 2 4 6 8 10 12 14 Fold change HGPS-iPSC SMCs N-iPSC SMCs
***
****
***
**
***
****
**
*
**
**
***
**
****
*
****
p = 0.0023 –6 –4 –2 0 2 4 6 10–7 10–6 10–5 10–4 10–3 10–2 10–1 100Log2 (fold change)
4 days Concentration of MMP13
Effect of media in the detachment of hVSMCs
MMP13 inhibition 4 – 12 days
Cell detachment Progerin accumulation Alkaline phosphatase activity
e
c
b
d
f
7 10 0 10 20 30 40 Time (days) Fold of control(transfected with control siRNA)
h
i
0 1 2 3 4 5Alkaline phosphatase activity normalized by cell number
MMP13 inhibition + –
a
p -valueg
after chemical and genetic inhibition, the increase of MMP13
after
flow shear stress and the effect of HGPS-iPSC
SMC-conditioned media on cell detachment, indicate that MMP13
mediates SMC loss.
Inhibition of MMP13 in
Lmna
G609G/G609Gmice significantly
increased the number of SMCs in aortic arch. To confirm the
importance of MMP13 dysregulation in progeroid animal models,
we quantified MMP13 in the plasma of Lmna
G609G/G609Gand WT
mice (Fig.
5
a). The results showed that the levels of MMP13 were
higher in mutant mice (Fig.
5
b). Then, we asked whether the
inhibition of MMP13 in Lmna
G609G/G609Gmice could decrease
SMC loss. For this purpose, we generated double-mutant lines,
Lmna
G609G/G609GMmp13
−/−and
Lmna
G609G/G609GMmp13
+/−(Supplementary Fig. 20), and evaluated the heart rate and SMC loss
in the aortic arch
20of these mice at week 10 (Fig.
5
a). Heart rate
was chosen as a measure of the overall health status of the HGPS
model and the derived double-mutant lines, given that bradycardia
was a clinical abnormality evidenced in both Lmna
G609G/G609Gmouse as well as Zmpste 24
−/−progeria mouse models
20,31.
Both double-mutant mice showed higher heart rates (Fig.
5
d)
and numbers of SMCs (Fig.
5
c, e) in the aortic arch than
Lmna
G609G/G609GMmp13
+/+mice. Interestingly, Lmna
G609G/G609GMmp13
−/−and Lmna
G609G/G609GMmp13
+/−mice showed a lower
number of progerin-positive cells in the aortic arch than
non-mutated mice (Fig.
5
c, f). In addition, Lmna
G609G/G609GMmp13
+/−mice (but not Lmna
G609G/G609GMmp13
−/−mice) showed an
increase of the aortic media thickness being similar to the
non-mutated mice (Fig.
6
a), as confirmed by orcein staining. We
performed proteomic analyses of aortic arches from mutated and
non-mutated mice (n
≥ 5 mice per strain) using data independent
acquisition mass spectrometry
32,33. Principal component analysis
based on 2260 proteins detected showed that the proteome profiles
of aortic arches from Lmna
G609G/G609GMmp13
+/−mice were more
closely related to the profile of WT mice to that of Lmna
G609G/G609G
Mmp13
+/+mice (Fig.
6
c). From the 161 proteins
differen-tially expressed between the mutant and WT mice aortic arches (q
< 0.05 and abs(log
2fold change) > 0.58), ~25% of the proteins had
similar expression in Lmna
G609G/G609GMmp13
+/−mice and WT
mice (Fig.
6
c and Supplementary Data 4).
Motivated by these results, we then tested a therapeutic
approach to reduce SMC loss in Lmna
G609G/G609GMmp13
+/+mice. For this purpose, we used Batimastat because human
safety has been previously demonstrated in clinical trials
34.
Lmna
G609G/G609GMmp13
+/+mice at week 5 were intraperitoneal
(IP) injected
five times a week (Fig.
7
a). At week 10,
Batimastat-treated Lmna
G609G/G609GMmp13
+/+mice had similar heart rates
to non-treated animals (Fig.
7
c); however, they showed higher
SMCs in the aortic arch than non-treated mice, as confirmed by
cell nuclei counts and verified by the increase levels of SMC
markers determined by qRT-PCR analyses (Fig.
7
b, d, e). No
differences were observed between non-treated and
Batimastat-treated mice regarding progerin accumulation in the aortic arch
(Supplementary Figs. 20c). Overall, our data shows that the
in vivo inhibition of MMP13 by genetic or chemical interventions
yielded mice having significantly higher numbers of SMCs in the
aortic arch.
Activation of MMP13 is mediated by the activation of the
glycocalyx. The glycocalyx is a surface layer of proteoglycans and
glycosaminoglycans that are immobilized in the cell membrane.
Glycocalyx components have been shown to be involved in
flow
shear stress sensing by SMCs
35,36. To identify the mechanism
underlying the upregulation of MMP13 in HGPS-iPSC SMCs
cultured under arterial
flow, we analyzed glycocalyx gene mRNA
transcripts (Fig.
8
b). Interestingly, glycocalyx transcripts were
upregulated in HGPS-iPSC SMCs cultured under
flow conditions
for 4 days (Fig.
8
b). From these upregulated genes, syndecan 2
gene (SDC2), which encodes the transmembrane (type I) heparan
sulfate proteoglycan, was also upregulated in hVSMCs or N-iPSC
SMCs cultured for 4 days in
flow conditions (Supplementary
Fig. 21). Because not all the glycocalyx mRNA transcripts were
upregulated in hVSMCs and N-iPSC SMCs, the results suggest
that the composition of glycocalyx is likely different in these cells
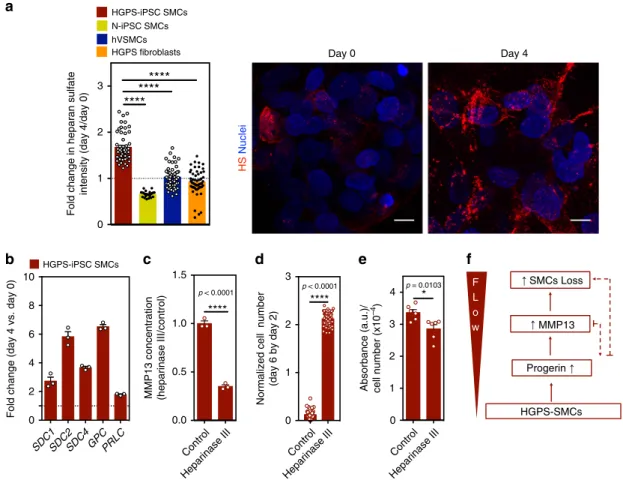
when compared with HGPS-iPSC SMCs. Next, we analyzed the
expression of heparan sulfate at the protein level. In contrast to
control cells, the expression of heparan sulfate increased when
HGPS-iPSC SMCs were cultured under
flow conditions (Fig.
8
a).
Importantly, the enzymatic cleavage of heparan sulfate by
heparinase III (Supplementary Fig. 22) decreased MMP13
con-centration in the cell culture media (Fig.
8
c) and significantly
decreased the detachment of HGPS-iPSC SMCs cultured under
flow conditions (Fig.
8
d). Moreover, the enzymatic cleavage of
heparan sulfate slightly decreased alkaline phosphatase activity
(Fig.
8
e).
To further investigate a potential ECM target of MMP13 in
SMCs, we monitored the expression of ECM components in
hVSMCs, HUAECs, N-iPSC SMCs, and HGPS-iPSC SMCs. Our
Fig. 4 MMP13 activity in HGPS-iPSC SMCs cultured underflow shear stress. a Volcano plot representing differentially expressed genes in HGPS-iPSC-SMC cultured underflow conditions at day 0 and 4. Each point represents one of 53,617 genes. 26 and 31 genes were upregulated (red; fold change ≥ 3; p < 0.001) and downregulated (yellow; fold change ≤ 3; p < 0.001), respectively. Graph shows qRT-PCR validation for 16 genes with fold changes >3. Fold change was between days 0 and 4. Gene expression was normalized by the housekeeping gene GAPDH. Results are mean ± SEM, n= 4 technical replicates from a pool of three independent experiments. Statistical analyses were performed by a two-tailed unpaired Student’s t test. b Schematic representation of the experimental protocol used.c Effect of HGPS-iPSC SMC or N-iPSC SMCs conditioned media (in both cases obtained after 4 days underflow conditions) on hVSMCs cultured underflow conditions. n = 1–5 images examined over three independent experiments. d Quantification of MMP13 activity (cell culture media) by ELISA. Cells were analyzed at days 0 and 4 underflow. Fluorescence signal was normalized by cell number. n = 3 independent experiments. Statistical analyses were performed by a two-tailed unpaired Student’s t test. e Effect of MMP13 or BB94 inhibition in HGPS-iPSC SMC detachment. The number of cells was evaluated after 7 and 12 days under arterialflow and was normalized by the number of cells present at day 0. n = 3–5 images examined over three independent experiments. Statistical analyses were performed by one-way ANOVA followed by Newman–Keuls’s post test. f MMP13 knockdown by siRNA in HGPS-iPSC SMCs. MMP13 mRNA transcripts were quantified by qRT-PCR and normalized by GAPDH. Mean ± SEM (n = 4 technical replicates from a pool of three independent experiments). Statistical analyses were performed by one-way ANOVA followed by Newman–Keuls’s post test.g Number of cells per microfluidic area during culture under flow shear conditions normalized by the number of cells in control experimental groups (i.e., cells transfected with control siRNA). n= 7 independent experiments for day 7 and n = 6 independent experiments for day 10. h Percentage of progerin-positive cells after 7 days underflow conditions with SmGM-2 media supplemented or not with MMP13 inhibitor. n = 1–5 images examined over three independent experiments. Statistical analyses were performed by a two-tailed unpaired Student’s t test. i Activity of alkaline phosphatase in HGPS-iPSCs-SMC normalized by cell number per mm2, in cells cultured 4 days underflow conditions. Cells were treated or not with MMP13 inhibitor. n = 3
0 10 20 30 40 50 Concentration of MMP13 normalize by weight *** KiWt WtWt p = 0.0001
d
WtWt KiWte
a
KiHt α -SMA Nucleic
f
555 Progerin Nuclei HS Nuclei 0 200 400 600 Heart rate (bpm) WtWt KiWt KiHt KiKO**
*
b
0.0 0.5 1.0 1.5 2.0 2.5Intensity HS (a.u.)/cell number
(normalized by WtWt) KiKO
g
0.0 0.5 1.0 1.5 2.0 2.5 α-SMA-positive cell nuclei/mm
2 (normalized by WtWt)
*
*
**
p = 0.003 p = 0.0343 p = 0.0142 0 2 4 6 8 10% Progerin positive cells (normalized by WtWt)
**** * * ** ** Lmna+/+ = WtWt LmnaG609G/G609G Mmp13+/+ = KiWt LmnaG609G/G609G Mmp13+/– = KiHt LmnaG609G/G609G Mmp13–/– = KiKo
Age: 10 weeks Heart rate
Immunohistochemistry
Fig. 5 MMP13 inhibition significantly increases SMC number in aortic arch of LmnaG609G/G609Gmice. a Schematic representation of the animal protocol. WtWt, KiWt, KiHt, and KiKo mice (age: 10 weeks) were evaluated.b Quantification of MMP13 activity (plasma from WtWt, n = 9, and KiWt, n = 6, mice) by ELISA. Fluorescence signal was normalized by mice weight. Statistical analyses were performed by a two-tailed unpaired Student’s t test. c Immunofluorescence analyses in the aortic arch for α-SMA, progerin, and heparan sulfate (HS). Cell nuclei were stained with DAPI. Scale bar is 100 µm for α-SMA staining and 50 µm for progerin and heparan sulfate staining. For α-SMA staining, n = 5 animals, except for KiHt (four animals). For progerin staining, n= 5 animals, except for KiHt (three animals). For heparan sulfate n = 6 WtWt, n = 6 KiWt, n = 4 KiHt, and n = 5 for KiKo. d Heart rates in mice (n= 8 WtWt, n = 6 KiWt, n = 7 KiHt, and n = 5 KiKo). Statistical analyses were performed by one-way ANOVA followed by Newman–Keuls’s post test. e Number of SMC nuclei in aortic arch per tissue area (mm2) (n= 2–3 slides examined over five animals, except for KiHt (four animals)). Statistical
analyses were performed by a two-tailed unpaired Student’s t test. f Percentage of progerin-positive cells in SMCs. n = 5 animals, except for KiHt (three animals). Statistical analyses were performed by one-way ANOVA followed by Newman–Keuls’s post test. g Expression of heparan sulfate as evaluated by immunofluorescence. Intensity of heparan sulfate was calculated in each picture (at least 16 pictures per condition) and normalized by cell number mice (n= 6 WtWt, n = 6 KiWt, n = 4, KiHt and n = 5 KiKo). In b, d–g, results are mean ± SEM. *, **, ***, **** denote statistical significance (p < 0.05, p < 0.01, p < 0.001, p < 0.0001).
results indicate that hVSMCs express higher levels of mRNA that
encode collagen 1A1, collagen 3A1, collagen 4A2, and collagen
6A3 than HUAECs (Supplementary Fig. 21c). It has been shown
that MMP13 degrades very efficiently the native helix of all
fibrillary collagens, including collagen type I
37. Our proteomic
results indicate that indeed collagen 1A1 is upregulated in
HGPS-iPSC SMCs exposed to
flow conditions (Supplementary Fig. 16b)
and thus it may be a potential target for MMP13. Overall, our
results indicate that activation of MMP13 is mediated, at least in
part, by glycocalyx activation.
Discussion
In this study, we developed a microfluidic chip formed by a
monoculture or a co-culture of HGPS-SMCs (generated from
iPSCs) with ECs to study the reason underlying HGPS-SMC
Lmna+/+ = WtWt LmnaG609G/G609G Mmp13+/+ = KiWt LmnaG609G/G609G Mmp13+/– = KiHt LmnaG609G/G609G Mmp13–/– = KiKoa
b
KiHt KiKO KiWt WtWt 40 0 –40 –100 –50 0 50 100 PC1 PC2 KiWt KiHtKiKO KiHt KiWt
KiKO
c
WtWt KiWt KiHt KiKo
* * 0 20 40 60
Aortic media thickness (
μ m) * * WtWt KiWt KiHt KiKO Fbxo2 Actn2 Myh1 Myh7 Myh6 Myl2 Des Cryab Tnnt2 Slc25a35 Mccc2 Abhd14b Psme1 Bphl Gstk1 Thop1 Dhrs7 Palm Fah Akap12 Eml1 Add1 Serpinc1 Bpgm Hbb–b2 Sept5 Rrbp1 Ppp1r9b Sel1l3 Ank1 2 1 0 –1 –2 Apoa1 Tf Alb Hbb–b1 Ca2 Slc4a1 Serpina1b Ckmt2
vulnerability to
flow shear stress. To generate the chip, we (i)
developed a protocol to differentiate HGPS-iPSCs into functional
HGPS-SMCs, (ii) demonstrated that HGPS-iPSC SMCs shared
similar properties with other known progerin-expressing cells,
(iii) confirmed that HGPS-iPSC SMCs were vulnerable to arterial
flow shear stress, and (iv) validated the results in ex vivo SMCs
isolated from Lmna
G609G/G609Gmice. Using the chip, we have
identified MMP13 upregulation as an important mediator of
HGPS-SMC vulnerability to
flow shear stress and we confirmed
MMP13’s role in vivo in Lmna
G609G/G609Gmice (Fig.
8
f). MMP13
is upregulated in a number of pathological states including
atherosclerosis and rheumatoid arthritis
38. The upregulation of
MMP13 in HGPS-SMCs cultured under arterial
flow conditions
is in line with examples in the literature showing that enzymatic
ECM remodeling is significantly altered in HGPS cells
39–41.
Multiple protocols have been described in the literature for the
differentiation of iPSCs into SMCs, either via an intermediate
progenitor stage or directed differentiation
14,42–44. These
proto-cols are highly variable in terms of SMC differentiation efficiency,
timescale, and functionality (nondividing contractile phenotype
vs. proliferative phenotype, secretory profile), likely due to the
choice of precursor population to derive the SMC subtypes, the
chemical composition of the differentiation medium, as well as
the choice of inductive SMC factors (e.g., PDGF-BB, TGF-β1,
retinoic acid). Three previous studies have reported the
differ-entiation of HGPS-iPSCs into SMCs
7,9,45by direct
differentia-tion
7or by using an intermediate progenitor (i.e., mesenchymal
stem cells
45or CD34
+cells
9). In some cases, SMCs were not
terminally differentiated (as confirmed by the expression of
SMMHC)
7, in others the percentage of SMCs was relatively low
Fig. 6 Proteins differentially expressed in the aortic arch at week 10 on wild-type and mutant (LmnaG609G/G609GMmp13−/−andLmnaG609G/G609GMmp13+/−) mice. a Orcein-stained ascending aorta (elasticfibers stain in dark brown/black). Black arrow defines the internal elastic lamina while
the white arrow defines the adventitial border. Images illustrate morphological changes rather than aortic media thickness differences. KiWT mice show less compact elastic lamellae and higher irregular profiles of the elastic lamellae (labeled with *) than the other mice. Scale bar is 50 µm. In graph, aortic media thickness was measured from the internal elastic lamina to the adventitial border. Black arrow defines the internal elastic lamina while the white arrow defines the adventitial border. Results are mean ± SEM, n = 3 animals, except for KiHt (four animals). * denotes statistical significance (p < 0.05). Statistical analyses were performed by one-way ANOVA followed by Newman–Keuls’s post test. b Principal component analysis (PCA) of proteome profiles obtained from aortic arches of wild-type (WtWt) and mutant (KiWt, KiHt, KiKo) mice. c Heatmap based on 161 protein groups differentially expressed between KiWt and WtWt mice, in aortic arch, at week 10 (q < 0.05 and abs(log2fold change) > 0.58). Progerin is a mutated protein and thus
not identified by the mass spectrometry. MMP13 is a secreted protein and the levels in cells were not detectable by mass spectrometry. For comparison purposes, the protein fold changes of WtWt vs. KiHt and WtWt vs. KIKo were included in the heatmap. Blue color indicates proteins downregulated in KiWt, KiHt, or KiKo as compared with WtWt, whereas red color corresponds to proteins upregulated in KiWt, KiHt, or KiKo as compared with WtWt. n= 6 for KiWt and n= 5 for WtWt, KiHt, and KiKo; age: 10 weeks.
0 10,000 20,000 30,000 Cell number/mm 2 **** BB94 Placebo p < 0.0001 0 200 400 600 Heart rate Wild type Placebo BB94
b
c
d
BB94 Placeboa
e
α -SMA NucleiRelative gene expression
α -SMA
**
Placebo BB94 p = 0.0047Relative gene expression
Calp
**
p = 0.0029 101 100 10–1 10–2 10–3 101 101 100 10–1 10–2 10–3 102 100 10–1 10–2 10–3**
Relative gene expression
SMMHC p = 0.007 LmnaG609G/G609G Age:5 weeks 1 week Heart rate Immunohistochemistry qRT-PCR Batimastat (30 mg/Kg) or vehicle x5
Fig. 7 MMP treatment using BB94 significantly increases SMC number in aortic arch of LmnaG609G/G609Gmice. a Schematic representation of the animal protocol. LmnaG609G/G609Gmice (n= 8 for treatment group and control group; age: 5 weeks) were IP injected five times a week (30 mg/kg/day; 3 mg/mL in PBS).b Immunofluorescence analyses performed on mouse SMC for α-SMA showing higher number of SMCs in treated aortic arch. Cell nuclei were stained with DAPI. SMCs were stained forα-SMA. Scale bar is 100 µm. For BB94 treatment n = 5 animals. For placebo treatment n = 7 animals. c Heart rates in mice. Wild-type mice were not exposed to BB94. n= 3 for wild-type mice, n = 8 for placebo treatment group and n = 7 for BB94 treatment group.d Number of SMC nuclei in aortic arch per tissue area (mm2) in mice treated or not with BB94. For BB94 treatment, n > 6 images examined overfive
animals. For placebo treatment, n > 9 images examined over seven animals.e Expression of SMC genes in aortic arches of mice treated or not with BB94. Gene expression was normalized by the housekeeping gene GAPDH. n > 3 technical replicates over six animals. **, ***, **** denote statistical significance (p < 0.01, p < 0.001, p < 0.0001). Statistical analyses were performed by a two-tailed unpaired Student’s t test d and e.
(i.e., only 50–60% of the differentiated cells showed specific SMC
markers including
α-SMA, calponin, and SMMHC)
45and no
indication of SMC functionality
9(e.g., contractility, intracellular
accumulation of calcium after exposure to vasoactive agents) was
reported. In the present study, we showed that the differentiation
of HGPS-iPSCs induces the activation of the NOTCH signaling
pathway, a hallmark of progerin-expressing cells
15. This is
observed in the CD34
+progenitor cells and after their
differ-entiation into SMCs. The CD34
+cells have been reported to
express KDR and CD31
43and, thus, are likely of lateral plate
mesoderm origin
42,44. Importantly, the differentiated cells express
high levels of all the SMC markers analyzed (α-SMA, calponin
and SMMHC), are contractile in response to the muscarinic
receptor agonist, carbachol, as observed in typical human aortic
SMCs, and, when matured in culture for ~30 days, they express
progerin. Therefore, our differentiation protocol compares
favorably to other protocols in term of SMC yield and
func-tionality. Interestingly, HGPS-iPSC SMCs express lower levels of
calponin than in N-iPSC SMCs but the reason and possible
implications behind this phenotypic difference remain to be
determined. Nevertheless, most of the HGPS-iPSC SMCs
expressed calponin at the protein level, both at the induction and
maturation steps (Supplementary Figs. 3, 4). A previous study has
reported heterogeneous sized calponin 1-staining inclusion bodies
in the cytoplasm of HGPS-SMCs
9; however, such structures were
not observed in the current study.
It has been reported that in WT animals the aorta was one of
the tissues with the highest expression of lamin A, while in
progeroid animals the aorta was the
first place where progerin
was detected
8. This explains the highest susceptibility of
HGPS-SMCs located in the aorta to biomechanical forces. It has been
reported that mouse SMCs overexpressing progerin exposed to
biomechanical forces detach from the culture vessel after
sub-strate stretching and die
8. Yet, the mechanism of SMC
detach-ment is still poorly understood. Our study indicates that MMP13
mediates SMC detachment as chemical or genetic inhibition of
MMP13 reduces significantly SMC loss. In addition, we found
that the accumulation of progerin is a mediator and not the cause
Control Heparinase III 0 1 2 3 SMCs Loss MMP13 Progerin HGPS-SMCsNormalized cell number
(day 6 by day 2) **** p < 0.0001 0 1 2 3
Fold change in heparan sulfate
intensity (day 4/day 0)
HGPS-iPSC SMCs N-iPSC SMCs hVSMCs HGPS fibroblasts
****
****
****
a
Day 0 Day 4 SDC1SDC2SDC4 GPCPRLC 0 2 4 6 8 10Fold change (day 4 vs. day 0)
HGPS-iPSC SMCs
c
b
d
e
f
HS Nuclei F L o w Control Heparinase III 0.0 0.5 1.0 1.5MMP13 concentration (heparinase III/control)
**** p < 0.0001 Control Heparinase III 0 1 2 3 4
Absorbance (a.u.)/ cell number (x10
–4
) *
p = 0.0103
Fig. 8 MMP13 expression in SMCs is triggered by an increase in heparan sulfate. a Cells were cultured underflow conditions for 4 days and the expression of heparan sulfate was evaluated by immunofluorescence. Intensity of heparan sulfate was calculated in each picture and normalized by cell number. The normalizedfluorescence intensity at day 4 was divided with the one at day 0. Scale bar is 10 μm. n > 4 images examined over six independent experiments. Statistical analyses were performed by one-way ANOVA followed by Newman–Keuls’s post test. b Gene expression of glycocalyx markers (SDC1: syndecan 1, SDC2: syndecan 2, SDC4: syndecan 4, GPC: glypican, PLC: perlecan), as evaluated by qRT-PCR, in HGPS-iPSC SMCs cultured underflow conditions. Gene expression was normalized by the housekeeping gene GAPDH, and the normalized gene expression at day 4 divided by day 0. n= 3 technical replicates from a pool of three independent experiments.c HGPS-iPSCs-SMC cultured underflow condition were treated or not with heparinase III and the number of cells per microfluidic area during culture was calculated and normalized by the number of cells present at day 2. n = 3 independent experiments. Statistical analyses were performed by a two-tailed unpaired Student’s t test. d Quantification of MMP13 activity (cell culture media) by ELISA. Cells were analyzed at day 4 underflow. Fluorescence signal was normalized by cell number and then by control experimental group. n > 9 images examined over six independent experiments. Statistical analyses were performed by a two-tailed unpaired Student’s t test. e Expression of alkaline phosphatase in HGPS-iPSCs SMC, normalized by cell number per mm2, in cells cultured 4 days underflow conditions. Cells were treated or not with
heparinase III. n= 2 technical replicates over three independent experiments. Statistical analyses were performed by a two-tailed unpaired Student’s t test. Ina–e, results are mean ± SEM. *, **, ***, **** denote statistical significance (p < 0.05, p < 0.01, p < 0.001, p < 0.0001). f Summary of the results.
of SMC detachment because HGPS
fibroblasts accumulate high
levels of progerin and do not detach in
flow conditions. Yet, both
inhibition of progerin by morpholinos and the knockout of the
HGPS mutant allele in HGPS-SMCs decreased or prevented SMC
detachment in
flow culture conditions.
Although Lmna
G609G/G609GMmp13
+/−and Lmna
G609G/G609GMmp13
−/−mice showed similar amelioration of SMCs loss in the
aortic arch, our proteomic analyses in the same tissue showed that
Lmna
G609G/G609GMmp13
+/−mice had a closer protein profile to
WT than Lmna
G609G/G609GMmp13
−/−mice. This was consistent
with the media thickness size, which was more similar between WT
mice and Lmna
G609G/G609GMmp13
+/−than to Lmna
G609G/G609GMmp13
+/+mice. Previous studies have shown that Mmp13
−/−mice had defects in vascularization
46and thus the full deficiency of
MMP13 in the aortic arch might not be desirable to establish a
phenotype closer to the normality.
The accumulation of proteoglycans in Progeria mouse
mod-els
47as well as in atherosclerotic lesions in HGPS individuals
5has
been demonstrated. According to our results, the upregulation of
MMP13 in HGPS-SMCs under
flow conditions is mediated by
the upregulation of glycocalyx components, which have been
previously implicated as
flow shear stress sensors
35. The
inhibi-tion of components of glycocalyx by enzymatic treatment
decreases significantly the MMP13 levels, the osteogenic program
of SMCs and SMCs detachment. Although the connection
between MMP13 and glycocalyx has been shown previously for
non-disease SMCs, we show here that the accumulation of
gly-cocalyx is responsible for the MMP13 expression under shear
stress conditions, which subsequently leads to the loss of
HGPS-SMCs. It is possible that the activation of MMP13 expression
triggered by an upregulation of glycocalyx is mediated by the
phosphorylation of ERK and FAK and the activation of c-Jun
signaling pathway
35or mediated via NOTCH signaling
path-way
48. Our in vivo results indicated that the expression of
heparan sulfate proteoglycans in the aortic arches at week 10 on
Lmna
G609G/G609GMmp13
+/+mice was not statistically different
from the expression profile found in WT mice. It is possible
that further time is needed to see this upregulation as seen in
other progeroid animal models
3,16or in HGPS individuals
5. Since
the upregulation of heparan sulfate was not observed in
Lmna
G609G/G609GMmp13
+/+mice, it is not surprising that we
could not observe a statistical decrease in heparan sulfate in
Lmna
G609G/G609GMmp13
−/−mice.
The in vivo treatment results presented here using the MMP
inhibitor Batimastat open possibilities for the treatment of HGPS
and vascular aging
49,50. Batimastat acts as an inhibitor of
metalloproteinase activity by binding the zinc ion in the active
site of MMPs. Batimastat has been used previously for the
treatment of human cancer (e.g., malignant ascites
51and
malignant pleural effusions
34) with demonstrated results and few
side-effects in phase I/II clinical trials. Therefore, the current
study proposes Batimastat as a drug to be considered for future
Progeria trials. It should be noted that most of the compounds
identified so far in preclinical tests to treat Progeria have been
focused: (i) in the reduction of progerin quantities, by either
reducing its production or increasing its degradation; (ii) in the
reduction of progerin toxicity by targeting its aberrant
prenyla-tion: or (iii) in the identification of compounds capable of
restoring pathological phenotypes downstream of progerin
accumulation. Although these treatments showed encouraging
results in preclinical studies and, in some cases in clinical trials,
they do not address SMC loss over time. The administration of a
drug that prevents SMC loss in early stages of disease combined
with drugs that further reduce accumulation of progerin and
progerin toxicity could be of added value to extend the lives of
HGPS individuals.
Future studies should address the effect of SMC preservation
in large vessels in the lifespan of the animals. It is possible that
the prevention of SMC loss from the large arteries might be
insufficient to lead to a significant increase in animal lifespan.
Evidence collected at week 12
8(before the Lmna
G609G/G609Gdied
of progeria disease) in a therapy that ameliorated SMC loss
showed no significant alterations in terms of body weight (which
is correlated with lifespan
20). Our study performed for 10 weeks
showed also no significant changes in body weight
(Supple-mentary Fig. 20d) between Lmna
G609G/G609GMmp13
+/−mice
and Lmna
G609G/G609GMmp13
+/+mice. Therefore, it is possible
that therapies which ameliorate SMC loss should be combined
with therapies that further reduce the level of progerin in cells of
the major organs, in particular the heart, which seems to present
electrical defects
31. Another issue that deserves further
investi-gation is the relationship between MMP13 and progerin. Both
in vitro and in vivo results indicate that the silencing of MMP13
leads to a significant reduction of progerin in SMCs and the
reason for this pattern is presently not known. Overall, our study
demonstrates that the control of MMP13 expression decreases
the vulnerability of SMCs in large vessels and this strategy may
be of potential value to reduce the impact of the disease in
Progeria individuals.
Methods
iPSCs culture and differentiation. iPSCs were generated from HGPS skin fibro-blasts provided by Coriell Institute and characterized according to Nissan et al.10. iPSCs were derived using the Yamanaka’s original method with OCT4, KLF4, SOX2, c-MYC, transferred using retroviral vectors. All HGPS cells were obtained from Coriell Institute for Medical Research, which in turn were collected under Institutional Review Board approval and individual informed consent (https:// www.coriell.org/0/Sections/Support/NIA/Model.aspx?PgId=351). HGPS-iPSCs clone 1 (passages 43-51); HGPS-iPSCs clone 2 (passages 35-42), and N-iPSCs (passages 30-35) were maintained on mitotically inactivated mouse embryonic fibroblast (MEF) feeder layer, according to Ferreira et al.43. Culture medium for the present work consisted of 80% KO-DMEM (Life Technologies), 0.5% L-glutamine (Life Technologies), 0.2%β-mercaptoethanol (Sigma), 1% nonessential amino acids (Invitrogen), and penicillin-streptomycin (50 U/mL:50 mg/mL) (Lonza), supple-mented with 20% KnockOut™ Serum Replacement (Gibco®) and 10 ng/mL of
b-FGF (Peprotech). Colonies were expanded by routine passage every 3/4 days with 1-mg/ml collagenase type IV (Life Technologies). To induce EBs formation, the iPSCs were treated with collagenase IV (1 mg/mL, Gibco) for 1 h and then trans-ferred (2:1) to low attachment plates (Corning) containing 10 mL of differentiation medium (80% KO-DMEM (Life Technologies), 20% fetal bovine serum (FBS, Invitrogen), 0.5% L-glutamine (Life Technologies), 0.2%β-mercaptoethanol (Sigma), 1% nonessential amino acids (Invitrogen), and penicillin-streptomycin (50 U/mL:50 mg/mL) (Lonza)). EBs were cultured for 10 days at 37 °C, 5% CO2in
a humidified atmosphere, with media changes every 2 days. CD34+cells were
isolated from EBs at day 10 using MACS (Miltenyi Biotec). The percentage of CD34+cells in EBs was between 0.4 and 1.5%. Isolated cells were grown on 24-well plates (~3 × 10⁴cells/cm2) coated with 0.1% gelatin in the presence of EGM-2
(Lonza) supplemented with PDGFBB(50 ng/mL, Prepotech). After four passages,
the medium was replaced by Smooth Muscle Growth Medium-2 (SmGM-2) (Lonza CC-3182) (maturation medium), for additional four passages. hVSMCs (Lonza) were used as controls for the differentiation studies. Cell cultures were maintained at 37 °C, 5% CO2in a humidified atmosphere, with media changed
every 2 days. A step-by-step protocol can be found at Protocol Exchange52. Cell culture under arterialflow conditions. A suspension of HGPS-iPSC SMCs (clone 1), HGPS-iPSC SMCs (clone 2), N-iPSC SMCs, hVSMCs, or HGPS fibro-blasts between 5 × 10⁴and 1.3 × 10⁵cells/cm2was applied to the entry port of an
IBIDI channel (µ-Slide I0,4Luer, or µ-Slide VI0,4Luer, IBIDI) and allowed toflow
inside by capillary force. After 4 h, a confluent cell layer was formed, which was then perfused with SmGM-2 medium orfibroblasts medium (DMEM supple-mented with FBS (20%, v/v, Gibco), sodium pyruvate (Sigma, 1 mM) and penicillin-streptomycin (50 U/mL:50 mg/mL)) at physiologicalflow rate (20 dyne/ cm2). Unless specified, all tests were performed at days 0 and 4 on flow culture
conditions. Cell number and cell clumps were determined on slides stained with DAPI (20×) and normalized by image area (0.3524 mm2). Cell clumps areas were
evaluated by ImageJ software.
MMP activity. MMP activity was quantified on cell extracts by a fluorometric red assay kit (Abcam). Cell extracts were obtained by incubating the cells with Triton X-100 (0.5%, v/v, in PBS, Sigma) for ~15 min, the cells were centrifuged