HAL Id: hal-03219059
https://hal.sorbonne-universite.fr/hal-03219059
Submitted on 6 May 2021HAL is a multi-disciplinary open access archive for the deposit and dissemination of sci-entific research documents, whether they are pub-lished or not. The documents may come from teaching and research institutions in France or abroad, or from public or private research centers.
L’archive ouverte pluridisciplinaire HAL, est destinée au dépôt et à la diffusion de documents scientifiques de niveau recherche, publiés ou non, émanant des établissements d’enseignement et de recherche français ou étrangers, des laboratoires publics ou privés.
PICOPHYTOPLANKTON: BOTTOM-UP AND
TOP-DOWN CONTROLS ON ECOLOGY AND
EVOLUTION
J Raven, Z Finkel, A Irwin
To cite this version:
J Raven, Z Finkel, A Irwin. PICOPHYTOPLANKTON: BOTTOM-UP AND TOP-DOWN CON-TROLS ON ECOLOGY AND EVOLUTION. Vie et Milieu / Life & Environment, Observatoire Océanologique - Laboratoire Arago, 2005, pp.209-215. �hal-03219059�
PICOPHYTOPLANKTON: BOTTOM-UP AND TOP-DOWN
CONTROLS ON ECOLOGY AND EVOLUTION
J. A. RAVEN
1, Z. V. FINKEL
2, A. J. IRWIN
3 1Plant Research Unit, University of Dundee at SCRI, Scottish Crop Research Institute,Invergowrie, Dundee DD2 5DA, UK
2Environmental Science Program, Mount Allison University, Sackville, NB, Canada E4L 1A7 3Department of Mathematics and Computer Science, Mount Allison University, Sackville, NB, Canada E4L 1E6
Corresponding author: [email protected]
CHLOROPHYTA CYANOBACTERIA EUKARYA GRAZING PARASITISM RESOURCE ACQUISITION SEDIMENTATION VIRUSES
ABSTRACT. – Picophytoplankton organisms were derived from larger ancestors in both cyanobacteria and (polyphyletically) in eukarya. There are a number of puta-tive advantages in the acquisition of photosynthetically acputa-tive radiation and nutrient solutes from resource-limited habitats, and probably of maximum specific growth rate, for very small cells relative to the situation for larger phytoplankton cells. However, there are also putative disadvantages for such small cells with respect to bottom-up factors (i.e. those limiting biomass production), including an increased potential for solute leakage and an increased metabolic cost of screening out damaging UV-B. Among top-down factors (i.e. those removing biomass), picophytoplankton may be at an advantage relative to larger phytoplankton cells in avoiding damage from eukaryotic parasites, and losses from sedimentation. How-ever, viruses and (small) grazers can attack picophytoplankton, just as viruses and (larger) grazers can attack larger phytoplankton. Picophytoplankton may be at a disadvantage relative to larger phytoplankton in environments with temporally vari-able resource supply.
CHLOROPHYTES CYANOBACTÉRIES EUCARYOTES BROUTAGE PARASITISME EXPLOITATION DES RESSOURCES SÉDIMENTATION VIRUS
RÉSUMÉ. – Les organismes du picophytoplancton dérivent d’ancêtres de plus grande taille parmi les cyanobactéries et les eucaryotes (polyphylétiquement). Ces organismes ont un nombre d’avantages potentiels dans l’acquisition de la radiation active photosynthétiquement et des éléments nutritifs solubles des habitats limités en ressources, et probablement dans le taux maximum de croissance spécifique, pour de petites cellules par rapport à la situation de cellules du phytoplancton plus grandes. Cependant, il y a aussi des désavantages potentiels pour de si petites cellu-les par rapport aux facteurs de croissance “bottom-up” (c.-à-d. ceux qui limitent la production de biomasse), y compris une augmentation du potentiel pour l’écoule-ment des substances solubles et un coût métabolique élevé pour filtrer les rayons UV-B qui causent des dommages. Parmi les facteurs « herbivores » (“top-down”) (c.-à-d. ceux qui suppriment la biomasse), le picophytoplancton pourrait avoir l’avantage, par rapport aux cellules plus grandes du phytoplancton d’éviter les dom-mages causés par les parasites eucaryotes, et les pertes dues à la sédimentation. Ce-pendant, les virus et les (petits) herbivores peuvent attaquer le picophytoplancton, de même que les virus et les herbivores (plus grands) peuvent attaquer le phyto-plancton plus gros. Le picophytophyto-plancton peut-être désavantagé par rapport au phytoplancton de plus forte taille dans les environnements aux ressources variables dans le temps.
INTRODUCTION
Picophytoplankton are defined here as plank-tonic photosynthetic organisms which are not re-tained by a 2µm pore diameter filter. Molecular phylogenetic analyses show that these very small planktonic photolithotrophs were derived from larger ancestors, that, at least among eukarya, the picophytoplankton condition is polyphyletic, and
that miniaturization of genomes and cells can in-crease the rate of evolution (Raven 1998, Moreira & López-García 2002, Vaulot et al. 2002, Dufresne
et al. 2005, Giovannoni et al. 2005).
This paper aims to examine the possible ecologi-cal and evolutionary advantages and disadvantages of very small size for phytoplankton by compari-son with larger photosynthetic plankton. These possible costs and benefits are discussed first for bottom-up factors, then for top-down factors.
BOTTOM-UP FACTORS
Non-scalable components
This heading includes any environmental factor which decreases the growth of phytoplankton. Ex-amples include the restricted or excessive avail-ability of photosynthetically active radiation (PAR) or of nutrient solutes, and growth rate-inhibiting fluxes of UV-B. The proportion of cell volume taken up by non-scalable components, such as the minimal suite of genes needed for photolithotrophic growth and biological membranes of constant thickness, increases as cell and genome size is re-duced, potentially forcing the displacement of some protein catalysts of growth processes leading to increased specialization and a reduction in aver-age growth rate over a range of environmental con-ditions (Raven 1986, 1998). In general there is an increase in maximum specific growth rate (µm:
biomass increase per unit biomass per unit time) of organisms with decreasing body size of the form µm= a⋅biomass-b, where a is a taxon-specific
‘constant’. While b is held to have a taxon-inde-pendent value of 0.25, it may not be possible to re-ject the possibility of lower values of b for the members of some Phyla or Classes (Raven 1998). If the non-scalable factors restricting µm become
significant within the size range observed for picophytoplankton, then the value of µm for the
smallest picophytoplankton should be lower than
predicted by the scaling relationship. While the smallest known photolithotrophic eukaryote,
Ostreococcus tauri, has very high µm values
(Fouilland et al. 2004), the smallest O2-evolver,
Prochlorococcus, has a lower µmthan many rather
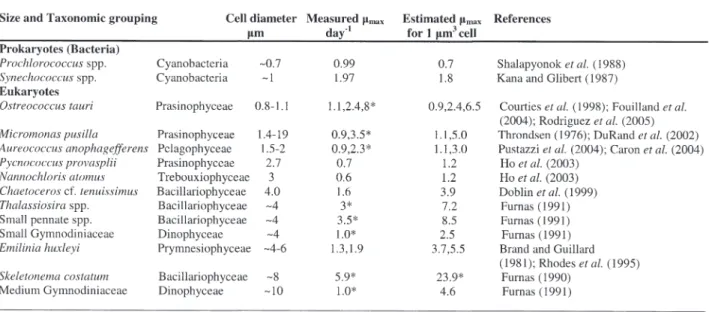
larger cyanobacteria (Sullivan et al. 2005). Based on available observations of maximum growth rates normalized to cell volume, bigger cells appear to have higher intrinsic maximum growth rates (Table I) although there is a great deal of taxonomic and experimental variation in estimates of µm.
Absorption of PAR and UV-B
Turning to resource-limited growth rates, there are sound physical arguments for more effective acquisition of PAR and of nutrient solutes by smaller than by larger organisms (Fogg 1986, Ra-ven 1986, Chisholm 1992, RaRa-ven 1998). For PAR there is less package effect in smaller than in other-wise similar larger cells, so that each pigment mol-ecule is more effective at absorbing photons, and it takes less time for a pigment-protein complex to absorb enough photons from a given radiation field to recoup the energy cost of synthesizing the com-plex, in smaller cells (Raven 1984, 1998, Finkel
et al. 2004). It is thus predicted, and observed, that
the allometric coefficient b is smaller (more nega-tive) in light-limited than in resource-saturated growth of phytoplankton organisms (Finkel & Irwin 2000, Finkel 2001, Finkel et al. 2004).
210 J. A. RAVEN, Z. V. FINKEL, A. J. IRWIN
Table I. – Measured maximum growth rates for picophytoplankton and growth rates normalized to a cell volume of 1 µm3.
*data from field study, all other data from laboratory experiments †computed assuming allometric scaling with an exponent of –0.25
Cell size data predominantly from references indicated and Vaulot et al. (2004).
For Furnas (1990 and 1991) size data were not provided; the size estimates are based on an interpretation of the term “small” and “medium” for diatoms and dinoflagellates.
Furthermore, the smaller package effect in picophytoplankton than in larger organisms means that the spectral diversity among photosynthetic pigments is expressed to a greater extent in the in
vivo absorption spectrum in the smaller organisms,
which indeed have a greater diversity of photosynthetic pigments than in larger organisms (Raven 1998, Larkum & Kühl 2005, Miller et al. 2005). This spectral diversity of pigments is of ecological and evolutionary significance in niche partitioning among picophytoplankton species (Stomp et al. 2005) even if this diversity is not as important on larger evolutionary scales (Falkowski
et al. 2004a,b).
Restriction of growth rate by UV-B radiation re-sembles photoinhibition by high PAR rather than limitation by low PAR. However, there is an impli-cation of small cell size for the effectiveness of sol-uble intracellular UV-B screening compounds in restricting UV-B access to targets such as DNA (Raven 1998). The smaller intracellular optical path length in picophytoplankton means that a cer-tain concentration of soluble UV-B-absorbing com-pounds absorbs a smaller fraction of the UV-B in-cident on the cell than would be the case for a larger cell, so a higher UV-B flux reaches targets (Raven 1998). Other possibilities of avoiding UV-B damage, and variations in the potential to repair UV-B damage, mean that the prediction is not obeyed universally (Raven 1998, Day & Neale 2002, Sommaruga et al. 2005).
Solute acquisition and loss
Smaller cells have an enhanced potential for nu-trient solute influxes from low bulk phase concen-trations through the diffusion boundary layers and the plasmalemma relative to the requirement for growth, granted the allometry of the potential growth rate as a function of organism size (Raven 1986, Chisholm 1992, Raven 1998). There is, how-ever, also more potential for the loss of solutes from the smaller cells (Raven 1986, 1998). Such increased leakage can reduce the energetic effi-ciency of photosynthetic inorganic carbon concen-trating mechanisms (CCMs) by increasing the rate constant for efflux of accumulated CO2 (Raven
1986, 1998, Giordano et al. 2005). The problem is exacerbated for cyanobacteria by the low CO2
af-finity, and low CO2/O2selectivity, of both the Form
IA and Form IB ribulose bisphosphate carboxylase-oxygenases or Rubiscos (Horken & Tabita 1999, Badger & Price 2003, Giordano et al. 2005). The ef-fectiveness of the CCM in Synechocystis in sup-pressing the oxygenase activity of Rubisco is seen by the absence of effect on growth in air-equilib-rium solutions of the deletion of glycine decarbox-ylase, an enzyme of the photorespiratory carbon oxidation cycle which is required to consume
glycolate (Hagemann et al. 2005). Another poten-tial problem for resource acquisition, in this case N2 fixation, is that of keeping oxygen away from,
the nitrogenase – nitrogenase reductase complex. Even with nitrogen fixation limited to the dark phase there is a higher energy cost of removing oxygen per unit nitrogenase activity in picocyanobacteria (and other picoplankton) than in larger diazotrophs. De-spite this, picophytoplanktonic cyanobacteria in which nitrogen fixation has been demonstrated, or in which have the genetic potential for nitrogen fixa-tion, occur in the ocean (Zehr et al. 1998 Falcon et
al. 2005).
Implications of the streamlining of genome
The smallest O2-evolving photolithotrophs
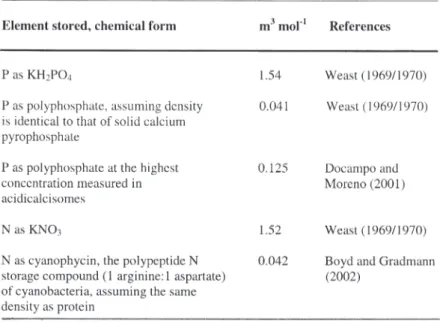
(Prochlorococcus strains) have lost a number of functions, e.g. the ability to use certain oxidized nitrogen sources (Hess 2004). Such gene loss, with genome streamlining, characterizes not only picophytoplanktonic but also the picochemo-organotrophic bacteria of the open ocean (Bryant 2002, Giovannoni et al. 2005). This reduction in the size of the genome offsets considerations of scalability, but ultimately the minimum size of cell and genome would mean a greater fraction of bio-mass is occupied by DNA, with a corresponding de-crease in cellular C:N and C:P relative to the Redfield Ratio (see Table I of Geider & La Roche 2002). An increased fraction of plasmalemma in smaller cells would, as a result of the high protein and phospholipid content of the membrane, also de-crease C:N and C:P relative to the Redfield Ratio (Geider & La Roche 2002). However, the observa-tion is that C:N and C:P ratios in these very small cells may be higher than the Redfield Ratio average for larger phytoplankton cells (Geider & La Roche 2002), with the additional organic C helping to fur-ther increase the surface area per unit N or P in the small cells (reviewed by Raven et al. 2005, Thingstad et al. 2005). A further possibility for in-creasing surface area per unit N or P is to have a more dilute cytoplasm (see Raven et al. 2005). The option of vacuolation is not used by the smallest phytoplankton cells (Raven 1998), with their re-source storage role taken by the essentially particu-late polymers rather than dissolved monomers, with an order of magnitude smaller volume required to store unit N or P (Table II). Overall (Raven 1998, Table 6), there is the potential for a more effective use of already-acquired resources in obtaining fur-ther resources in picophytoplankton than in larger phytoplankton cells both at resource saturation and when resources are limiting. There is, however, the proviso that at the lowest sizes of picophytoplankton the fraction of the cell taken up by non-scalable components may decrease the ef-fectiveness of already-acquired resources in ob-taining further resources. Small and large cells
alike may be able to store nutrients when they are supplied in excess of need, despite using different storage strategies, but the characteristics of the temporal pulse will favour one size over others; small cells with insufficient biomass-normalized storage ability will not be able to take full advan-tage of large nutrient pulses.
TOP-DOWN FACTORS
Sinking
Sinking of live cells out of the euphotic zone is one factor removing biomass from a phytoplankton population. Stokes’ Law shows that, if a 50µm ra-dius spherical cell with density 50 kg m-3greater
than the surrounding water sinks at 26 m day–1
rel-ative to the surrounding water, an otherwise similar cell of 0.5 µm radius cell would only sink 2.6 mm day–1 (Raven 1998). We shall return to sinking in
the context of parasitism. Coagulation of particles can dramatically change the size distribution and sinking fluxes, probably increasing the flux due to small particles above a Stokes’ law prediction (Stemmann et al. 2004a).
Biophagy: eukaryotic parasitoids
Raven (1998) points out that picophytoplankton organisms are very unlikely to support eukaryotic parasites (parasitoids): see Raven & Waite (2004). The smallest known eukaryote is the pico-phytoplankton organism Ostreococcus tauri, with a
volume of 5.24·10-19 m3; the largest spherical
picophytoplankton cell has a volume of 4.19·10-18
m3. A hypothetical parasitoid with the same
vol-ume as Ostreococcus infecting the largest picophytoplankton organism as host could produce only four new parasitoid cells per infecting parasitoid if only half of the host biomass is con-verted into new parasitoids (the rest being unus-able, or respired). No such parasitoid is known. Clearly no eukaryotic parasitoid, even as small as the hypothetical example used above, could have the smallest picophytoplanktonic cyanobacteria as hosts.
Biophagy: viruses
Viruses are widespread top-down factors in cyanobacterial (Sullivan et al. 2005) and eukaryotic (Wilson et al. 2005) phytoplankton, in-cluding picophytoplankton. This view is supported by the recent characterisation of two viruses of dia-toms, a major phytoplankton taxon for which there had been no previous characterisation of viruses (Nagasaki et al. 2004, 2005). Viruses may be in-volved in bloom termination in cyanobacterial and eukaryotic picophytoplankton (Evans et al. 2003). While viruses are much smaller than eukaryotic parasitoids, viral reproduction requires significant quantities of P and the cell quota of P is very low in P-starved Prochlorococcus cells (Bertilsson et
al. 2003). Furthermore, Wilson et al. (1996)
showed that viruses infecting a Synechococcus cul-ture which was starved of P had substantially re-duced burst sizes. With half of the cell quota of 0.36 fg P in the 1.65 Mbp genome, the burst size of
212 J. A. RAVEN, Z. V. FINKEL, A. J. IRWIN
Table II. – Volume needed per mol P or N stored in vacuoles isosmotic with seawater, or as particulate polyphosphate or polypeptide.
cyanomyophage P-SSM2, with a 0.252 Mbp ge-nome (Sullivan et al. 2005), can only be 13, while if a phage was as large as the 0.407 Mbp coccolithovirus (Wilson et al. 2005) the burst size would only be 8. Could this be a constraint on the size of cyanophages infecting the smallest picophytoplankton cells? A similar suggestion, with much more extensive documentation, has been made independently by C Brown and collabo-rators (personal communication; manuscript sub-mitted).
The top-down factor of viral infection may inter-act with bottom-up effects independently through the recycling of nutrients by cell lysis. The
Prochlorococcus phages P-SSM2 and P-SSM4
each have copies of two cyanobacterial genes (phoH and pstS) that are expressed under P defi-ciency, while the Synechococcus phage S-PM2 has, in addition, phoH; could this be related to their in-fection of P-depleted cells (Sullivan et al. 2005)?
Prochlorococcus (Sullivan et al. 2005) and
Synechococcus (Mann et al. 2005) phages also
contain genes related to photosynthesis, another possible interaction between top-down and bottom-up factors.
There is the possibility that increased sinking rates of phytoplankton damaged by parasitoid or virus infection could be a means of purging healthy surface-dwelling populations by the faster sinking of infected organisms (Lawrence & Suttle 2004, Raven & Waite 2004). Even for larger phytoplankton cells the evolution and operation of such a mecha-nism has several constraints, e.g. host specificity of the parasitoid or virus, and the hydrodynamic re-gime of the upper mixed layer (Lawrence & Suttle 2004, Raven & Waite 2004), while the sinking rate of picophytoplankton is so small as to eliminate this mechanism for removing infected cells (Waite
et al. 1997, Raven 1998, Raven & Waite 2004).
Biophagy: grazers
Finally we address the impact of grazers. Picophytoplankton escape grazing by larger graz-ers, but can be consumed by smaller grazers (see Raven 1998, Chrisaki et al. 1999, Fouilland et al. 2004); there are now known to be grazers of picoplankton size which have higher maximum specific growth rates than Prochlorococcus, and so could exert control over this picocyanobacterium (Gouillou et al. 1999). There can be significant dis-crimination among picophytoplankton by grazers, e.g. between Prochlorococcus and Synechococcus (Christaki et al. 1999, Worden et al. 2004). There is thus the frequent interposition of another trophic level, i.e. ciliate and flagellate grazers, between the primary producers and the many larger zooplank-ton grazers for picophytoplankzooplank-ton but not for larger phytoplankton, possibly causing a reversal
in the direction of top-down effects on different size categories of phytoplankton by, for example, changes in the populations of the organisms consuming the larger phytoplankton.
CONCLUSIONS
Many of the ecological and evolutionary aspects of picophytoplankton can be related to their small size. However, ‘biology’ complicates almost all of the arguments made purely on the basis of cell size (Table I).
ACKNOWLEDGEMENTS. – Work in JAR’s laboratory on phytoplankton is supported by BBSRC and NERC. ZVF and AJI are supported by NSERC. We are grateful for comments on the manuscript from Dr D Campbell and two anonymous reviewers, and for translation of the abs-tract into French by M Robertson.
REFERENCES
Badger MR, Price GD 2003. CO2concentrating mecha-nisms in cyanobacteria: molecular components, their diversity and evolution. J Exp Bot 54(383): 609-622. Bertilsson S, Berglnund O, Karl DM, Chisholm SW
2003. Elemental composition of marine
Prochloro-coccus and SynechoProchloro-coccus: implications for the
eco-logical stoichiometry of the sea. Limnol Oceanogr 48(5): 1721-1731.
Boyd CM, Gradmann D 2002. Impact of osmolytes of marine phytoplankton. Mar Biol 141(4): 605-618. Brand L E, Guillard RRL 1981. The effects of
conti-nuous light and light intensity on the reproduction ra-tes of twenty-two species of marine phytoplankton. J
Exp Mar Biol Ecol 50(2-3): 119-132.
Bryant DA 2003. The beauty in small things revealed.
Proc Natnl Acad Sci USA 100(17): 9647-9649.
Caron DA, Gobler CJ, Lonsdale DJ, Cerato RM, Schaf-fer RA, Rose JM, Buck NJ, Taylor G, Boissenneault KR, Mehran R 2004. Microbial herbivory on the brown tide alga Aureococcus anaphagefferans: re-sults from natural ecosystems, mesocosm and labora-tory experiments. Harmful Algae 3(4): 439-457. Chisholm SW 1992. Phytoplankton size. In Falkowski
PG & Woodhead AD eds, Primary Productivity and Biogeochemical Cycles in the Sea. Plenum Press, New York: 213-237.
Chistaki U, Jacquet S, Dolan JR, Vaulot D, Rassoulzade-gan F 1999. Growth and grazing on Prochlorococcus and Synechococcus by two marine ciliates. Limnol
Oceanogr 44(1): 52-61.
Courties C, Perasso R, Chretionnet-Dinet MJ, Gouillou L, Troussellier M 1998. Phylogenetic analysis and ge-nome size of Ostreococcus tauri (Chlorophyta, Prasi-nophyceae). J Phycol 34(5): 844-849.
Day TA, Neale PJ 2002. Effects of UV-B radiation on terrestrial and aquatic primary producers. Annu Rev
Doblin MA, Blackburn SI, Hallgraef GM 1999. Compa-rative study of selenium requirements of three phytoplankton species: Gymnodinium catenatum, Alexandrium minutum (Dinophyta) and Chaetoceros
cf. tenuissimus. J Plankt Res 24(6): 1153-1169. Docampo R, Moreno SNJ 2001. The acidocalcisome.
Molec Biochem Parasitol 114(3): 151-159.
Dufresne A, Garzarek L, Partensky F 2005. Accelerated evolution associated with genome reduction in a free-living prokaryote. Genome Biol 6(2): R14.1-R14.10. Durand MD, Green CJ, Sosik MM, Olson RJ 2002. Diel
variations in optical properties of Micromonas pusilla (Prasinophyceae). J Phycol 38(6): 1132-1142. Evans C, Archer SD, Jacquet S, Wilson WH 2003. Direct
estimates of viral lysis and microzooplankton grazing to the decline of a Micromonas spp. population.
Aquat Microbial Ecol 30(3): 207-219.
Falcon LI, Pluvinage S, Carpenter EJ 2005. Growth ki-netics of marine unicellular N2-fixing cyanobacterial isolates in continuous culture in relation to phospho-rus and temperature. Mar Ecol Progr Ser 285: 3-9. Falkowski PG, Katz ME, Knoll AH, Quigg A, Raven JA,
Schofield O, Taylor FJR 2004b. The evolutionary his-tory of eukaryotic phytoplankton. Science 305(5682): 354-360.
Falkowski PG, Schofield O, Katz ME, Van de Schoot-brugge B, Knoll AH 2004. Why is the land green and the ocean red? In Theirstein H & Young J eds, Cocco-lithophores – from molecular processes to global im-pact. Elsevier, Amsterdam: 429-453.
Finkel ZV, Irwin AJ, Schofield O 2004. Resource alloca-tion alters the ¾ size scaling of metabolic rates in phytoplankton. Mar Ecol Progr Ser 273: 269-279. Finkel ZV, Irwin AJ 2000. Modelling size-dependent
photosynthesis: light absorption and the allometric rule. J Theoret Biol 204(3): 361-369.
Finkel ZV 2001. Light absorption and size scaling of light-limited metabolism of marine diatoms. Limnol
Oceanogr 46(1): 86-94.
Fogg GE 1986. Picoplankton. Proc Roy Soc Lond B 228(1250): 1-30.
Fouilland E, Descolas-Gros C, Courties C, Collos Y, Va-quer A, Gasc A 2004. Productivity and growth of the smallest free-living eukaryote under nitrogen defi-ciency and suffidefi-ciency. Microbial Ecol 48(1): 103-110.
Furnas MJ 1990. In situ growth rates of marine phyto-plankton: approaches to measurement, community and species growth rates. J Plankt Res 12(6): 1117-51.
Furnas MJ 1991. Net in situ growth rate of phytoplank-ton in an oligotrophic, tropical shelf ecosystem.
Lim-nol Oceanogr 36(1): 13-29.
Geider RJ, La Roche J 2002. Redfield revisited: variabi-lity of C: N: P in marine microalgae and its biochemi-cal basis. Eur J Phycol 37(1): 1-17.
Giordano M, Beardall J, Raven JA 2005. CO2 concentra-ting mechanisms in algae: mechanisms, environmen-tal modulation and evolution. Annu Rev Plant Biol 56: 641-658.
Giovannoni SJ, Tripp HJ, Givan S, Podar M, Vergin KL, Baptista D, Bibbs L, Eads J, Richardson TH, Noore-weir M, Rappé MS, Short JM, Carrington JC, Mathur EJ 2005. Genome streamlining in a cosmopolitan oceanic bacterium. Science 309(5738): 1242-1245.
Gouillou L, Chrétiennot-Dinet MJ, Boulben S, Moon-van der Staay SY, Vaulot D 1999. Symbiomonas
scin-tillans and Picophagus flagellatus gen et sp nov
(He-terokonta): two new heterotrophic flagellates of picoplanktonic size. Protist 150(4): 383-398. Hagemann M, Vinnemeir J, Oberpichier I, Boldt R,
Bauwe H 2005. The glycine decarboxylase complex is not essential for a cyanobacterium Synechocystis sp. strain PCC 6803. Plant Biol 7(1): 15-22. Hess WR 2004. Genome analysis of marine
photosynthe-tic microbes and their global role. Curr Opinion
Bio-tech 15(3): 191-198.
Ho TY, Quigg A, Finkel Z, Milligan AJ, Wyman K, Falkowski PG, Morel FMM 2003. The elemental composition of some marine phytoplankton. J Phycol 39(6): 1145-1159.
Horken KM, Tabita FR 1999. Closely related Form I ri-bulose bisphosphate carboxylase/oxgenase molecules that possess different CO2/O2substrate specificities.
Arch Biochem Biophys 361(2): 183-194.
Kana TM, Glibert PM 1987. Effect of irradiances up to 2000µmol m-2s-1on marine Synechococcus WH7803. 1. Growth, pigmentation, and cell composition. Deep
Sea Res Part A Oceanogr Res Papers 34(4) 479-495.
Larkum AWD, Kühl M 2005. Chlorophyll d: the puzzle resolved. Trends Plant Sci 10(8): 355-357.
Lawrence JE, Suttle CA 2004. Effect of viral infection on sinking rates of Heterosigma akashiwo and its im-plication for bloom termination. Aquat Microbial
Ecol 37(1): 1-7.
Mann NH, Clokie MRJ, Millard A, Cook A, Wilson WH, Wheatley PJ, Letarov A, Krisch HM 2005. The ge-nome of S-PM2, a “photosynthetic” T4-type bacterio-phage that infects marine Synechococcus strains.
J Bacteriol 187(9) 3188-3200.
Miller SR, Augustine S, Olson TL, Blankenship RE, Sel-ker J, Wood AM 2005. Discovery of a free-living chlorophyll d-producing cyanobacterium with a hy-brid proteobacterial-cyanobacterial small-subunit rRNA gene. Proc Nat Acad Sci USA 102(3): 850-855. Moreira D, López-García P 2002. The molecular
ecolo-gy of eukaryotes unveils a hidden world. Trends
Mi-crobiol 10(1): 31-38.
Nagasaki K, Tomaru Y, Katanozaka N, Shirai Y, Nishida K, Itakura S, Yamaguchi M 2004. Isolation and cha-racterization of a novel single-stranded RNA virus in-fecting the bloom-forming diatom Rhizosolenia setigera. Appl Env Microbiol 70(2): 704-711.
Nagasaki K, Tomura Y, Takao Y, Nishida K, Shirai Y, Suzuki H, Nagumo T 2005. Previously unknown vi-rus infects marine diatom. Appl Env Microbiol 71(2): 3528-3535.
Pustazzi F, MacIntyre H, Warren ME, Hutchins DA 2004. Interactions of nitrogen source and light inten-sity in the growth and photosynthesis of the brown tide alga Aureococcus anaphagefferens. Harmful
Algae 3(4): 343-360.
Raven JA, Andrews JA, Quigg A 2005. The evolution of oligotrophy: implications for the breeding of crop plants for low input agricultural systems. Ann Appl
Biol 146(3): 261-280.
Raven JA, Waite A 2004. Tansley review. The evolution of silicification in diatoms: inescapable sinking and sinking as escape? New Phytol 162(1): 45-61. 214 J. A. RAVEN, Z. V. FINKEL, A. J. IRWIN
Raven JA 1984. A cost-benefit analysis of photon ab-sorption by photosynthetic unicells. New Phytol 98(4): 593-625.
Raven JA 1986. Physiological consequences of extreme-ly small size for autotrophic organisms in the sea. In Platt T & Li WKW eds, Photosynthetic Picoplankton.
Can Bull Fish Aquat Sci 214: 1-70.
Raven JA 1998. The twelfth Tansley lecture. Small is beautiful: the picophytoplankton. Funct Ecol 12(4): 503-513.
Rhodes LL, Peake BM, MacKenzie AL, Marvuch S 1995. Coccolithophores Gephyrocapsa oceanica and
Emiliania huxleyi (Prymnesiophyceae equals
Hapto-phyceae) in New Zealand coastal waters – characte-ristics of blooms and growth in laboratory culture. N
Z J Mar Freshwater Res 29(3): 345-357.
Rodriguez F, Derelle E, Guillou L, LeGall F, Vaulot D, Moreau H 2005. Ecotype diversity in the marine pi-coeukaryote Ostreococcus (Chlorophyta, Prasino-phyceae). Env Microbiol 7(6): 853-859.
Shalapyonok A, Olson RJ, Shalapyonok LS 1998. Ultra-dian growth in Prochlorococcus spp. Appl Env
Mi-crobiol 64(3): 1066-1069.
Sommaruga R, Hofer JS, Alonso-Sáez L, Gasol JM 2005. Differential sunlight sensitivity of picophyto-plankton from surface Mediterranean coastal waters.
Appl Env Microbiol 71(4): 2154-2157.
Stemmann L, Jackson GA, Ianson D 2004. Vertical mo-del of particle size distributions and fluxes in the mid-water column that includes biological and physical process – Part I. Model formulation. Deep Sea Res I 51(7): 856-84.
Stomp M, Huisman J, de Jongh F, Veraart A, Gerlia D, Rijkboer M, Ibelings BW, Wollfenzien UIA, Stal LJ 2004. Adaptive divergences in pigment composition promotes phytoplankton biodiversity. Nature
432(7013): 104-107.
Sullivan MB, Coleman ML, Weigele P, Rohwer F, Chis-holm SW 2005. Three Prochlorococcus cyanophage genomes: signature features and ecological interpre-tations. PLoS Biology 3(5): 0790-0806.
Thingstad TF, Øvreås L, Egge JK, Løvdal T, Heldal M 2005. Use of non-limiting substrates to increase size; a generic strategy to simultaneously optimize uptake and minimize predation in pelagic osmotrophs? Ecol
Lett 8(7): 675-682.
Throndsen J 1976. Occurrence and productivity of small marine flagellates. Norw J Bot 23(4): 269-293. Vaulot D, Romani K, Not F 2002. Are autotrophs less
di-verse than heterotrophs in marine picoplankton?
Trends Microbiol 10(6): 266-267.
Waite A, Fisher A, Thompson PA, Harrison PJ 1997. Sinking rate versus cell volume relationships illumi-nate sinking rate control mechanisms in marine dia-toms. Mar Ecol Progr Ser 157: 97-108.
Weast RC 1969/1970. Handbook of Chemistry and Phy-sics. 50thEdition. Chemical Rubber Company, Cleve-land, Ohio.
Wilson WH, Carr NG, Mann NH 1996. The effect of phosphate status on the kinetics of cyanophage infec-tion in the oceanic cyanobacterium Synechococcus sp. WH7803. J Phycol 32(4): 506-516.
Wilson WH, Schroeder DC, Allen MJ, Holden MTG, Parkhill J, Barrell BG, Churcher C, Hamlin N, Mun-gall K, Norbertczak H, Quail MA, Price C, Rabbino-witsch E, Walker D, Craigon D, Roy D, Ghazal P 2005. Complete genome sequence and lytic phase transcription profile of a Coccolithovirus. Science 309(5737): 1090-1092.
Worden AZ, Nolan JK, Palenik B 2004. Assessing the dynamics and ecology of marine picophycoplankton: The importance of the eukaryotic component. Limnol
Oceanogr 49(1): 168-179.
Zehr JP, Mellon MT, Zarn S 1998. New nitrogen-fixing microorganisms detected in oligotrophic oceans by amplification of nitrogenase (nifH) genes. Appl Env
Microbiol 64(9): 3444-3450.
Reçu le 7 octobre 2005; received October 7, 2005 Accepté le 12 novembre 2005; accepted November 12, 2005