HAL Id: tel-02061591
https://tel.archives-ouvertes.fr/tel-02061591
Submitted on 8 Mar 2019HAL is a multi-disciplinary open access
archive for the deposit and dissemination of sci-entific research documents, whether they are pub-lished or not. The documents may come from teaching and research institutions in France or abroad, or from public or private research centers.
L’archive ouverte pluridisciplinaire HAL, est destinée au dépôt et à la diffusion de documents scientifiques de niveau recherche, publiés ou non, émanant des établissements d’enseignement et de recherche français ou étrangers, des laboratoires publics ou privés.
employment in developing countries
Aïssata Coulibaly
To cite this version:
Aïssata Coulibaly. Essays on financial development and vulnerability in employment in develop-ing countries. Economics and Finance. Université Clermont Auvergne, 2017. English. �NNT : 2017CLFAD001�. �tel-02061591�
Université Clermont Auvergne
Ecole Doctorale des Sciences Economiques, Juridiques, Politiques et de Gestion Centre d’Etudes et de Recherches sur le Développement International
Essays on Financial Development and Vulnerability in
Employment in Developing Countries
Essais sur le développement financier et la vulnérabilité dans l’emploi
dans les pays en développement
Thèse Nouveau Régime présentée et soutenue publiquement le 27 Février 2017 pour l’obtention du titre de Docteur en Sciences Economiques
Par
Aïssata COULIBALY
Sous la direction de Monsieur Samuel GUERINEAU
Membres du Jury
Alban AHOURE Maître de Conférences Agrégé à l’Université Felix Houphouët Boigny d’Abidjan
Delphine BOUTIN Maître de Conférences à l’Université Clermont Auvergne
Pascale PHELINAS Directrice de Recherche à l’Institut de Recherche pour le Développement (IRD)
Rémi BAZILIER Professeur à l’Université Paris 1 Panthéon-Sorbonne Samuel
GUERINEAU
The University Clermont Auvergne does not give any approval or disapproval to the views expressed in this thesis; they must be considered as belonging to their author.
L’Université Clermont Auvergne n’entend donner aucune approbation, ni improbation aux opinions émises dans cette thèse; elles doivent être considérées comme propres à leur auteur.
Remerciements – Acknowledgements
Je tiens tout d’abord à exprimer ma profonde reconnaissance à mon Directeur de thèse M. Samuel Guerineau pour sa confiance, son soutien et ses précieux conseils durant ces quatre années de thèse au CERDI.
Mes sincères remerciements sont également adressés à Mesdames, Messieurs Delphine Boutin, Pascale Phélinas, Alban Ahouré et Rémi Bazilier qui ont chaleureusement accepté de participer à mon jury de thèse.
Cette thèse a été possible par le biais d’un financement du Ministère Ivoirien de l’Enseignement Supérieur et de la Recherche Scientifique. Elle doit également beaucoup aux excellentes conditions de travail au CERDI avec les différents séminaires de recherche et les enseignements de qualité. Toute ma gratitude va également à l’endroit du personnel administratif pour leur disponibilité et leur bienveillance.
A mes tantes Aminata Koné Ouattara et Marie Jeanne Calvé ainsi que mon papa de cœur Sidi Kébé, ça y est j’y suis parvenu au bout de cette thèse, merci pour votre soutien inconditionnel. A mes filles, Salimata et Camélia, j’espère avoir été à la hauteur et continuer de vous inspirer la volonté d’apprendre et de vous parfaire constamment. Mention spéciale pour mes coauteurs Thierry Yogo et Mélaine Yoffo ainsi qu’à mes camarades doctorants et docteurs (Chrystelle, Alexandra, Maïmouna, Martha, Aristide, Sanogo, Traoré, Seydou, Aristide, Cyril, Hermann, Sékou, Hajer, Razo, Hyppo, Mousse) pour les précieux moments de partage et de convivialité. J’exprime également ma reconnaissance à mes aînés Roland Kpodar et Christian Ebeke du FMI pour leur soutien sans faille et leur disponibilité qui m’ont été d’une grande utilité.
A mon frère et mes sœurs (Amara, Madiarra, Ouanou, Abiba, Perpétue, Mariam et Aminata) qui m’ont toujours épaulé. Mon très cher époux Alassane pour continuer de me soutenir et de me supporter. Mes relecteurs Aminata, Mariatou, Mariame, Mohamed, ma mémé Mariam Touré et Monsieur Bernard Lavanant pour m’avoir accordé de leur précieux temps et permis de m’améliorer en anglais. Je ne saurai oublier tous ceux qui de près ou de loin ont contribué à l’élaboration de cette thèse ainsi que mes très chères baby-sitters occasionnelles, Kadi, Bijou, Zeinab et Lucie pour leur disponibilité.
Table of contents
General Introduction ... 11
Chapter I. Revisiting the Relationship between Financial Development and Child Labor in Developing Countries: Do Inequality and Institutions Matter? ... 37
Chapter II. . Access to Financial Services and Working Poverty in Developing Countries ... 89
Chapter III. Are Financial Development and Remittances Substitutes or Complements in their Impact on the Informal Sector? ... 129
Chapter IV. Flexible Financial Products to Address Risk: a Review and a Proposal ... 169
General conclusion ... 213
Contents ... 219
List of tables ... 223
List of figures ... 224
11
General Introduction
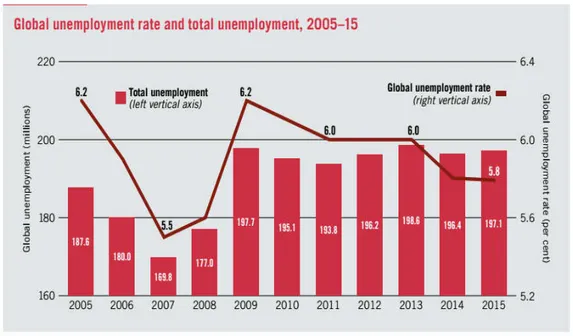
The 2007-2008 global financial and economic crisis in developed countries severely hit their economy through decreasing growth and employment rates among others. As consequence of the economic growth slowdown in industrialized economies, developing and emerging countries experienced reduction in their exports, and capital inflows decreasing their economic activities. According to the International Labor Organization (2016b), the unemployment rate1 worldwide raised from 5.5% before the crisis to 5.8 % in 2015 accounting for 197.1 million of unemployed. This represents a gap of 27 million in addition to the pre-crisis level, which is likely to be underestimated given the difficulty to measure unemployment in developing countries (see Figure 1).
Figure 1: Global unemployment trends
This continuing slowdown is being driven by emerging and developing countries which have been weakened by recession in developed countries as well as recent decline in commodity prices (International Monetary Fund 2016). For instance, with the resulted weakness in global
1 According to the ILO, the unemployment rate is calculated by expressing the number of unemployed persons as
a percentage of the total number of persons in the labour force. The labour force (formerly known as the economically active population) is the sum of the number of persons employed and the number of persons unemployed. The unemployed comprise all persons of working age who were: a) without work during the reference period, i.e. were not in paid employment or self-employment; b) currently available for work, i.e. were available for paid employment or self-employment during the reference period; and c) seeking work, i.e. had taken specific steps in a specified recent period to seek paid employment or self-employment
12 demand2, it is the first time since 15 years that global trade growth is no longer more important than global growth, while it had usually expanded twice as fast as the global economy (World Trade Organization 2016).
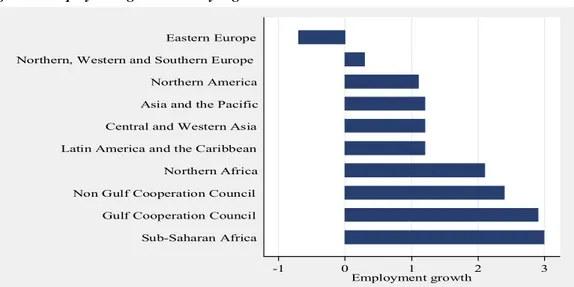
In order to handle the employment effect of the crisis, governments have adopted different strategies. Advanced economies rely on contra-cyclical fiscal policy and automatic stabilizers which permit to limit the negative impact on workers’ revenue with systematic increase in spending and unemployment benefits. In emerging and developing countries, the crisis has hurt severely workers since they are generally employed in the informal sector, and without access to developed social security systems, they are particularly vulnerable and face increasingly risks (Jütting & Laiglesia 2009). These countries have also implemented programs targeting the most vulnerable with social safety nets like in Philippines and China and increase in public investment as in South Africa and Mexico. All these measures have permitted to reduce the decline in employment3 growth with some disparities among regions as emphasized in Figure 2 below.
Figure 2: Employment growth rate by region4 in 2016
Source: Based on compilation and projection from World Employment Social Outlook, (2016b).
2With the recession, the demand from advanced economies is weak. It is also the case from emerging countries
like China which want to be less dependent on international trade and is more and more focused on its domestic market.
3 According to the International Labor Organization, employment comprises all persons of working age who
during a specified brief period, such as one week or one day, were in the following categories: a) paid employment (whether at work or with a job but not at work); or b) self-employment (whether at work or with an enterprise but not at work). Even if, it varies between countries, the working age population refers to all persons aged 15 and older in order to ensure international comparability.
4 Gulf Cooperation Council (GCC) refers to those countries belonging to the Gulf Cooperation Council, namely
Bahrain, Kuwait, Oman, Qatar, Saudi Arabia and United Arab Emirates. Non-GCC refers to the country group comprising Iraq, Jordan, Lebanon, West Bank and Gaza Strip, and Yemen.
-1 0 1 2 3
Employment growth Sub-Saharan Africa
Gulf Cooperation Council Non Gulf Cooperation Council Northern Africa Latin America and the Caribbean Central and Western Asia Asia and the Pacific Northern America Northern, Western and Southern Europe
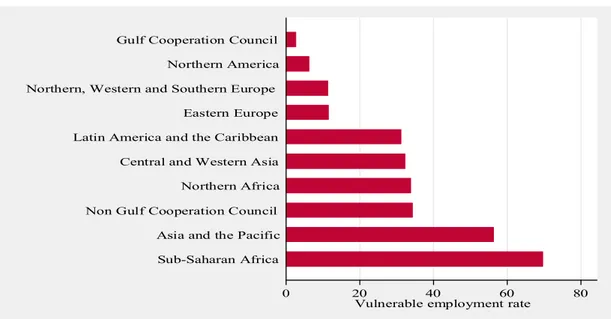
13 Especially, apart from Eastern Europe where we notice a decline of 0.7%, employment growth is positive in all regions with the highest figures for Sub-Saharan Africa where growth is estimated to 3%. However, these improvements in employment trends could hide the fact that workers are more vulnerable in developing countries and they prefer to be in employment despite the decrease in wages due to the weakness of social protection systems. Consequently, according to the ILO, vulnerable employment is a better indicator than unemployment in the context of developing countries. It is defined as the share of own-account and contributing family workers in total employment, those who are subject to high level of precariousness with limited access to social protection schemes. Globally, vulnerable employment represents 46% of total employment accounting for 1.5 billion of people (International Labour Organisation 2016b). Figure 3 below displays vulnerable employment rate by region. In comparison to Figure 2 where employment growth was the most important in Sub-Saharan Africa, this region now exhibits the highest prevalence of vulnerable employment accounting for 70% of total employment followed by Asia and the Pacific region. This indicates that growth has not been enough inclusive to generate more decent jobs which can enable people to earn a fair income and ensure a better quality of life for them and their families.
Figure 3: Vulnerable employment rate by region
Source: Based on compilation and projection from World Employment Social Outlook, (2016b).
0 20 40 60 80
Vulnerable employment rate Sub-Saharan Africa
Asia and the Pacific Non Gulf Cooperation Council
Northern Africa Central and Western Asia Latin America and the Caribbean Eastern Europe Northern, Western and Southern Europe
Northern America Gulf Cooperation Council
14
The financial crisis and employment
Since the crisis has a financial origin, several studies have tried to investigate the consequences of this financial crisis in terms of employment. The impact of the crisis on employment is through a reduction in investment and production due to the increase of uncertainty resulting in higher risk premium (Pindyck & Solimano 1993) and stricter lending standards (Hall 2010). For instance, using survey data on firms from Europe and Asia, Campello et al. (2010) demonstrate that financially constrained firms have reduced their spending and employment and bypass attractive investment opportunities. The crisis can also have structural impacts on unemployment with a hysteresis effect. Especially, if unemployed people lose their skills or become less productive during long periods of unemployment. In addition, the most affected are the most vulnerable like women and young people who generally lack professional experience even if these effects tend to vanish over time. For instance, in the case of Philippines, Castillo (2009) emphasizes that the crisis has jeopardized employment perspectives, particularly for the young people, women, and employers of small and medium enterprises. Han (2009) also demonstrates that the crisis leads to more unemployment which has affected household’s financial solvability in United States. These households were no more able to meet their basic needs for housing, food, clothing, and medical care. Moreover, based on a panel of 97 countries from 1980 to 2008, Bernal-Verdugo et al. (2015) show that the financial crisis had increased unemployment in the short term but this effect tends to vanish over time especially for countries with flexible labor market otherwise the negative effect tends to persist even if its intensity is reduced, once again young people are the most affected.
Financial development and employment
In this thesis, we argue that beyond the impact of the financial crisis which has largely been investigated, there is a need to focus on the relationship between finance and employment in general. Few studies have investigated empirically this link particularly for developing countries; they generally pay attention to the association between financial development and growth. Despite it is admitted that financial development can lead to more growth especially in developing countries (Akinlo & Egbetunde 2010; Andersen & Tarp 2003; King & Levine 1993; King & Levine 1993; Beck et al. 2000; Levine et al. 2000), it is not sure that growth will generate more employment. A major macroeconomic study in this field is
15 Pagano and Pica (2012) that used industry level data for a panel of developing and developed countries to assess how financial development can influence employment and reallocation of labor between industries. They find that financial development, measured by the level of industry dependence on the financial sector, tends to generate more employment only in non OECD countries group which is largely composed of developing countries. Moreover, these findings are robust to the use of alternative measures of financial development namely the ratio of credit to the private sector and market capitalization. They are based on the assumption that with access to finance, firms do not favor investment in capital rather than in labor. This study also emphasizes a dark side of financial development resulting in a lower growth of employment during bank crises especially for the industries which are more dependent on external finance and those in financially developed countries.
Other authors focus on specific countries studies. Using data from 1973 to 2007 for Pakistan, Shabbir et al. (2012) find that employment is positively associated with the ratio of credit to the private sector and this relation is bidirectional. These results are similar to that of Tuğcu & Aslan (2012) that used data from Turkey, using as a measure of financial development the ratio of broad money and quasi money to GDP. They emphasize that the relation is unidirectional from financial development to employment, and stable. The proportion of employment explained by financial development tends to increase over time from 0% to 6.65% the following twenty years.
The financial determinants of employment have also been widely investigated in the framework of developed countries (Campello et al. 2010; Nickell & Nicolitsas 1999; Nickell & Wadhwani 1991; Sharpe 1994) as well as the link between labor market regulation and financial development (Gatti et al. 2012; Somers & Weil 2004). They generally underlined that financial imperfections and constraints for firms in terms of high levels of debt and ratio of interest payments to cash flow, low levels of turnover, and limited venture capital5 jeopardize
employment.
In developing countries, surveys from the Doing Business Initiative also emphasize that financial constraints especially for access to financing are among the first obstacles to firm expansion in terms of investment and employment as underlined in Table 1 below (La Porta & Shleifer 2014).
16 To sum up, we demonstrate that there is a need to focus researches directly on the relationship between financial development and employment in developing countries. In addition, unemployment rate is not suitable in the context of developing and emerging countries where social security schemes are underdeveloped, thus indicators reflecting vulnerability in employment are more suitable.
Table.1: Obstacles to doing business
Source: (La Porta & Shleifer 2014).
Contribution of the thesis
Given that studies on the link between financial development and employment widely focus on developed countries, we choose to focus on developing and emerging countries which have been neglected in the literature.
In addition, in these countries without access to social security schemes, during period of crises, households tend to increase their labor supply despite the decrease of wages, raising their vulnerability and the prevalence of poor workers (Blundell et al. 2016; Combes et al. 2014). This could also be linked to the fact that with a limited access to financial services (credit, saving and insurance), they used other mechanisms in order to smooth their consumption. Especially, it has been demonstrated that in case of shocks, households rely on informal
17 employment (Jütting & Laiglesia 2009) as well as on child labor (Beegle et al. 2006; Dehejia & Gatti 2005; Rose 2001) as buffers. For instance, child labor is still prevalent in developing countries, despite efforts from governments and the international community. At the same time, we notice a raise of the informal sector since the crisis both in developed and developing countries according to the last estimates of Hassan & Schneider (2016).
Moreover, among the poor which are the most vulnerable in developing and emerging countries, unemployment is not a major concern, as they are obliged to work. The main problem is that despite working long hours, they don’t earn enough to escape poverty and effectively meet their basic needs in terms of education, health, housing etc. For instance, it is relevant to question the features of jobs which are created. Are they enough productive to ensure a fair income? Do they allow workers to benefit from social security and guarantee safety at work as well as healthy working conditions? Thus, job quality matters if we want to reduce poverty as underlined in the last report of the ILO (2016a) “World Employment and Social Outlook:
Transforming jobs to end Poverty”.
Hence, in this thesis, we concentrate our analysis on the most vulnerable workers and study what are the impacts of financial development respectively on (i) child labor which is still prevalent in developing and emerging countries. (ii) Working poverty, focusing on those workers living below the poverty line with their family. (iii) The informal sector, given that it is the main source of employment in developing countries and participates on a half to three quarters (3/4) of non-agricultural job creation (ILO 2011).
These topics can be grouped under the concept of decent work which is at the core of ILO agenda and among the Sustainable Development Goals (SDGs), enacting the new vision of development of the United Nations (UNs)6.
Overall, we do not only limit our analysis to the impact of financial development. We also look at how financial products could be designed so as to help the poor manage effectively shocks while preserving discipline for the providers of such products. We refer to them as flexible financial products which help to reduce the vulnerability of the poor and increase their resilience whereas facilitating access to financial services. We focus on microfinance institutions since they used to serve the poor than other financial institutions.
6 It is mentioned in the Goal 8 “Promote sustained, inclusive and sustainable economic growth, full and productive
18 For the rest of this section, we define our key concepts and present for each topic how we contribute to the existing literature.
3.1. Key concepts: some facts and figures
Financial development
By financial development we refer to the capacity of financial institutions (banks, insurances companies and other financial institutions) and markets in “(1) producing and processing
information about possible investments and allocating capital based on these assessments; (2) monitoring individuals and firms and exerting corporate governance after allocating capital; (3) facilitating the trading, diversification, and management of risk; (4) mobilizing and pooling savings; and (5) easing the exchange of goods, services, and financial instruments” (Čihák et
al. 2012).
In this thesis, we focus on financial institutions, since households and firms rely less on financial markets in developing countries. When financial institutions work properly by allocating resource to the most productive projects, they tend to expand opportunities and sustain growth. In contrary, financial development is likely to be detrimental to growth and poverty reduction and to increase inequality if elites prevent the poor from benefiting to financial access through direct control or regulatory capture of the financial system (Rajan & Zingales 2003; Claessens & Perotti 2007).
The traditional measures of financial development have focused on financial depth or size. The recent indicators integrate in addition (i) the degree to which individuals can and do use financial institutions and markets (access), (ii) the efficiency of financial institutions and markets in providing financial services (efficiency), and (ii) the stability of financial institutions and markets (stability).
The most widely used indicator in macroeconomic studies is the ratio of private credit to GDP given its strong correlation with growth and poverty. It refers to domestic private credit to the real sector by financial institutions as percentage of GDP. It excludes credit issued to governments, government agencies, and public enterprises, and from central banks. Compared to other used indicators, like the ratio of money and quasi money to GDP (M2 to GDP), liquid liabilities and the ratio of commercial bank assets to commercial bank plus central bank assets, it has the advantage to capture the degree of bank intermediation. Overall, these measures
19 including private credit ratio have their limits since they do not control for the quality of credit allocation, the broad access to finance, and the efficiency of providing banking services for example. They continue to be used as they offer longer time series data for a large panel of countries compared to other measures of access, efficiency and stability of the financial system. The main indicators we used as proxy for financial development include private credit to GDP, M2 to GDP for the depth of the financial sector and the number of bank branches per 100,000 people for access to financial services. This choice is driven by data availability since our objective is to realize empirical macroeconomic studies with cross country panel data.
Child labor
While developed countries have already eradicated child labor, this phenomenon is still prevalent in many developing and emerging countries. The definition of child labor has evolved as a flood of research has permitted to better understand it. The most used definition is proposed by the ILO even if data are gathered through different types of surveys including the UNICEF-supported Multiple Indicator Cluster Surveys (MICS), the ILO-UNICEF-supported Statistical Information and Monitoring Programme on Child Labor (SIMPOC), and the Demographic and Health Surveys (DHS). Since 2010, a joint collaboration between ILO and UNICEF has permitted to make the MICS questionnaire, also used in DHS, more consistent with international standards.
Figure 4: Children in Employment, child labor and worst forms of child labor
20 The ILO makes a distinction between children in employment or working children, child labor, and hazardous work by children. More precisely, working children refers to children between the ages of 5 to 17 which have performed a paid work for at least one hour during the reference period, generally a week, in the formal and informal sectors. This includes activities which are compatible with schooling while child labor denotes working activities which may undermines children’s physical, mental, social or educational attainment7. Child labor is a subcategory of
children in employment and hazardous work is also a subset of child labor (see Figure 4 above). Hazardous work is any activity or occupation that leads to adverse effects on the child’s safety, health and moral development like night work and long hours of work; exposure to physical, psychological or sexual abuse; work underground, under water, at dangerous heights or in confined spaces; work with dangerous machinery etc. It is generally used as proxy for the worst forms of child labor.
The indicator used in this thesis is close to the definition of working children, it represents the percentage of the population in the 10–14 year-old age bracket that is actively engaged in work. This includes children, who, during the reference period performed “some work” for wage or salary, in cash or in kind at least 1 hour (Ashagrie, 1993). It is widely used in the literature and suitable for cross country panel analysis.
According to the International Labor Organization estimates (ILO /IPEC 2013), about 11% of the world’s child population between the ages of 5-17 year olds were concerned by child labor8 in 2012, accounting for 168 million of children. The prevalence and the incidence of child labor are higher in Africa with 21.4% of children engaged in work (Figure 5) but Asia and Pacific region still has the highest numbers (almost 78 million). A common perception could be that child labor takes place in an industrial setting but according to Figure 6, the main sector
7 According to the ILO Convention states that: children over twelve years of age may, outside the hours fixed for
school attendance, could be employed on light work which duration does not exceed 2 hours per day on either school days or holidays, the total number of hours spent at school and on light work in no case to exceed 7 hours per day.
UNICEF’s standard indicator for child labour used in MICS includes the following:
Age 5 to 11 years: At least 1 hour of economic work or 28 hours of unpaid household services per week. Age 12 to 14 years: At least 14 hours of economic work or 28 hours of unpaid household services per
week.
Age 15 to 17 years: At least 43 hours of economic or unpaid household services per week.
8 According to the ILO, “child labour” is often defined as work that deprives children of their childhood, their
potential and their dignity, and that is harmful to physical and mental development. It refers to work that is mentally, physically, socially or morally dangerous and harmful to children; and interferes with their schooling by a)depriving them of the opportunity to attend school; b)obliging them to leave school prematurely; or c) requiring them to attempt to combine school attendance with excessively long and heavy work
21 employing child laborers is agriculture (59%). In fact, the majority of working children are instead employed by their parents to work on the family farm (ILO /IPEC 2013).
Figure 5 :Percentage of children in child labor, 5-17 years age group, 2012
Figure 6 : Distribution of child labor per sector, 5-17 years age group, 2012
Source: ILO /IPEC. (2013). Marking progress against child labor: global estimates and trends 2000-2012.
Working poverty
This indicator has been developed by the ILO within the framework of the decent work agenda and also serves to assess the eighth SDG target on inclusive growth and productive employment. It also serves as proxy for vulnerable employment. It represents the proportion of employed persons living in households in which per capita income / expenditure is below the international poverty line in Purchasing Power Parity in order to ensure comparability across countries. The employment status is determined at individual level while poverty status is determined at household level. Precedent macro based estimates of working poverty rates depended on ad hoc assumptions9 and lead to biased results. The new estimates rely first on the bottom approach based on direct estimates from national household survey, and follow two principal steps. First, they estimate working poverty rates for countries and years for which no national working poverty estimate is available but for which total poverty rate estimates are available from PovcalNet. Second, they impute working poverty estimates for the remaining
9 This definition was based on the assumptions that (i) the poverty rate of working age population is equal to that
of the population as a whole. (ii) Labor force participation rate of poor is equal to that of population as a whole. (ii)Unemployment rate of poor is negligible.
9.3 8.8 8.4
21.4
0 5 10 15 20 25
Asia and the Pacific Latin America and the
Caribbean Middle East and North
Africa Sub-saharan Africa 2% 7% 59% 25% 7% Not defined Industry Agriculture Services (other than domestic works) Domestic work
22 countries and years, producing a complete time‐series of national working poverty estimates10
using pool linear regression for all countries with regional interaction variables.
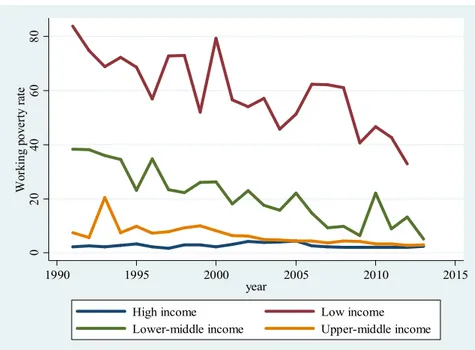
In 2012, poor workers were estimated to 839 million11 in developing countries representing one third of total employment (ILO 2014). Figure 7 below depicts the incidence of working poverty by income level. We can notice that it is declining in all categories of country but as underlined by the ILO (2016a), these gains are fragile because “a significant proportion of those who
moved out of poverty continue to live on just a few dollars per day, often with limited access to essential services and social protection which would allow them to exit precarious living conditions on a more permanent basis”. Moreover figures remain relatively high in low income
countries.
Figure 7: Working poverty incidence by income level
Source: author compilation based on the ILO KILM 9th edition dataset
The informal sector
Defining and measuring the informal sector12 is a difficult and challenging task since this sector,
by its nature, refers to unobserved activities. On the one hand, we have some firms which operate totally in the informal sector; they do not have a bank account, and they do not pay for
10 The independent variables used are : output per worker, agricultural employment share, prime‐age population
share, regional dummy variables, country fixed effects
11 The poverty line considered is US$2.
12 These expressions are also used: informal, underground, shadow, black or parallel sector or economy.
0 2 0 4 0 6 0 8 0 W o rk in g p o v er ty r ate 1990 1995 2000 2005 2010 2015 year
High income Low income
23 taxes. On the other hand, we also have registered firms which hide some part of their sales in order to pay less taxes while continuing to hire formal employees and complying with many regulations.
For the purpose of our study, we use the definition of Schneider (2005) where the shadow economy or the informal sector “includes all market-based legal production of goods and
services that are deliberately concealed from public authorities for the following reasons: (1) to avoid payment of income, value added or other taxes,
(2) to avoid payment of social security contributions,
(3) to avoid having to meet certain legal labor market standards, such as minimum wages, maximum working hours, safety standards, etc.
(4) To avoid complying with certain administrative procedures, such as completing statistical questionnaires or other administrative forms.
This definition does not include all illegal actions related to criminal activities (burglary, robbery, drug dealing), the informal household economy which consists of all household services and production, and tax evasion.”
Economists have attempted to measure informal activities using several tools which can be classified in four groups: the direct and indirect approaches, multiple indicators-multiple causes method (MIMIC), and model-based estimations.
Direct approaches permit to measure the size of the informal sector using surveys, tax audits and other compliance techniques. Their main advantage is to provide a good design of the underground economy activities and the composition of its labor force. Nevertheless, they lead to a lower estimate of the shadow economy and they fail to provide estimations on the growth of the underground economy over time and they don’t allow international comparisons. This is because results obtained are sensitive to the mode of implementation of the questionnaire, the design of questionnaires focused on some features of the underground economy, and the predisposition of interviewees to reveals their non-compliance and fraudulent behavior among others (OECD 2002; Restrepo-Echavarria 2015; Schneider 2005; Schneider & Enste 2000).
Indirect approaches use one or more economic indicators (currency demand, electricity consumption, etc.) for the approximation of the size of the informal sector. They are source of many critics. For example, Schneider & Enste (2000) affirm that not all transactions in the
24 informal sector are done in cash; and informal activities are more intensive in labor than in capital and other sources of energy like gas, oil, coal are also used apart from electricity. In the MIMIC methodology, the informal sector is considered as an unobserved-latent variable. Its estimation is based on structural and measurement equations. The structural equations model the causal relationship between observable “causes” (e.g. a change in tax rate) and the unobservable. The measurement equations link the unobservable latent variable with other proxies used as indicators (e.g. a nation’s currency demand). From these two sets of relations a reduced form is estimated for identifying the slope coefficients between the size of the shadow economy and its cause variables without directly observing the latent variable. Changes in the cause variables are then used to predict changes in the size of the shadow economy relative to GDP for example. This methodology brings an international overview of the shadow economy and report the dynamics of evolution of the underground economy over time. The widely used estimator developed by Schneider at al. (2010) used this approach.
However, several critics have been made to those methods. OECD (2002) reveals an overestimation of the unrecorded economy; Breusch (2016) and Feige (2016) questioned the lack of transparency in describing the procedures and the fluctuating character of the obtained values according to the variables used as causal or indicators. They also point the use of ad-hoc econometric specifications which lead to measurements errors. In addition, Elgin & Oztunali (2012) and Thomas (1999) blame the lack of microeconomic foundations in the construction of this indicator.
In response to these critics, Elgin and Oztunali (2012) propose a two-sector dynamic general equilibrium (DGE) model to estimate the size of the underground economy relative to GDP for 161 countries since 1950 to 2012. This procedure responds to the weaknesses of the precedent by providing estimations without statistical errors, since it does not use statistical methods. It does not depend on ad-hoc specifications and assumptions and it relies on microeconomic foundations. Likewise, it provides the longest available time series data, allowing us to capture time-series and cross-sectional variation. Their model estimates are also calibrated to the widely employed estimates of Schneider et al. (2010) and therefore the correlation between the two measures of the shadow economy is about 0.99. Consequently, our preferred measure is the indicator developed by Elgin and Oztunali (2012). We don’t use measure of informal employment since international comparability is not ensured.
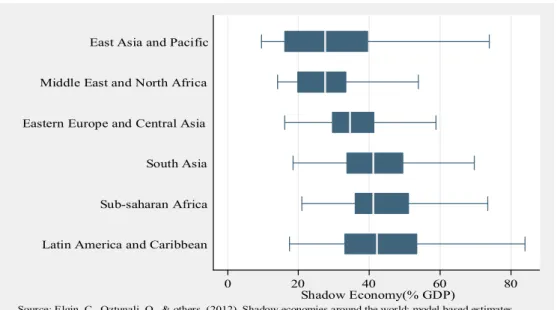
25 Figure 8 displays the distribution of the size of the shadow economy across regions. On average, the informal sector size varies between 28% and 42% of GDP and it is more prevalent respectively in Latin America and Caribbean region followed by East Asia and Pacific.
Figure 8: Distribution of the shadow economy by region
Notes: In box plots, the lower and upper hinges of each box show the 25th and 75th percentiles of the samples, the line in the box indicates the respective medians, and the end-points of whiskers mark next adjacent value.
3.2. Contribution to the literature
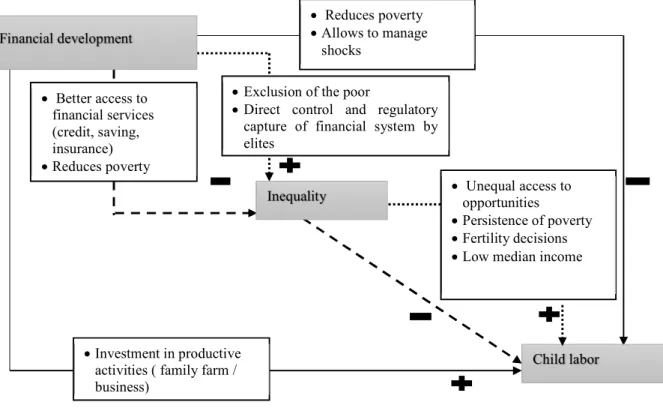
Child labor and financial development
Financial markets imperfections have been identified in the literature as determinants of child labor with some ambiguous results (Alvi & Dendir 2011; Dehejia & Gatti 2005; Ebeke 2012; Hazarika & Sarangi 2008; Menon 2010; Ranjan 2001; Wydick 1999). Particularly without access to credit, in case of shocks, households tend to rely on child labor as a smoothing mechanism. This is because, they are unable to borrow nor to substitute for the foregone earnings of their children due to the inexistence of a market for loans against future earnings. Major macroeconomic studies find a negative association between child labor proxied by working children and financial development measured by the ratio of private credit to GDP. The main limit of these studies is that they do not take into account time dimension in the data. For instance, the study by Ebeke (2012) focuses only on the year 2000 due to data availability for migration. While, Dehejia and Gatti (2005), in their identification strategy, use as
0 20 40 60 80
Shadow Economy(% GDP) Latin America and Caribbean
Sub-saharan Africa South Asia Eastern Europe and Central Asia Middle East and North Africa East Asia and Pacific
Source: Elgin, C., Oztunali, O., & others. (2012). Shadow economies around the world: model based estimates excludes outside values
26 instruments for financial development, the rate of mortality among colonial settlers and the origin of legal systems which do not vary across time. Furthermore, this negative association is challenged by microeconomic studies that emphasized that access to credit can increase child labor (Wydick 1999; Menon 2010; Hazarika & Sarangi 2008). This is likely to occur if parents invest in productive activities like expanding the family business or farm. This can raise the opportunity cost of education and returns from child labor especially if labor markets are imperfect due to shortages in hiring or to moral hazard. In this case, parents are more confident in the workforce of their own children.
In addition, these studies have neglected the role of inequality despite recent studies emphasize that inequality affect financial development and child labor. Consequently, in this thesis, we revisit the classical relationship between financial development and child labor while controlling for inequality. We contribute to the literature by exploiting time dimension for the data of child labor while proposing instruments that vary across time compared to other macroeconomic studies. We try to conciliate macroeconomic studies that report a positive impact of financial development with those that find a positive effect at the microeconomic level. Our intuition is that the differential impact of financial development on child labor could be linked to the persistence of inequality. We also investigate whether the effect of financial development on child labor is nonlinear by looking at conditional effects linked to the quality of institutions and education services.
Working poverty and financial development
Financial development can have a direct impact on working poverty by facilitating access to financial services (credit, saving and insurance) to the poor who can engage in riskier activities, start microenterprises, smooth their consumption, and cope with shocks. Moreover, information asymmetry is also reduced, for example with more demographic bank branch penetration, resulting in lower capital costs. For instance, Degryse and Ongena (2005) find that loan rate decreases with distance from bank branch while Brevoort and Hannan (2007) show that the likelihood for a local commercial loan to be granted is negatively associated to the distance. In addition, Gobbi and Zizza (2007) also demonstrate that the probability to hold a bank account is positively correlated with bank branches.
27 Financial development can also have indirect effects on working poverty. First, it can stimulate economic growth, resulting in more jobs creation and higher incomes. This is the trickle down hypothesis which advocates are Dollar and Kraay (2002), and Ravallion and Datt (2002). Second, through better access to financial services for the excluded non-poor entrepreneurs who are able to invest and create more jobs, financial development can also reduce working poverty. Third, the effect could also transit through labor market. In the short run, with access to financial services like credit, the poor workers will no more be obliged to continue to work despite decreasing wages, they will be able to supply labor more elastically (Blundell et al. 2016; Jayachandran 2006). In the medium and long run, as long as access to finance help building human capital (De Gregorio 1996), the economy starts to create relatively high-paid jobs. It is also important to emphasize the dark side of financial development with financial instability which can hurt the poor and offset these positive effects (Boukhatem 2016; Jeanneney & Kpodar 2011).
The existing literature briefly presented above has focused on poverty in general and don’t pay attention to the effect of financial development on the poor’s wages as labor is their main asset. They also look at the overall supply of labor, but have disregarded the distinction between the poorest workers and the others. This study aims at filling this gap by investigating the effect of financial access on reducing the prevalence of working poor in developing countries. We use a measure of access to financial services and also investigate how barriers to use financial services affect the prevalence of working poor.
28 The informal sector and financial development
It has been demonstrated that access to financial services tends to increase the opportunity costs of operating in the informal sector, limiting the spread of the shadow economy (Beck et al. 2014; Berdiev & Saunoris 2016; Bittencourt et al. 2014; Bose et al. 2012; Dabla-Norris et al. 2008). But, there is also concerns about reverse causation since the shadow economy can also influence financial development. Especially, Gobbi & Zizza (2007) demonstrate that a large share of the informal sector harms financial development as it limits the demand for formal financial services, and it leads to higher monitoring costs and interest rates due to tax evasion. But as underlined by Elgin & Uras (2012), increasing the informal sector size also facilitates financial development, particularly if the capacity constraints13 on formal financial institutions are binding, the informal sector can compensate for this inadequacy. Thus, it is imperative to take into account this bidirectional relationship in empirical studies. Moreover, with a limited access to credit and capital in many developing countries, people are increasingly dependent from remittances inflows as a source of external finance.
Thus, we contribute to the literature by looking at the joint impact of remittances and financial development on the informal sector. We also investigate if remittances and financial development are complements or substitutes in their effect on the shadow economy. In fact, on the one hand, they can be complementary as remittances can provide insurance to households and increase their willingness to participate in the credit market (Aggarwal et al. 2011; Bettin & Zazzaro 2012; Freund & Spatafora 2008). On the other hand, they can be substitutes since remittances are often used to overcome credit constraints in financially underdeveloped economies, limiting the demand for formal financial services (Brown et al. 2013). We also look at if the volatility of remittances matters since studies emphasize that the impact of remittances is likely to depend on its temporary or permanent nature.
Main results
The thesis is divided in four chapters.
13 In presence of capacity constraints, the increase in the demand in the formal sector with a lower informal sector
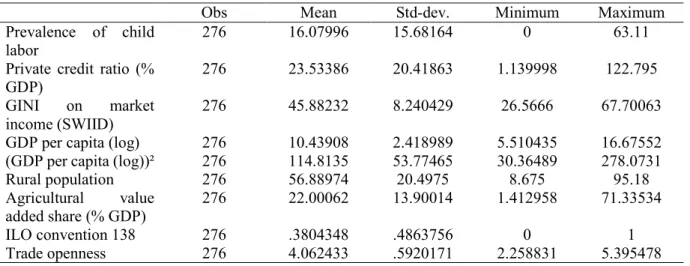
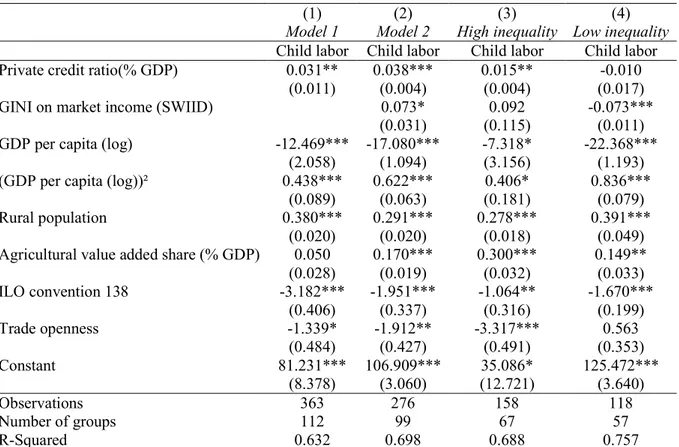
29 In the first chapter, we analyze the relationship between financial development and child labor for a panel of developing countries over the period 1960 to 2004. We find that financial development measured by the ratio of private credit to GDP tends to increase child labor and this result is driven by countries with high level of inequality, above the mean of the Gini coefficient. This could reflect the fact that with access to credit, households tend to invest in their own farm or family business, raising the opportunity cost of schooling and inducing more working children. These findings are robust to the use of different estimation techniques like instrumental variables strategy and generalized method of moments. But, this positive effect is likely to be non nonlinear, especially financial development and education spending are effective in reducing child labor only in countries with better control of corruption. This suggests that better institutions by improving the quality of education and its return tend to alter the positive impact of financial development on child labor.
The second chapter focuses on the effect of access to financial services on the prevalence of working poor. Using a panel of 63 developing countries over the period 2004-2013, we find that improving financial access (as measured by the number of bank branches per 100,000 adults) reduces the prevalence of working poor (workers living with less than US$ 1.25 a day). This effect is even more relevant in countries affected by strong macroeconomic instability. Our findings are robust to endogeneity bias, the addition of various controls including remittances and mobile phone subscriptions, and to the shifting of the poverty line from US$ 1.25 to US$ 1.90. We also show that barriers to use banking services are positively correlated with working poverty. Moreover, our results confirm the validity of some transmissions channels such as growth (trickle-down effect) and the access of the non-poor workers to financial services, suggesting that improving financial access for the excluded non-poor can also have a strong reducing-effect on working poverty.
The third chapter investigates the joint effect of remittances and financial development on the prevalence of the shadow economy14 for a panel of 63 countries from 1990 to 2009. After
factoring for the endogeneity bias of our two variables of interest, we find that financial development and remittances inflows decrease the share of the informal sector in the country of origin. We also test whether remittances and financial development are substitutes or complements. On the one hand, remittances can increase households’ willingness to participate in the credit market, enhancing financial development while on the other hand, they are often
30 used to overcome credit constraints in financially underdeveloped economies, limiting the demand for formal financial services. Our findings suggest that they tend to be substitutes in their impact on the informal sector.
Finally in the last chapter, we analyze how financial products could be designed so as to help the poor to manage effectively shocks while preserving discipline for providers of such products. We review both in theory and practice how flexible financial products can be combined to deal with risk as a complement to insurance. We show that both savings and credit must be used sequentially according to the occurrence of income shocks. Incentives to save are necessary to induce behavior consistent with the desired optimum savings plan, and these incentives can be made compatible with the use of savings for shock response. Several microfinance institutions have taken steps toward offering flexible savings-credit-insurance services to respond to risk while preserving borrower and depositor discipline. They however still fall short of a design that would optimize the provision of financial services to deal with risk.
31
References
Aggarwal, R., Demirgüç-Kunt, A. & Pería, M.S.M., 2011. Do remittances promote financial development? Journal of Development Economics, 96(2), pp.255–264.
Akinlo, A.E. & Egbetunde, T., 2010. Financial development and economic growth: The experience of 10 sub-Saharan African countries revisited. The Review of Finance and
Banking, 2(1). Available at:
http://search.proquest.com/openview/da6a70a3daefe94452178725e5c77f6b/1?pq-origsite=gscholar [Accessed December 28, 2016].
Alvi, E. & Dendir, S., 2011. Weathering the Storms: Credit Receipt and Child Labor in the Aftermath of the Great Floods (1998) in Bangladesh. World Development, 39(8), pp.1398–1409.
Andersen, T.B. & Tarp, F., 2003. Financial liberalization, financial development and economic growth in LDCs. Journal of International Development, 15(2), pp.189–209.
Ashagrie, K., 1993. Statistics on child labour : a brief report. Bulletin of Labour Statistics, 3, pp.11–28.
Beck, T., Levine, R. & Loayza, N., 2000. Finance and the sources of growth. Journal of
Financial Economics, 58(1–2), pp.261–300.
Beck, T., Lin, C. & Ma, Y., 2014. Why do firms evade taxes? The role of information sharing and financial sector outreach. The Journal of Finance, 69(2), pp.763–817.
Beegle, K., Dehejia, R.H. & Gatti, R., 2006. Child labor and agricultural shocks. Journal of
Development Economics, 81(1), pp.80–96.
Berdiev, A.N. & Saunoris, J.W., 2016. Financial development and the shadow economy: A panel VAR analysis. Economic Modelling, 57, pp.197–207.
Bernal-Verdugo, L.E., Furceri, D. & Guillaume, D., 2015. A reply to “banking crises, labor reforms, and unemployment: A comment.” Journal of Comparative Economics, 43(4), pp.1142–1147.
Bettin, G. & Zazzaro, A., 2012. Remittances and Financial Development: Substitutes or Complements in Economic Growth? Bulletin of Economic Research, 64(4), pp.509– 536.
Bittencourt, M., Gupta, R. & Stander, L., 2014. Tax evasion, financial development and inflation: Theory and empirical evidence. Journal of Banking & Finance, 41, pp.194– 208.
Blundell, R., Pistaferri, L. & Saporta-Eksten, I., 2016. Consumption Inequality and Family Labor Supply. American Economic Review, 106(2), pp.387–435.
Bose, N., Capasso, S. & Andreas Wurm, M., 2012. The impact of banking development on the size of shadow economies. Journal of Economic Studies, 39(6), pp.620–638.
32 Boukhatem, J., 2016. Assessing the Direct Effect of Financial Development on Poverty Reduction in a Panel of Low-and Middle-Income Countries. Research in International
Business and Finance, 37, pp.214–230.
Breusch, T., 2016. Estimating the Underground Economy using MIMIC Models. Journal of
Tax Administration, 2(1). Available at: http://JoTA.website/article/view/70 [Accessed
August 30, 2016].
Brevoort, K.P. & Hannan, T.H., 2007. Commercial Lending and Distance: Evidence from Community Reinvestment Act Data. Journal of Money, Credit, and Banking, 38(8), pp.1991–2012.
Brown, R.P.C., Carmignani, F. & Fayad, G., 2013. Migrants’ Remittances and Financial Development: Macro- and Micro-Level Evidence of a Perverse Relationship. The World
Economy, 36(5), pp.636–660.
Campello, M., Graham, J.R. & Harvey, C.R., 2010. The real effects of financial constraints: Evidence from a financial crisis. Journal of Financial Economics, 97(3), pp.470–487. Castillo, P.J., 2009. Unemployment Threat of the Financial Crisis. Asia-Pacific Social Science
Review, 9(1), pp.41–46.
Čihák, M. et al., 2012. Benchmarking financial systems around the world. World Bank Policy
Research Working Paper, (6175). Available at:
http://papers.ssrn.com/sol3/papers.cfm?abstract_id=2152254 [Accessed March 16, 2016].
Claessens, S. & Perotti, E., 2007. Finance and inequality: Channels and evidence. Journal of
Comparative Economics, 35(4), pp.748–773.
Combes, J.-L. et al., 2014. Remittances and Working Poverty. The Journal of Development
Studies, 50(10), pp.1348–1361.
Dabla-Norris, E., Gradstein, M. & Inchauste, G., 2008. What causes firms to hide output? The determinants of informality. Journal of Development Economics, 85(1–2), pp.1–27. De Gregorio, J., 1996. Borrowing constraints, human capital accumulation, and growth.
Journal of Monetary Economics, 37(1), pp.49–71.
Degryse, H. & Ongena, S., 2005. Distance, Lending Relationships, and Competition. The
Journal of Finance, 60(1), pp.231–266.
Dehejia, R.H. & Gatti, R., 2005. Child Labor: The Role of Financial Development and Income Variability across Countries. Economic Development and Cultural Change, 53(4), pp.913–932.
Dollar, D. & Kraay, A., 2002. Growth is Good for the Poor. Journal of Economic Growth, 7(3), pp.195–225.
Ebeke, C.H., 2012. The power of remittances on the international prevalence of child labor.
33 Elgin, C., Oztunali, O. & others, 2012. Shadow economies around the world: model based estimates. Bogazici University Department of Economics Working Papers, 5, pp.1–48. Elgin, C. & Uras, B.R., 2012. Is informality a barrier to financial development? SERIEs, 4(3),
pp.309–331.
Feige, E.L., 2016. Reflections on the Meaning and Measurement of Unobserved Economies: What do we really know about the “Shadow Economy”? Journal of Tax Administration, 2(1). Available at: http://JoTA.website/article/view/69 [Accessed August 23, 2016]. Freund, C. & Spatafora, N., 2008. Remittances, transaction costs, and informality. Journal of
Development Economics, 86(2), pp.356–366.
Gatti, D., Rault, C. & Vaubourg, A.-G., 2012. Unemployment and finance: how do financial and labour market factors interact? Oxford Economic Papers, 64(3), pp.464–489. Gobbi, G. & Zizza, R., 2007. Does the Underground Economy Hold Back Financial
Deepening? Evidence from the Italian Credit Market. Available at: http://papers.ssrn.com/abstract=1075182 [Accessed July 18, 2016].
Hall, R.E., 2010. Why Does the Economy Fall to Pieces after a Financial Crisis? The Journal
of Economic Perspectives, 24(4), pp.3–20.
Han, C.-K., 2009. Unemployment, Financial Hardship, and Savings in Individual Development Accounts. Journal of Poverty, 13(1), pp.74–95.
Hassan, M. & Schneider, F., 2016. Size and Development of the Shadow Economies of 157 Countries Worldwide: Updated and New Measures from 1999 to 2013. IZA Discussion
Papers. Available at: https://ideas.repec.org/p/iza/izadps/dp10281.html [Accessed
December 18, 2016].
Hazarika, G. & Sarangi, S., 2008. Household Access to Microcredit and Child Work in Rural Malawi. World Development, 36(5), pp.843–859.
ILO ed., 2014. Developing with jobs 2. ed. rev., Geneva: ILO.
ILO, 2011. Statistical update on employment in the informal economy. Available at: http://www.ilo.org/global/statistics-and-databases/WCMS_157467/lang--en/index.htm [Accessed August 30, 2016].
ILO /IPEC, 2013. Making progress against child labour: global estimates and trends
2000-2012, Geneva: ILO.
International Labour Organisation ed., 2016a. Transforming jobs to end poverty, Geneva, Switzerland: International Labour Office.
International Labour Organisation, 2016b. World employment social outlook: trends 2016, Available at: http://public.eblib.com/choice/PublicFullRecord.aspx?p=4661505 [Accessed December 25, 2016].
International Monetary Fund ed., 2016. Subdued demand: symptoms and remedies, Washington, DC: International Monetary Fund.
34 Jayachandran, S., 2006. Selling labor low: Wage responses to productivity shocks in developing
countries. Journal of political Economy, 114(3), pp.538–575.
Jeanneney, S.G. & Kpodar, K., 2011. Financial Development and Poverty Reduction: Can There be a Benefit without a Cost? Journal of Development Studies, 47(1), pp.143–163. Jütting, J. & Laiglesia, J.R. de, 2009. Is informal normal?: towards more and better jobs in
developing countries Organisation for Economic Co-operation and Development &
SourceOECD (Online service), eds., Paris: Development Centre of the Organisation for Economic Co-operation and Development.
King, R.G. & Levine, R., 1993. Finance and Growth: Schumpeter Might be Right. The
Quarterly Journal of Economics, 108(3), pp.717–737.
King, R.G. & Levine, R., 1993. Finance, entrepreneurship and growth. Journal of Monetary
Economics, 32(3), pp.513–542.
La Porta, R. & Shleifer, A., 2014. Informality and development. The Journal of Economic
Perspectives, 28(3), pp.109–126.
Levine, R., Loayza, N. & Beck, T., 2000. Financial intermediation and growth: Causality and causes. Journal of Monetary Economics, 46(1), pp.31–77.
Menon, N., 2010. Investment credit and child labour. Applied Economics, 42(12), pp.1461– 1479.
Nickell, S. & Nicolitsas, D., 1999. How does financial pressure affect firms? European
Economic Review, 43(8), pp.1435–1456.
Nickell, S. & Wadhwani, S., 1991. Employment Determination in British Industry: Investigations Using Micro-Data. The Review of Economic Studies, 58(5), pp.955–969. OECD, 2002. Measuring the Non-Observed Economy - A Handbook - OECD. Available at:
http://www.oecd.org/std/measuringthenon-observedeconomy-ahandbook.htm [Accessed August 30, 2016].
Pagano, M. et al., 2012. Finance and employment. Economic Policy, 27(69), pp.5–55.
Pindyck, R.S. & Solimano, A., 1993. Economic instability and aggregate investment. In NBER
Macroeconomics Annual 1993, Volume 8. MIT Press, pp. 259–318. Available at:
http://www.nber.org/chapters/c11002.pdf [Accessed December 28, 2016].
Rajan, R.G. & Zingales, L., 2003. The great reversals: the politics of financial development in the twentieth century. Journal of Financial Economics, 69(1), pp.5–50.
Ranjan, P., 2001. Credit constraints and the phenomenon of child labor. Journal of Development
Economics, 64(1), pp.81–102.
Ravallion, M. & Datt, G., 2002. Why has economic growth been more pro-poor in some states of India than others? Journal of Development Economics, 68(2), pp.381–400.
35 Restrepo-Echavarria, P., 2015. Measuring Underground Economy Can Be Done, but It Is Difficult. The Regional Economist, (Jan). Available at: http://econpapers.repec.org/article/fipfedlre/00062.htm [Accessed August 30, 2016]. Rose, E., 2001. Ex ante and ex post labor supply response to risk in a low-income area. Journal
of Development Economics, 64(2), pp.371–388.
Schneider, F., 2005. Shadow economies around the world: what do we really know? European
Journal of Political Economy, 21(3), pp.598–642.
Schneider, F., Buehn, A. & Montenegro, C.E., 2010. New Estimates for the Shadow Economies all over the World. International Economic Journal, 24(4), pp.443–461.
Schneider, F. & Enste, D.H., 2000. Shadow Economies: Size, Causes, and Consequences.
Journal of Economic Literature, 38(1), pp.77–114.
Shabbir, G. et al., 2012. Contribution of Financial Sector Development in Reducing Unemployment in Pakistan. International Journal of Economics and Finance, 4(1), p.260.
Sharpe, S.A., 1994. Financial Market Imperfections, Firm Leverage, and the Cyclicality of Employment. The American Economic Review, 84(4), pp.1060–1074.
Somers, C. & Weil, P., 2004. The Macroeconomics of Labor and Credit Market Imperfections.
The American Economic Review, 94(4), pp.944–963.
Thomas, J., 1999. Quantifying the Black Economy: `Measurement without Theory’ Yet Again?
The Economic Journal, 109(456), pp.F381–F389.
Tuğcu, C.T. & Aslan, A., 2012. Financial Development and Employment: A VAR Analysis for the Case of Turkey. In Clute Institute International Conference. pp. 561–565.
World Trade Organization, 2016. Trade in 2016 to grow at slowest pace since the financial
crisis, Geneva, Switzerland: WTO. Available at:
https://www.wto.org/english/news_e/pres16_e/pr779_e.pdf [Accessed December 27, 2016].
Wydick, B., 1999. The Effect of Microenterprise Lending on Child Schooling in Guatemala.
37
Chapter I. Revisiting the Relationship between
Financial Development and Child Labor in
Developing Countries: Do Inequality and
39
Introduction
Despite many efforts from governments and the international community, child labor is still prevalent in many developing countries. According to the last estimates of the International Labor Organization (ILO /IPEC 2013), about 11% of the world’s child population between the ages of 5 and 17 years old were concerned by child labor in 2012, accounting for 168 million of children. Regarding its negative consequences on children human capital development and their prospects for adulthood, this topic is at the core of development studies. So, a wide range of articles have investigated the determinants of child labor both theoretically and empirically and it comes out that poverty is likely the main driving factor. Nevertheless, this finding is challenged by recent micro-studies. For instance landholding, a strong predictor of income level in developing countries, has been found to be associated with more child labor15 with children working on farms operated by their families as in Ghana and Pakistan (Bhalotra & Heady 2003) or in Burkina-Faso (Dumas 2006). For Dumas (2013), this “wealth paradox” could be explained by labor and credit market imperfections, suggesting the importance of other factors beyond growth and absolute poverty.
This article revisits the link between credit markets imperfections and child labor for a panel of developing countries from 1960 to 2004. Major empirical studies on this topic at macroeconomic level are those of (Dehejia & Gatti 2005; Ebeke 2012). They find that child labor is negatively associated to financial development measured by private credit ratio. In this formulation, access to credit prevent households to use child labor in order to smooth their consumption in case of shocks. The main limit of these studies is that they do not take into account time dimension in the data. For instance, the study by Ebeke (2012) focuses only on the year 2000 due to data availability for migration. While, Dehejia and Gatti (2005), in their identification strategy, use as instruments for financial development, the rate of mortality among colonial settlers and the origin of legal systems which do not vary across time. Moreover their negative finding is questioned by some microeconomic studies (Wydick 1999; Menon 2010; Hazarika & Sarangi 2008). These studies emphasized that a better access to credit can increase child labor, especially if parents invest in
15 This is the “wealth paradox” meaning that children from rich families are engaged in work in their family business
40 productive activities like expanding the family business or farm. This can raise the returns from child labor especially if labor markets are imperfect due to shortages in hiring or to moral hazard. In this case, parents are more confident in the workforce of their own children as the opportunity cost of education has increased.
In addition, a recent literature has highlighted a relationship between financial development and inequality which has been neglected by previous studies looking at the impact of access to financial services on child labor. Indeed, we argue that child labor is more prevalent in presence of inequalities as demonstrated by (Tanaka 2003; D’Alessandro & Fioroni 2016; Ranjan 2001)16. In this case, financial development which increases (decreases) inequality can also lead to more (less) child labor indirectly.
The literature on the relationship between financial development and inequality could be divided in two strands: linear vs. non-linear approaches. On the one hand, the advocates of the linear hypothesis argue that financial development can increase or reduce inequalities depending on who benefit from better access to financial services. If financial development benefits the rich because they can afford for collateral and are more able to repay a loan, it is the inequality widening hypothesis where the poor continue to be excluded (Rajan & Zingales 2003). On the contrary, it is the inequality narrowing hypothesis with better access to credit or insurance for the poor (Beck, Demirgüç-Kunt, et al. 2007; Mookerjee & Kalipioni 2010). In the other and, some authors highlight a non-linear relationship between inequality and financial development. Greenwood and Jovanovic (1990) refer this as an inverted U relationship between the two variables. This suggests that below a critical point of financial development, the poor are hurt and this exacerbates inequality as demonstrated by Kim and Lin (2011). But, Tan and Law (2012) find an U-shape relationship between inequality and financial development for a panel of 35 developing countries, suggesting that even if at earlier stages of development, poor can benefit from better developed credit markets. Law and al. (2014) also emphasizes that this non-linear relationship is correlated with the level of institutional quality. They find that financial development decreases inequality only beyond a certain level of institutional quality.