DESIGN AND OPTIMIZATION OF A MULTI-PARTICLE ACCELERATOR BEAM TRANSPORT AND DELIVERY
SYSTEM FOR MATERIAL IRRADIATION IN NUCLEAR AND FUSION SCIENCE
By
Tyler Christopher Sordelet
B.S., Mechanical Engineering (2010)
United States Naval Academy
ARCHNES
MJASSACHUS ETS INSTITUTEOF TECHNOLCGY
SRES
SUBMITTED TO THE DEPARTMENT OF NUCLEAR SCIENCE AND ENGINEERING
IN PARTIAL FULFILLMENT OF THE REQUIREMENTS FOR THE DEGREE OF
MASTER'S OF SCIENCE IN NUCLEAR SCIENCE AND ENGINEERING ATTHE
MASSACHUSETTS INSTITUTE OF TECHNOLOGY
DECEMBER 2011
@ 2011 Massachusetts Institute of Technology
All rights reserved
It-if
Signature of AuthorTyler Christopher Sordelet Department of Nuclear Science and Engineering December 15, 2011
Ronald Ballinger, Sc.D. Professor, Nuclear and Material S ~ ce and Engineering Thesis Supervisor
Dennis Whyte, Ph.D. Professor, Nuclear Science and Engineering Thesis Reader
I
Mujid S. Kazimi, Ph.D. T PCO P ofessor of Nuclear Engineering Chair, Departm mmittee on Graduate Students Certified by
Certified by
Design and Optimization of a Multi-Particle Accelerator Beam Transport and Delivery System for Material Irradiation in Nuclear and Fusion Science
By
Tyler Christopher Sordelet
Submitted to the Department of Nuclear Science and Engineering On December 15, 2011, in partial fulfillment of the
Requirements for the degree of
Master's of Science in Nuclear Science and Engineering
Abstract
A beam delivery and transport system were designed for the use in MIT Materials Test Facility (M2TF). The purpose of this beam delivery system was to design a 36 MeV Proton Cyclotron for DPA accumulation and a 100 MeV Helium Cyclotron for irradiation failure and volumetric helium
accumulation simulation. The purpose of the beam transport system was to incorporate the two cyclotrons into the beam transport system and transport their beams to the target chamber, the location of the target sample.
The cyclotrons were designed using Opera-3D and Acfields. The beam transport system was designed using TRANSPORT. The shielding analysis for the entire facility was designed using SolidWorks and calculated with MCNP/X The design specification of M2TF with respect to beam energy, current density, and control were achieved based on these design tools and previously developed analytic methods.
The design process for the cyclotrons resulted in a 4.3T lsochronous Proton Cyclotron and 3.9T Isochronous Helium Cyclotron. A beam transport system connected the cyclotrons to the target chamber with three doublet quadrupoles and one dipole bending magnet The shielding calculation proved the total effect dose rate in rem/year for the final design facility was safe for operational workers.
Thesis Supervisor: Ronald Ballinger
Title: Professor, Nuclear and Material Science and Engineering
Thesis Reader: Dennis Whyte
Acknowledgments
I would like to thank my thesis advisor, Professor Ballinger, for his academic support, guidance
and feedback I could not have asked for a better advisor. Having been from the military himself, Professor Ballinger understood the United States Navy requirements and deadlines and worked hard to make sure I was on track and well prepared to graduate on time. His involvement with the science community and enthusiasm in creating MIT Materials Test Facility were of great help when we hit a "fence." Without my advisor, it would have been a rough two years at MIT.
I would like to truly thank Professor Dennis Whyte for being my thesis reader on such a short
notice. His insights and timely feedback improved my thesis quality and allowed me to still
graduate on time. Thank you for the invaluable discussions on proton and neutron simulations and important information about fusion materials and their environment
It is difficult to express the significance of Dr. Timothy Antaya's contribution to my thesis. I am grateful to have shared a building with a leading cyclotron expert and proven engineer. He is always open to discussion, guidance, and questions on any topic. Without his expertise, inspiration, and feedback my thesis would not have existed.
I am indebted to many of my professors and classmates who supported me through the
important details of my thesis. I would like to thank Harold Bernard for his help in python and heat transfer calculations, Professor Forget and Josh Richard for tutoring lessons in MCNP, and Robert Block for allowing me to use his hybrid cyclotron and beam analysis codes.
I owe it to my fiancee Kelli Reed and all my friends and family for the constant support that I
have received over the past few years; I could not have done it alone. Finally, I would like to thank that United States Navy for its financial support and for providing me the opportunity to earn a masters degree at MIT before starting my wonderful and adventurous journey as an officer in the submarine force, "Go Navy!"
Contents
Abstract ... .. ---...- ... -. 3
Acknow ledgm ents...---... ---... 5
List of Figures ...----... ---... 13
List of Tables ...--- . . ---... 19
1 Introduction...--... ---... 21
1.1 M otivation...--- . - --... 21
1.2 Background ... ...---.. 24
1.3 M ission Statem ent ... 25
1.4 Thesis Objective ... 25
1.5 Facility Characteristics ... 26
1.6 Thesis Outline... 27
2 Irradiation Overview...--...-... .. 29
2.1 Achieving High DPA Rates... 29
2.2 Proton vs. Neutron Damage ... 35
2.3 Helium Im plantation Technique and Rates ... 39
2.4 Heavy Ions Sim ulation of Radiation Damage... 42
3 Cyclotrons...---...-- - - - . 45
3.1 Cyclotron Background ... 46
3.2 Cyclotron Selection ... 48
3.2.1 Classical Cyclotron ... 48
3.3 Addressing the Concern of Dam age Cascade Timescales... 53
3.4 Cyclotron Design and Analysis ... 56
3.4.1 O peration Lim its and Feasibility Table... 56
3.4.2 Basic Scaling w ith Poisson Superfish ... 57
3.4.2.1 Poisson Program ... 57
3.4.2.2 Boundary Conditions Applied in Poisson ... 58
3.4.2.3 Calculations for Inputs ... 59
3.4.2.4 Optim ization of Poisson Procedure ... 61
3.4.2.5 2D Poisson Results ... 61
3.4.2.6 Discussion of Results... 65
3.4.3 Code Used for Com prehensive Design ... 65
3.4.3.1 Acfields... 65
3.4.3.2 Opera 3D ... 66
3.4.4 Proton Cyclotron... 69
3.4.4.1 Design Issues ... 69
3.4.4.2 Coil Design... 75
3.4.4.3 Design Lim itations... 78
3.4.4.4 Inner Coil Design ... 79
3.4.5 Helium Cyclotron ... 83
3.4.5.1 Design Progression... 83
3.4.5.2 Design and Design Lim itations... 83
3.4.5.3 Inner Coil Design...87
3.5 Final Proposed Design ... 88
3.5.1 Proton Cc...89Desi ... 3.5.2 Helium Cyclotron...90
3.6 Cost Analysis.. ... 91
3.6.1 Cost ofl ron... 91
3.6.2 Conductor/Coil Cost ... ... 91
4.3 The MCNPX Program ... ... ... .... 98
4.3.1 Design Modeling and Representation ... 98
4.3.2 Design Process ... ... 101
4.4 M CN PX Shielding Results ... 103
4.4.1 Neutron and Photon Spectrum... 103
4.4.2 Dose Rate Inside the Chamber ... 106
4.4.3 Dose Rate Outside the Chamber ... 107
4.4.4 Conclusion...-....--.. ---... 109
4.5 Suggested Design Improvements ... 109
5 Beam Transport ...-...-...-...--..---... 111
5.1 Arranging the Cyclotron with the Beam Transport System... 111
5.2 Initial Beam Properties ... 112
5.3 Beam Focusing and Steering Components ... 114
5.3.1 Dipole Magnet ... .... 115
5.3.2 Quadrupole...--...-...---...115
5.4 Beam Transport Design... 116
5.4.1 TRANSPO RT...- -- -. ---... 116
5.4.2 Design Process ... 117
5.5 Beam Transport Final Design ... 118
5.5.1 Proton Beam ...--...-..---... 119
5.5.2 Helium Beam ... 120
5.6 Final Design Layout ... 121
5.7 Feasibility of Beam Components ... 121
5.7.1 Dipole Bending Magnet (B1)... 122
5.7.2 Quad rupole (Q1)... 124
6.2 Future work...126
6.2.1 Activation of M aterial Study...126
6.2.2 Beam Extraction... 126
6.2.3 Energy Degrader Option... 126
6.2.4 M ore Accurate Shielding Calculation... 127
7 Bibliography ...---. . ---.. ---... 129
Appendix A: Acfields Code---... ... ... ... 133
A. Proton Cyclotron...133
A.2 Helium Cyclotron ... 134
Appendix B: Opera Instructions... 137
Appendix C: M atab Code for Opera Data ... 139
C.1 Inner Coil Field Contribution... 139
C.2 Com parison of M ultiple Opera-3D Designs ... 140
Appendix D: Layout Draw ings ... 141
D.1 Proton Cyclotron ... 141
D.2 Helium Cyclotron...144
Appendix E: MCNPX Descriptions and Code...147
E.1 Descriptions of M CNPX Inputs ... 147
E.2 Proton Cyclotron Shielding Code ... 152
Appendix G: Poisson Code ... 163
G.1 Dipole...--...---...- -163
List of Figures
Figure 1-1: Temperature vs. displacement damage for different reactors and fusion systems. Figure adapted from [Zinkle, 2007]...22
Figure 1-2: Helium/DPA ratios for nuclear reactors and fusion systems. Figure adapted from
[W hyte, 2 0 10]...2 3 Figure 2-1: Illustration of BCA interaction of atoms. Figure adapted from [Robinson & Torrens,
19 74].. . . . ... 3 0
Figure 2-2: SRIM DPA calculation for Protons on Iron. Proton energies of 10, 20,30,40, and 50 MeV were solved in SRIM. Two runs were completed: displacement energy of 25 eV (green) and 40 eV (red). A line of best fit was drawn between the points...33
Figure 2-3: Equation (2.1) DPA calculation with displacement energies of 20 (blue), 25 (green), and 4 0 (red) eV ... 3 3
Figure 2-4: Damage profile comparison of protons, neutrons, and heavy ions. The y-axis is the DPA per incident particle. The x-axis is the distance into the solid in micrometers. The red
circles note the particles Bragg Peak. Figure adapted from [Kulcinsji, Brimhall, & K issinger, 1972]...36
Figure 2-5: Uniform interaction of 36 MeV Proton Beam on an Iron sample with 1 mm marked line. Note location of Bragg Peak outside of sample. Figure generated using SRIM ... 36 Figure 2-6: Recoil Spectrum for 16.4 MeV protons and 14.1 MeV neutrons in Nb. The recoil
spectrums of the two particles are similar at higher energies but vary at lower energies. Figure adapted from [Logan, 1973]... 39
Figure 2-7: Appm of volumetric helium implantation per hour (y-axis) for Graphite, SS, Inconel 600 and Tungsten with respect to target thickness in mm (x-axis)...41
Figure 2-8: Appm of volumetric helium implantation per day (y-axis) for Graphite, SS, Inconel 600 and Tungsten with respect to target thickness in mm (x-axis)...41
Figure 2-9: Damage cascade from 1 MeV electrons, 1 MeV protons, 1 MeV heavy ions, and 1 MeV neutrons. Notice that heavy ions better match the damage spectrum created from neutrons. Figure Adapted from [Was G. S., 2007]...43
Figure 2-10: Penetration depth of microns for heavy ions Ni, Al and C. Notice the non-homogenous damage profile over their -2 micrometer penetration. Figure Adapted from [Sickafus,
Kotom in, & Uberuaga, 2007]...44
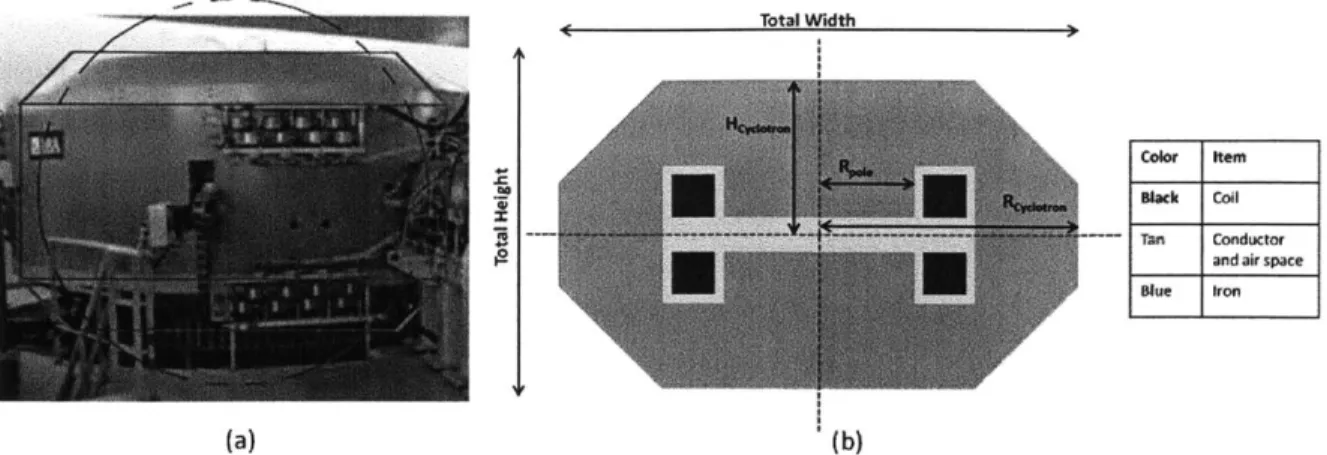
Figure 3-2: Actual IBA C230 Proton Cyclotron (a) versus model rendition (b). The orientation is as follows: horizontal:radial, vertical:axial, and azimuthal:rotation angle around vertical axis. Figure adapted from [Antaya, 2010]... 47
Figure 3-3: Cut-away view of the cyclotron. This quarter was modeled in Poisson Superfish. The orientation is as follows: horizontal:radial, vertical:axial, and azimuthal:rotation angle aroun d vertical axis...4 7
Figure 3-4: Illustration of the regions of the cyclotron. The orientation is as follows:
horizontal:radial, vertical:axial, and azimuthal:rotation angle around vertical axis...48 Figure 3-5: Isochronous design with hills and valleys to create an axial restoring force F2.
Representation of polodial variance with hills and valleys, (b). Figure adapted from [Strijckm ans, 200 1]...52
Figure 3-6: Mean time between Displacements for Graphite, SS and Tungsten with overlay of important timescales of damage related events ... 56
Figure 3-7: Illustration of the Neumann and Poisson boundary conditions for magnetic fields applied in Poisson Superfish...58
Figure 3-8: Stacking region (black square region) modeled in Poisson and spiral pole tip design from K500 cyclotron. Above figure adapted from [MSU, 2011]...59 Figure 3-9: Proton 3T Poisson result Horizontal axis radius from 0-45 cm, vertical axis height from
0-30 cm. Red arrows length: strength and direction of B field (3T at origin)...62
Figure 3-10: Proton 5T Poisson result Horizontal axis radius from 0-35 cm, vertical axis height from 0-30 cm. Red arrows length: strength and direction of B field (5T at origin)...62 Figure 3-11: Proton 7T Poisson result Horizontal axis radius from 0-25 cm, vertical axis height
from 0-25 cm. Red arrows length: strength and direction of B field (7T at origin)...63 Figure 3-12: Helium 3T Poisson result Horizontal axis radius from 0-100 cm, vertical axis height
from 0-60 cm. Red arrows length: strength and direction of B field (3T at origin)...63 Figure 3-13: Helium 5T Poisson result Horizontal axis radius from 0-60 cm, vertical axis height
from 0-60 cm. Red arrows length: strength and direction of B field (5T at origin)...64 Figure 3-14: Helium 7T Poisson result Horizontal axis radius from 0-50 cm, vertical axis height
from 0-35 cm. Red arrows length: strength and direction of B field (7T at origin)...64 Figure 3-15: Possible example of Opera-3D grouping error. Zones 1-4 will converge correctly and
satisfy Opera-3D iteration program causing it to continue to another sector of geometry, diminishing zone 5's geometric importance...69
Figure 3-17: Result the addition of steps 1-3. Each color represents the changes conducted to match the isochronous field (black line). Red: Coil movement, Blue: Current reduction, Green: Coil movement and current reduction. The horizontal axis is radius in cm and the vertical axis is m agnetic field in Tesla ... 71
Figure 3-18: Sector design (a), flutter (b), and representation of vz and vr (c) for the 5T Proton Cyclotron. Figure generated with Acfields ... 72
Figure 3-19: Spiral design (a), flutter (b), and representation of vz and yr (c) for the 5T Proton Cyclotron. Figure generated with Acfields ... 72
Figure 3-20: Illustration of Delta B with respect to radius "r". B gradient increases with magnetic field. The horizontal axis is radius in cm and the vertical axis is magnetic field in Tesla.
... 7 3
Figure 3-21: Illustration of yoke field contribution for 7T Proton Cyclotron. The horizontal axis is radius in cm and the vertical axis is magnetic field in Tesla. Figure generated with A cfields...7 3
Figure 3-22: Spiral design attempt (a), isochronous field (b) and value of vz and yr (c) for the 7T Proton Cyclotron. Figure generated with Acfields... 74
Figure 3-23: Spiral design attempt (not shown) with isochronous field (a), flutter (b), and value of vz and r (c) for the 6T Proton Cyclotron. Figure generated with Acfields...74 Figure 3-24: Changes made to coil vertical spacing with respect to height (a) and coil shape (b) with
respect to height and radius (width) ... 75
Figure 3-25: An original isochronous field (a) changed due to increased coil spacing by a factor of 2
(b). The magnetic field decreases with respect to radius for increasing spacing. The
horizontal axis is radius in cm and the vertical axis is magnetic field in Gauss
(10,000 G = 1T )...75
Figure 3-26: An original isochronous field (a) changed due coil shaping of a rectangle of twice height and one width (b). Result is that both AB and radius have increased by 1500 G and 4 cm respectively. The horizontal axis is radius in cm and the vertical axis is
m agnetic field in Gauss (10,000G=1T)... 76
Figure 3-27: Spiral pole Design (a), isochronous field (b), flutter calculations (c) and value of vz and
vr (d) for the Proton 4.3T Cyclotron. The dotted red lines plotted in (a) signify the cuts
on the poles. Figure generated with Acfields... 77
Figure 3-28: SolidWorks design for the Proton 4.3T Cyclotron sector model (a) and spiral model (b).
... 7 8
Figure 3-29: Spiral pole design (a), isochronous field (b), flutter calculation (c), value of vz and r
(d) and zoom of value of vz (e) for the Proton 5.5T Cyclotron. The dotted red lines
Figure 3-31: Non-superconducting inner coil contribution reaching 145 Gauss for the Proton 4.3T Cyclotron. Figure generated with Poisson... 81 Figure 3-32: Superconducting inner coil result reaching 2600 Gauss for the Proton 4.3T Cyclotron.
Figure generated w ith Poisson...82
Figure 3-33: Superconducting inner coil result (blue line) superimposed onto the Proton 4.3T cyclotron isochronous field (red line) with the isochronous field equation (black line).
... 8 2
Figure 3-34: Spiral pole design (a), isochronous field (b), flutter calculation (c), value of vz and yr
(d) and zoom of value of vz (e) for the Helium 3.2T Cyclotron. The dotted red lines
plotted in (a) signify the cuts on the poles. Figure generated with Acfields...84
Figure 3-35: Spiral pole design (a), isochronous field (b), flutter calculation (c), value of vz and yr
(d) and zoom of value of vz (e) for the Helium 5.4T Cyclotron. The design does not
meet minimum flutter requirements. The dotted red lines plotted in (a) signify the cuts on the poles. Figure generated with Acfields. ... 85
Figure 3-36: Spiral pole design (a), isochronous field (b), flutter calculation (c), value of vz and vr
(d) and zoom of value of vz (e) for the Helium 3.9T Cyclotron. The dotted red lines
plotted in (a) signify the cuts on the poles. Figure generated with Acfields...86
Figure 3-37: Helium 3.9T Cyclotron cross-section view of SolidWorks design. Sector design (a) and spiral design (b)...8 6
Figure 3-38: Superconducting inner coil result (blue line) superimposed onto the Helium 3.9T Cyclotron isochronous field (red line) with the isochronous field equation (black line).
... 8 7
Figure 3-39: Final Design of Proton 4.3T Cyclotron. The dimensions are diameter of 84 cm and total height of 46 cm ... 89
Figure 3-40: Final sector pole design (a), spiral pole design (b) and coil (c) of Proton 4.3T Cyclotron.
... 8 9
Figure 3-41: Final Design of 3.9T Helium Cyclotron. The dimensions are diameter of 180 cm and total height of 100 cm ... 90
Figure 3-42: Final sector pole design (a), spiral pole design (b) and coil (c) of Helium 3.9T
Cy clotron ... 9 0
Figure 4-1: Corner room in MIT building NW21 with scale in feet The second floor is not shown in figure above. Figure adapted from MIT floor plans [MIT]...97
Figure 4-4: Particle simulation of isotropic 100 MeV Helium disc beam source. Each dot represents
the location of a collision, the color represents it energy at the time of collision...99
Figure 4-5: MCNP 3D model of a cyclotron in its chamber. Figure generated with MCNPX VisEd..100
Figure 4-6: Target chamber MCNPX model (a) and proposed design (b)...101
Figure 4-7: Proton cyclotron spectrum ... 104
Figure 4-8: Helium cyclotron spectrum ... 104
Figure 4-9: Target chamber spectrum with 36 MeV protons on an iron sample...105
Figure 4-10: Target chamber spectrum with 100 MeV helium on an iron sample...105
Figure 4-11: Target chamber spectrum during simultaneous operation of both beams on an iron sam p le...1 0 6 Figure 5-1: Schematic of the starting beam transport system. The helium cyclotron is located in the top left quadrant whereas the proton cyclotron is located in the bottom left The target chamber is located in the right quadrant The dipole location is the intersection of the tw o beam s...112
Figure 5-2: Beam pipe specifications and selected operating space...113
Figure 5-3: Illustration of maximum drift space calculation with length L and divergence Ax' or Ay'. ... 1 1 4 Figure 5-4: Beam Dynamics of dipole and quadrupole with a realistic picture to the left, model in the center, and purpose on the right Figure adapted from [Streun, 2007]...115
Figure 5-5: Illustration of dipole magnet where
P
is the edge angle, R1 and R2 are convex curvatures, and p the radius. Figure adapted from [Nolen, 2003]...116Figure 5-6: Quadrupole magnets with aperture radius 'a' (a), origin "o," and magnetic field representation (b). Figure adapted from [TRANSPORT, 1972]...116
Figure 5-7: 36 MeV Proton beam transport result Beam envelope range of 2-19 mm. Total length of 4.8 m. The top region illustrates the vertical component of the beam, whereas the bottom illustrates the horizontal component Each figure also illustrates the placement of each element Drifts, quadrupoles and dipoles are signified by the letter "D", "Q", and "B" with its consecutive number. Figure generated from TRANSPORT...119
Figure 5-8: 100 MeV Helium beam transport result Beam envelope range of 2-19 mm. Total length of 5.8 m. The top region illustrates the vertical component of the beam, whereas the bottom illustrates the horizontal component. Each figure also illustrates the placement of each element Drifts, quadrupoles and dipoles are signified by the letter "D",
"Q",
and "B" with its consecutive number. Figure generated from TRANSPORT...120Figure 5-9: Final beam transport layout with integrated cyclotrons (helium in upper left quadrant and proton in lower left quadrant). Dimensions are 12 m by 12 m with 1 m thick con crete sh ieldin g...12 2
Figure 5-10: Dipole bending magnetic "B1" feasibility calculation with Poisson. Figure (a) is the dimensions of the dipole bending magnet with vertical and horizontal axis in cm. The length of the red arrows denotes its strength and direction. Figure (b) is a magnetic field with respect to radius curve peaking at 2515 G at the center of the dipole, radius o f 4 8 cm ... 1 2 3 Figure 5-11: Poisson Generation of magnetic field for quadrupole "Qi". The length of the red arrows
List of Tables
Table 1-1: Required accelerator specifications for M2TF ... 26
Table 1-2: Required M2TF design parameters...26
Table 2-1: Symbol explanation of Was' D PA Equation (2.2)... 32
Table 2-2: ASTM E521-96 displacement energies for common materials. Notice the variance between the minimum and average displacement energy in iron. Table adapted from [A ST M E52 1-96, 2000]...34
Table 3-1: Timescale for damage related events. Figure adapted from [Was G. S., 2007]...55
Table 3-2: Comparison of current cyclotron magnetic field and energy... 57
Table 3-3: Proton cyclotron basic sizing calculations... 60
Table 3-4: Helium cyclotron basic sizing calculations...60
Table 3-5: Summary of Analysis Conducted by Opera-3D Programs...67
Table 3-6: Selected values of interest for radius of extraction for an Isochronous 36 MeV Proton Cy clotron ... 69
Table 3-7: Iron ring dimension for 4.3T Proton Cyclotron ... 80
Table 3-8: Dimension of Superconducting inner coil... 81
Table 3-9: Number of Amp-turns for the inner coil of proton cyclotron... 83
Table 3-10: Selected tabulated values for Helium Cyclotron isochronous field...83
Table 3-11: Dimension of 3.9T Helium Cyclotron superconducting inner coil...87
Table 3-12: Number of Amp-turns for inner coil of Helium Cyclotron ... 87
Table 3-13: Summary of Cyclotron Design...88
Table 3-14: Cost of manufactured iron...91
Table 3-15: Conductor cost...93
Table 4-2: Dose rate inside cyclotron chambers with 95% extraction efficiency...106
Table 4-3: Dose rate inside target chamber with full beam stop... 107
Table 4-4: Dose rate shielded from cyclotron chambers with 95% extraction efficiency... 107
Table 4-5: Dose Rate shielded for Target Chamber with full beam stop... 108
Table 4-6: Regulatory standards and guidance [Mass.gov, 1998]...108
Table 4-7: Total contribution in mrem/yr for each chamber... 108
Table 5-1: Starting beam path dimensions summarized from Figure 5-1...112
Table 5-2: Beam phase space specifications after cyclotron extraction...113
Table 5-3: Proton beam quadrupole dimensions...119
Table 5-4: Proton beam drift dimensions...119
Table 5-5: Proton beam dipole magnet dimensions...120
Table 5-6: Helium beam quadrupole dimensions...120
Table 5-7: Helium beam drift dimensions...121
Table 5-8: Summary of dipole properties...123
1 Introduction
1.1 Motivation
Considering that the capital cost of nuclear reactors is in the billions of dollars, the nuclear industry cannot afford to shut down for unscheduled operational maintenance or material
degradation issues; however, there is often no other option. Today's nuclear power plants in the United States have, on average, been in operation for over 25 years. With the United States' 30 year hiatus on the construction of new plants, several plants are running or have requested permission to run on life extensions twice as long as their original licenses [Raj & Vijayalakshmi, 2009]. Materials originally selected for structural components are now being operated at conditions beyond their original design, in many cases due to increased radiation dose. Irradiation displaces atoms from their lattice sites greatly increasing the concentration of point defects within the material, affecting the material structure and properties [Was G. S., 2007]. Effects include, but are not limited to, reduction in fracture strength, swelling, helium embrittlement, growth, phase instability and a wide array of surface effects [Was G. S., 2007]. Materials operated in fusion environments have similar radiation induced effects but must also operate in high temperatures and withstand a stronger and harder neutron spectrum.
While computer modeling methods utilizing Molecular Dynamics (MD) and Binary Collision Approximation (BCA) are becoming increasingly sophisticated, they are still unable to provide a true macroscopic representation of material damage [Adams, 1994]. The best simulation of these effects is done through a combination of experiments coupled with modeling and simulation. Test facilities for the evaluation of radiation effects due to neutron damage are few in number and very expensive to operate. Additionally, the ability of existing neutron sources to provide accelerated testing is very limited. It is difficult for these facilities to match the effect of radiation damage on materials for fusion applications which is several orders of magnitude more severe.
Experimental data is crucial and in high demand for resolving the effects of radiation damage on long term operation of Light Water Reactors (LWR) and the design of advanced reactors and fusion systems. Figure 1-1 illustrates the temperature versus expected radiation damage, defined as
not only the accumulation of DPA that is important but also its associated temperature range over which the damage occurs [Zinkle, 2007].
S.J. Zinkie, 2007 1000 800 sc fusion 0.0 1" 400 QeftoE canddaein word 200prras
Current (C$en 1) fission rlactors VHTR: Very High temperature .
reactor 0 50 100 150 200 250
SCWR: Super-criticalwater cooled
reactor Displacement Damage (dpa)
GFR: Gas cooled fast reactor
ULR Lead cooled fast reactor A common theme for fusion and advanced fission is the need
SFR: Sodium cooled fast reaor to develop high-temperalute, radiation resistant mateials.
MSR_ Molten salt cooled reactorhg
Figure 1-1: Temperature vs. displacement damage for different reactors and fusion systems. Figure adapted from [Zinkle, 2007].
There is a need for helium effects data for fusion first wall exposure and LWR end-of-life conditions. The helium, when combined with displacement damage, can embrittle the material explicitly and greatly aggravate void swelling. Neutrons damage materials through two
mechanisms: the displacement of atoms in the material and the accumulation of helium from the alpha decay of activated nuclei and (n, a) reactions. The solubility of helium is low in most materials so helium precipitates as bubbles in the matrix creating three dimensional (3D) defects or
stabilized voids. Helium bubbles are also very immobile compared to vacancies or interstitials in the temperature range of void formation. Once helium bubbles precipitate, they are unlikely to diffuse [Was G. S., 2007]. Helium bubbles or helium stabilized voids alter the material structure, reducing its strength. These detrimental effects include swelling, hardening, and embrittlement [Was G. S., 2007]. Figure 1-2 illustrates the importance of the ratio of atomic parts per million
He and Displacement Damage Levels for Ferritic Steels
10M0 100E
CL id 10 -Uiuon I e(NSacte 0.1 * 0.01 0.1 1 10 100 1000displacement damage (dpa)
Figure 1-2: Helium/DPA ratios for nuclear reactors and fusion systems. Figure adapted from [Whyte, 2010]. With the research and development for the Generation IV reactors and the study of fusion first wall materials, it has become obvious that there is a need for a materials testing facility that can accurately and quickly assess material properties. Experimental data is lacking, especially for the specific temperatures of operation for these systems as well as helium/DPA ratios described above [Whyte, 2010]. Currently, there are no fast spectrum and only two thermal spectrum test facilities: the Advance Test Reactor (ATR) and the High Flux Isotope Reactor (HFIR). Until, the proposed International Fusion Materials Irradiation Facility (IFMIF) becomes a reality in a decade, there will be no fast spectrum neutron test facility that can duplicate the fusion energy spectrum. IFMIF's mission will be to produce high energy neutrons (up to -30 MeV) at sufficient intensity and irradiation volume, to expose samples of candidate materials to an anticipated full lifetime exposure in fusion energy reactors [IEA, 2011]. However, IFMIF will cost several billion dollars to build and several million dollars annually for operation, yet only capable of exposures of 10-20 DPA per year. Thus, testing end-of-life materials in a fusion device with IFMIF would take years. Clearly, a facility that could achieve at least 40-50+ DPA per year and be capable of simultaneous volumetric deposition of helium would be of enormous value to the scientific community.
iSpalao I~ Fusion
nutroS reactoi
pIFMiIF
1.2 Background
The objective of accelerated irradiation tests using ion irradiation is to simulate accumulated lifetime damage that a material would experience from a reactor in a shorter time than actual exposure lifetime. Ion-based accelerated irradiation has many advantages over neutron irradiation but also some significant issues that must be adequately addressed. Light ion (proton) irradiation decreases induced radioactivation of the test equipment and instrumentation, increases the reliability of the experiment allowing it to be interrupted without disturbing the sample, and the energy of the ion beam is variable. Most importantly, proton irradiation time and associated operational costs are substantially less compared to neutrons [Was G. S., 2007]. These advantages stem mainly from the fact that proton irradiation is performed by impinging a tightly defined proton beam from a particle accelerator on the target rather than placing the target (sample) in the core of a nuclear reactor. Accelerated damage results from Coulomb collisions of the charged particles creating more damage per particle. A typical neutron irradiation experiment in a test reactor requires a year for sample preparation, cooling analysis and capsule design before itis tested, followed by 1-2 years (or more) of neutron exposure in the reactor [Sickafus, Kotomin, & Uberuaga, 2007]. Additional time is needed because of the safety and regulatory issues for the handling of radioactive materials in the vicinity of a nuclear reactor and because of the high
activation level of the irradiated sample. This time period, as well as the high overall cost of the test, does not allow for multiple campaigns and timely turn around due to schedule and budget
restrictions. Proton irradiation time periods are 1/10 that of a neutrons and 1/100 of the cost [Sickafus, Kotomin, & Uberuaga, 2007]. Since time and cost are closely related, proton irradiation generates drastic savings but at the possible cost of not exactly replicating the damage in a neutron environment Nonetheless, the cost and schedule advantages of light ion irradiation clearly
motivate further study.
Linear particle accelerators (LINACs) accelerate charged particles by subjecting them to a series of oscillating electric potentials along a linear beam line. As the particle increases in energy and in mass, the length of the required electrodes increases, creating longer and longer electrical potential segments. To achieve 36 MeV protons and 100 MeV helium ions would require a LINAC
many research environments instead of their counterpart, linear accelerators. Cyclotrons use a magnetic field to accelerate particles in a circle, in order to send them through the same
accelerating electrode repeatedly to gradually increase the particles' energy. This technique greatly reduces the space needed to accelerate ions to high energies and allows irradiation facilities to be much smaller in size. Other benefits of a cyclotron included low weight, low power, small size, and ease of operation [Griffiths, 1989]. Cyclotrons and superconducting cyclotrons (cyclotrons that use superconducting coils to generate a magnetic field) are becoming very common in universities and research labs due to their benefits over larger, heavier linear accelerators.
1.3 Mission Statement
In order to address the issues discussed above, a novel accelerator based materials test facility, MIT Materials Test Facility (M2TF), is being designed for the simulation of high energy, high DPA rate bulk radiation damage with simultaneous helium volumetric implantation in samples up to 1 mm thick. Radiation damage will be simulated by inducing displacement damage with protons in an irradiation facility that will allow the accumulation of dose in advanced materials in a reasonable amount of time, tens of DPA/month. The simultaneous presence of a helium beam allows for the uniform volumetric implantation of helium in the sample to simulate a second materials damage effect that occurs in nuclear reactors. Independent control of helium/D PA ratio will allow for fast fission, fusion and fission material irradiation simulations. The overall size of the facility will be
addressed by making use of superconducting cyclotrons. M2TF will use two superconducting cyclotrons to accelerate the required helium and proton beams, which are a key feature of the facility. Compact cyclotrons will make the M2TF university-sized and lower cost than equivalent
facilities, of which none currently exist
1.4 Thesis Objective
The required accelerator system characteristics are defined in Table 1-1 and the required M2
TF specifications are defined in Table 1-2. Given the energy range, intensity, time structure, operating modes, and type of irradiation, the purpose of this thesis is to develop an optimized cyclotron and beam transport system for a nuclear materials irradiation test facility. This will also
include a geometric layout and proper shielding for all operating systems that meet M2TF design parameters.
Table 1-1: Required accelerator specifications for M2TF.
Table 1-2: Required M2TF design parameters.
1.5 Facility Characteristics
M2TF is a new and different irradiation test facility that hopes to accomplish many of the problems encountered during accelerated proton irradiation testing. It is unique in that it will use gas jet impingement cooling to cool the target sample. A higher heat removal allows for a higher beam current, therefore, higher damage rates can be achieved. A target sample thickness of 1 mm
Number 2 (Helium, Proton)
Ions Helium (Z/A=0.5)
Protons (Z/A=1) Beam Intensity 0.1 mA/cm2
Beam Type High Intensity or CW Beam Energy 100 MeV Helium
(Max) 36 MeV Proton
Final Beam Size 2 mm vertical
5 mm horizontal
Degrader Range 0-100 MeV Helium 12-36 MeV Proton
Cyclotron Field 3-7T
Range (Optimized design to limit
overall size and cost)
Facility Size Less than 225m2 to allow placement into a typical lab room
Radiation Requirements Less than the Total Effective Dose Rate (TEDE) limits (per 105 CMR 120.211) of 5 rem/year Facility Layout Separate shielding for each cyclotron and target
chamber to allow for safe individual chamber maintenance during facility operation
The challenges to the achievement of the design include: constructing a valid argument to affirm that protons are a reliable and useful tool in simulating neutron damage, addressing the concern of damage cascade timescales, designing a compact, cost-effective cyclotrons for two separate ion species, creating proper radiation shielding for the target chamber and cyclotrons, and developing a beam transport design to direct two beams of different energy to the target chamber. Issues related to heat removal restrictions and its effect on DPA rates, sample thickness, and jet impingement cooling design are not discussed in this thesis but are further discussed in TSTARC
[Barnard, Ferry, & Payne, 2010].
1.6 Thesis Outline
Chapter 2 provides an overview of accelerated irradiation, irradiation studies, and arguments. Chapter 3 details the design and design process for both cyclotrons.
Chapter 4 describes the shielding calculations necessary for the proposed M2TF facility. Chapter 5 includes complete 2 Dimensional (2D) beam transport design and simulation. Chapter 6 presents conclusion of this work as well as suggestions for future work. Chapter 7 lists the references used in this thesis.
2 Irradiation Overview
The objective of this chapter is twofold: to support and explain the claims in the M2TF mission statement and to construct a valid argument to affirm that protons are a reliable and useful tool in simulating neutron damage.
2.1 Achieving High DPA Rates
Heinisch and Martinez's experiment with radiation induced strengthening of 316 Stainless Steel proved, by the comparison of yield strength change subjected to different incident particle fluences, that the use of displacements per atom (DPA) to represent radiation damage was a viable method [Heinisch & Martinez, 1986]. Their result led to the NRC support of the DPA method of
damage assessment as the acceptable standard and as a result has been universally adopted in the scientific community [NRC, 1988]. One DPA represents that every atom in the material has been displaced once from its original lattice site as a result from incident particle fluence [Was G. S.,
2007]. The basic formula for calculating DPA for a given system can be derived from the damage
rate equation seen in Equation (2.1). If N is the atomic number density, #(Eg) is the incident particle flux, and -D (E1) is the displacement cross section at energy Ei, then the radiation damage Rd in
cm-3 -s i-s given by:
Rd = N
#(E)a-D(Ei)dEi
(2.1)Equation (2.1) provides the rate of "primary" displacements, those caused directly by collision of the incoming particle and target atom. Accurate calculations of "total" DPA, however, are much more complex. For instance, the consideration of the production of primary knock-on atoms (PKA) following damage cascades and the subsequent migration of vacancies and interstitials in the lattice must be evaluated [Was G. S., 2007]. For complicated models, such as that used in the design of M2TF, DPA rates were calculated through computer simulations and modeling. Computer
Stopping and Range of Ions in Matter (SRIM) is a Binary Collision Approximation (BCA) based Monte Carlo code that is used for displacement calculation [Ziegler & Biersack, 1984]. BCA is a very complex process and only a brief discussion will be provided. The principle assumption of BCA is that the interactions of all particles can be separated into a series of distinct two-body encounters [Was G. S., 2007]. By doing so, changes in the relative energy can be confined to the immediate vicinity of the target atoms. Figure 2-1 illustrates the BCA assumption.
PATH OF PROJECTIL.E AT
SCTTERING
ANGLE,
>-po Pa Xt
PARAMETER. PATH OF SARYCEtNTER
o AAGETA
OF FTARGETATOM
TO
Figure 2-1: Illustration of BCA interaction of atoms. Figure adapted from [Robinson & Torrens, 1974].
The BCA method involves the following steps adapted from [Robinson & Torrens, 1974] and [Was G., 2002].
1. Primary recoil energy, position, and direction are provided as input to the program.
2. The PKA is followed through the series of binary Coulombic atomic collisions.
3. The classical scattering integral between the two particles for the impact parameter (recall
Figure 2-1) is solved.
4. Solution gives the scattering angle and associated electronic energy loss.
5. If the energy transferred is greater than the displacement energy, displacement is assumed to occur and the atom will be added to the cascade.
As stated earlier, BCA only accounts for potentials within the vicinity of the target atom. This assumption is valid for high energy particles because many-body interactions have little contribution to changing the atoms trajectories at energies well above the atom's displacement energies [Robinson & Norgett, 1975]. Monte Carlo (MC) codes, like SRIM, use a random probability for the impact parameter, whereas other codes use pre-determined values. Since MC codes follow individual particles trajectories and paths until completion, SRIM is very accurate when large samples are used. Large samples allow particles to experience all possible outcomes and hence provide a more accurate and better simulation.
An analytical method for DPA calculation was adapted from Was' Fundamentals of Radiation Materials Science [Was G. S., 2007]. Was derived Equation (2.2) from the initial damage rate Equation (2.1) and applied the following principles and assumptions:
1. Neglect (n,2n) and (ny) reactions.
2. Isotropic scattering.
3. Rutherford Scattering for a (E,T).
4. Lindhard Treatment for v(T).
5. A damage energy efficiency, , of 50%.
The above assumptions were adapted from the energy loss by electronic excitation presented by Lindhard but applied for charged particle irradiation.' Applying the above assumptions, the result is Equations (2.2) and (2.3), with units of DPA per ion flux. Table 2-1 lists the meaning of each symbol represented in the equations.
Rd ZZZ E [M 1(yEi dpa
NI 4E1Ed N Ui
7)
ion/cm24MIM2 (2.3)
Table 2-1: Symbol explanation of Was' DPA Equation (2.2).
Symbol Meaning
N Number Density of Sample Material I Incident particle Flux of Beam Mi Mass of particle of material
E Energy of Incoming Particle Ed Displacement Energy of Material Rd Damage/Displacement Rate Z Charge of particle or material E Unit Charge equivalent
k Damage Efficiency
The results of DPA calculation for iron using the Monte Carlo (SRIM) method can be seen in Figure 2-2. A total of five energies (10, 20, 30, 40, 50 MeV) were used in SRIM to compute the DPA per year normalized to a 0.1 mA/cm2 beam current density; a line of best fit was applied to those points. Two lines were generated based on default displacement energy values for SRIM (25 eV,
green line) and ASTM E521-96 (40 eV, red line). The analytical method can be seen in Figure 2-3. Figure 2-3 has three lines plotted: the blue line represents the minimum displacement energy (20 eV), the green line represents the SRIM default displacement energy (25 eV), and the red line represents the average displacement energy (40 eV). For both figures, the x-axis is the energy of the incoming particle. Since M2TF will be an accelerated damage rate facility, the y-axis was labeled in
Damage Rate for Protons on Iron 500 - 400-0 3400-0400-0 E 0 200 ra 100 0 10 15 20 25 30 Energy (MeV) -- Iron Ed=25 eV - Iron Ed=40 eV 35 40 45 50
Figure 2-2: SRIM DPA calculation for Protons on Iron. Proton energies of 10, 20, 30, 40, and 50 MeV were solved
in SRIM. Two runs were completed: displacement energy of 25 eV (green) and 40 eV (red). A line of best fit was drawn between the points.
250 Damage Rate for Protons on Iron
- Ej,,a = 20 eV [G.Was] - Ed = 25 eV [SRIM default) 200 - Ed = 40 eV [G.Was] 150 100 50 -0 15 20 25 30 35 45 5 Energy [MeV)
Figure 2-3: Equation (2.1) DPA calculation with displacement energies of 20 (blue), 25 (green), and 40 (red) eV.
By comparing the DPA estimation for iron in both figures at 36 MeV, the SRIM calculation
predicts higher DPA rates than the analytical method. The disagreement arises partially from the selection of the displacement energy; Ed. Ed not only varies with material but also is dependent on
displacement energy accounts for higher damage rates (observed in Figure 2-2). ASTM E521 Standard Practice for Neutron Radiation Damage Simulation by Charged-Particle Irradiation has published a table, provided here in Table 2-2, with accepted values of Ed for common materials
[ASTM E521-96, 2000]. For clarification, ASTM substitutes Td for Ed. ASTM recommends the value
of 40 eV for steels based on its computer simulation of low-energy cascades, rather than directly on displacement threshold measurements [ASTM E521-96, 2000]. Thus, taking in account of the difference of displacement energy selection, the two methods of DPA calculation are in agreement
by a factor of two.
Table 2-2: ASTM E521-96 displacement energies for common materials. Notice the variance between the minimum and average displacement energy in iron. Table adapted from [ASTM E521-96, 2000].
Metal 7"d(eV) Td(eV)
Al 16 25 Ti 19 30 V 40 Cr 288 40 Mn 40 Fe 208 40 Co 22 40 Ni 23 40 Cu 19 30 Zr 21 40 Nb 368 60 Mo 33 60 Ta 34 90 W 40 90 Pb 14 25
^ See review by P. Lucasson in Proceedings of Internaional Conference on
Fundamental Aspects of Radiation Damage in Metals, Gatlinburg, Tenn., October 1975.
8 An effective threshold measured in a polycrystalline specimen.
As seen in Figure 2-2 and Figure 2-3 large DPA can be accumulated in short periods of time depending on the materials thickness, stopping power, and material properties. Accepting the recommendation of a displacement energy of 40eV from ASTM will result in 40-50 DPA/year accumulation for 36 MeV protons on iron at 0.1 mA/cm2
incident flux rate. This allows the M2TF to simulate PWR lifetime damage in a few years. However, there are some limitations in damage accumulation due to heat removal and temperature difference restraints. Those constraints in the
2.2 Proton vs. Neutron Damage
As described above, light ion irradiation using an accelerator has significant advantages over neutron irradiation. These advantages include reduced activation, increased reliability, ease of availability, reduced cost, and faster accumulation of damage. Light ion irradiation does have its disadvantages. In recent years there has been an ongoing debate on whether light ion irradiation can accurately simulate neutron irradiation because of the inherent difference between a charged particle and a neutron. Arguments include the differences in the ion's Bragg Peak and mean free path of a neutron, differences in nuclear interaction and given recoil spectrum, and the comparison of materials effects such as radiation induced segregation, swelling, dislocation loop population and density, and much more. These topics will be discussed below along with actions that are necessary to provide more accurate damage simulation and accumulation.
Simulating neutron damage with ion irradiation is an established technique with well documented ASTM procedures [ASTM E521-96, 2000]. However, their use to date for materials testing has largely been limited by low energy beams which cannot produce uniform bulk damage in materials. When the beam energy is too low or the materials stopping power is too high, the ions will not be able to penetrate beyond a surface interaction of several tens of pLm. When this event occurs, the particle will create a Bragg Peak a point where the peak in energy loss occurs [Nelson,
1970]. The Bragg Peak occurs because the interaction cross section increases as the particle's
energy decreases. Examples of Bragg Peaks (red circles) are illustrated on Figure 2-4. As illustrated in Figure 2-4, neutrons do not exhibit a Bragg Peak because of their high mean free path for
interaction. Due to this phenomenon, uniformity is important in simulating neutron irradiation effects. In order to simulate bulk effects with protons, high energy beams (30-40 MeV) are required to penetrate thicknesses greater 1 mm for common reactor materials, which results in the location
of the Bragg Peak beyond the sample (Figure 2-5) [Ziegler & Biersack, 1984]. A proton beam, at high energy, will have a more uniform damage profile throughout the sample thickness. For most materials, if the sample is thinner than 2-3 mm, the Bragg Peak energy will not be deposited within the sample. The solution to bulk and uniform damage requirement is to adopt a sample thickness of
hardness properties based on bulk properties. Grain sizes in metals range from 10-100 um. With
10 grains of maximum size (100 pm), the sample would need to be 1 mm thick [Callister, 2010].2
725-MoV tan-vlumr Ito 10- . -A* hydckel - .- Mv eutron-o 14-meV neutrons 2 4 6 8 10 12
DISTANCE INTO SOUD. a
Figure 2-4: Damage profile comparison of protons, neutrons, and heavy ions. The y-axis is the DPA per incident particle. The x-axis is the distance into the solid in micrometers. The red circles note the particles Bragg Peak.
Figure adapted from [Kulcinsji, Brimhall, & Kissinger, 1972].
0n Me
COLLISION EVENTS
Target Displacements 1MM 7xl10-6x10⁵ -SX10-5 4x10--3 xlO5 2X0 -.5mm-Figure 2-5: Uniform interaction of 36 MeV Proton Beam on an Iron sample with 1 mm marked line. Note location
In
g aDuring irradiation, the positively charged protons have two probable interactions within the crystal structure: proton-electron or proton-nucleus. The proton-electron interactions occur between the impinging protons and the atomic electrons of the metals in the crystal lattice. This
'coulomb' interaction slows the protons and heats the sample. This interaction is different than that of neutron irradiation because the neutron experiences no coulomb interactions with orbital
electrons because of its net charge neutrality. This difference can be ignored and deemed
insignificant if the ratio of incident energy to energy transferred to the sample is maximized but this still leads to the heating of the sample [Logan, 1973]. A high energy proton beam creates
significantly less energy loss in the sample because stopping power decreases with particle energy in coulomb collisions. Achieving high energy is also essential to duplicating neutron PKA energy spectrum. At long distances, the proton-nucleus interaction is also a coulomb interaction and at short distances (nuclear radii) the interaction is due to the nuclear strong force. These interactions inelastically transfer energy to the lattice structure. The transfer of energy will be dominated by screened-Rutherford, classical-Rutherford, or nuclear forces and result in small, widely spaced cascades [Logan, 1973]. As the ion slows down, electronic screening of the nuclear charge will become more important and the Rutherford collision approximation will lose validity [Nelson,
1970]. In comparison, since the masses are nearly identical, an elastically scattered proton at a
given energy and angle will create identical PKAs to that of a neutron with the same initial conditions. Damage from protons is caused by long range coulomb scattering in addition to large angle nuclear scattering. Damage from neutrons, however, is dominated by large angle nuclear scattering only, causing higher average recoil energies than equivalent large angle proton scattering [Was G. S., 2007]. The recoil spectra for mono-energetic protons versus neutrons can have similar distributions for high energy recoils, but may vary substantially for low energy recoils as seen in Figure 2-6 [Logan, 1973]. With the use of higher energy protons, above 14 MeV, the difference in recoil spectra can be minimized. This is because the angular region where the scattering
mechanism is different for the proton is where Rutherford scattering predominates. "Since the Rutherford differential cross section is inversely proportional to the square of the incident energy, proton scattering at these angles is suppressed by increasing the incident energy" [Logan, 1973]. In addition, for realistic material exposure in nuclear-energy applications the neutrons have a
continuum of down-scattered energy, which is a better match to the intrinsically broader PKA spectrum of mono-energetic ions than mono-energetic neutrons. In summary, while protons do not provide perfect simulation of neutron damage, these differences can be greatly reduced by
elevating the proton energy to provide uniform volumetric damage and better matching PKA spectrum.
If ion irradiation is to be used to emulate neutrons, it must match in both processes of
magnitude and dose evolution. In a very detailed experiment performed by Was, materials were selected that had sufficient neutron irradiation data and compared to that of proton irradiation at similar energies. After irradiation, the areas compared where grain boundary composition and composition profiles, microstructure, hardness and stress corrosion cracking susceptibility, and creep [Was G. , 2002]. Was et. al concluded that proton irradiation results were in excellent agreement with neutron irradiation data proving that ion irradiation can simulate neutron irradiation effects.3 However, other experiments have shown that certain material damage characteristics, such as swelling and the creation of interstitials are not the same for proton and neutron irradiation. The testing of the swelling process in stainless steels in the EBR-II versus a proton accelerator resulted in a difference between the final peak swelling temperatures
[Abromeit, 1994]. Low energy proton irradiation allows the inhomogeneous creation of interstitials that change the swelling behavior at the depth where the particle comes to rest The use of high energy proton beams, such as that with the design of the M2TF, that penetrate through the sample
will minimize this effect but not eliminate it. In an important fusion study, C.M. Logan proved that 16.4 MeV incident protons simulated 14 MeV neutrons in the total number of PKAs and comparison of recoil and damage spectra [Logan, 1973]. The simulation of 14 MeV neutrons with protons is essential when testing fusion materials. In a D-T based fusion reactor, the T(d, n)He reaction carries
14.1 MeV or 80% of the net reaction energy. This high neutron flux of energy is of great concern due to its effect on structural materials [Logan, 1973].
-1 -24
o14. 1--M.V neutrons
10-- 16.4-MeV protons
10 -o2 7 *0 0
Figure 2-6: Recoil Spectrum for 16.4 MeV protons and 14.1 MeV neutrons in Nb. The recoil spectrums of the two particles are similar at higher energies but vary at lower energies. Figure adapted from [Logan, 19731. Considering ion irradiation is relatively new, there are many arguments for and against its uses to simulate neutron irradiation effects. Ion irradiation in careful experiments has been proven to
simulate most material effects, but not all. Overall, ion irradiation's advantages seem to outweigh its disadvantages in providing an inexpensive, fast simulation of neutron damage and damage physics. Such disadvantageous can be minimized, as described above or noted when analyzing results. Most important is to design a radiation facility with maximum flexibility so that various self-consistency checks can be made, for example the effect of flux versus fluence.
2.3 Helium Implantation Technique and Rates
Employing simultaneous helium volumetric implantation using a helium cyclotron in
conjunction with a proton cyclotron has three benefits when compared with many existing proton or other radiation simulation facilities: achievement of highly flexible helium/DPA ratios, rapid and controlled production of helium accumulation, and simulation end-of-life helium concentrations for reactor materials. With a highly flexible helium/DPA ratio achievable by the use of separate proton and helium cyclotrons, the M2TF can accurately test most fission or fusion materials. Annual helium accumulation for fission metals range from 10-100 atomic parts per million per year (appm/year) and fusion systems can be well above 1000 appm/year [Whyte, 2010]. With the anticipated current density of helium beam (Jle), the thickness of the sample (Ax) and the number density of the target sample (nt), the helium implantation rate (RHe) can be calculated in appm/hr in Equation (2.4)
[Barnard, Ferry, & Payne, 2010].
R e 3.6E9 * e [ (2.4)
A representative normalized rate of helium implantation as a function of target thickness is
displayed graphically in Figure 2-7 in appm/hr and in Figure 2-8 in appm/day for Graphite,
Stainless Steel 204, Inconel 600 and Tungsten. Each figure is plotted against the sample thickness in mm (x-axis). Recall that the design sample thickness for M2TF is 1 mm for most materials. Since all
helium jet impingement cooling and was therefore chosen as the normalization constant for both figures [San, Huang, & Shu, 1997]. Therefore the figure displays the implantation rate in appm/time per 1 MW/m 2
.
Equation (2.4) and Figure 2-7 illustrate that helium accumulation in fission reactors can be accomplished in hours and for fusion systems within days in M2TF. It is also possible to simulate end-of-life effects on materials with helium implantation at high temperatures. Since the solubility of helium is low in most materials, and the bubbles are relatively immobile, most materials will ultimately be limited by helium accumulation [K, Katoh, Ando, & Kohyama, 2003]. Defects caused
by radiation damage due to protons can be thermally annealed at high temperatures. Thermal
annealing has been explored in steels, silicon carbide, and tungsten [Kleuh, Ehrlich, & Abe, 1992]. As a result, for certain materials at high temperature, it is possible to simulate radiation damage at much higher rates with only helium implantation, assuming the removal of damage occurs by
annealing. Typical end-of-life DPA values for a fission reactor are 100+ DPA [Was G. S., 2007]. Given a Helium/DPA ratio, the amount of helium needed can be determined for an end-of-life simulation. With a separate operating helium cyclotron, only days are needed to simulate the end-of-life of materials absorption of helium as opposed to months and years when using light ion based DPA studies.
For a profile test, it is best to have helium energies of 15-60 MeV because the elastic scattering cross section is highest and remains relatively constant as the beam loses energy [ASTM E942-96, 2011]. For M2TF, penetration of a 1 mm sample cannot be accomplished with the recommend ASTM energy range. Only helium ions above 100 MeV have ranges around 1 mm for most reactor
materials [Ziegler & Biersack, 1984]. In order to achieve uniform helium implantation the cyclotron must operate at full energy while the beam energy is reduced with an energy degrader, thus controlling the depth of the helium implant. This method of uniformity is different than that of the proton irradiation. For proton irradiation, the goal is to subject the test material to a uniform dose of the proton beam throughout the cross-section (refer to section 2.2 and Figure 2-5), whereas the helium beam's Bragg Peak will be rastered throughout the depth of the sample to implant the material with helium. While this simultaneously damages the materials, the cumulative damage will be small because end-of-lifetime accumulation can be achieved in such a short period of time.
Helimi Heat Flux Im1an 1 tatkn Bate /r ) pp) M W
)
hour / \ .y / 180 160 140 120 Target Thickness [mm]Figure 2-7: Appm of volumetric helium implantation per hour (y-axis) for Graphite, SS, Inconel 600 and Tungsten with respect to target thickness in mm (x-axis).
= Helium mntati Rate
)
( m= f MW)
Hea Flux /\day / \ m11 /4500 4000 3500 3000 89 2500 2000 1500 1000 Target Thickness (mm]
Figure 2-8: Appm of volumetric helium implantation per day (y-axis) for Graphite, SS, Inconel 600 and Tungsten with respect to target thickness in mm (x-axis).

![Figure 1-2: Helium/DPA ratios for nuclear reactors and fusion systems. Figure adapted from [Whyte, 2010].](https://thumb-eu.123doks.com/thumbv2/123doknet/14680956.559243/23.918.229.608.173.463/figure-helium-ratios-nuclear-reactors-systems-figure-adapted.webp)
![Figure 2-1: Illustration of BCA interaction of atoms. Figure adapted from [Robinson & Torrens, 1974].](https://thumb-eu.123doks.com/thumbv2/123doknet/14680956.559243/30.918.271.648.330.639/figure-illustration-interaction-atoms-figure-adapted-robinson-torrens.webp)