Deconstructing the Room-Temperature Emission
Spectra of Nanocrystals Using Photon-Correlation
Fourier Spectroscopy
by
Jian Cui
B.S. Chemistry
Stanford University, 2008
Submitted to the Department of Chemistry
in partial fulfillment of the requirements for the degree of
Doctor of Philosophy
at the
MASSACHUSETTS INSTITUTE OF TECHNOLOGY
February 2014
c
Massachusetts Institute of Technology 2014. All rights reserved.
Author . . . .
Department of Chemistry
December 5, 2013
Certified by . . . .
Moungi G. Bawendi
Lester Wolfe Professor of Chemistry
Thesis Supervisor
Accepted by . . . .
Robert W. Field
Chairman, Department Committee on Graduate Students
This doctoral thesis has been examined by a committee of the
Department of Chemistry as follows:
. . . .
Professor Jianshu Cao
Thesis Committee Chairman
. . . .
Professor Moungi G. Bawendi
Thesis Adviser
. . . .
Professor Robert G. Griffin
Deconstructing the Room-Temperature Emission Spectra of
Nanocrystals Using Photon-Correlation Fourier Spectroscopy
by
Jian Cui
Submitted to the Department of Chemistry on December 5, 2013, in partial fulfillment of the
requirements for the degree of Doctor of Philosophy
Abstract
The photoluminescence spectrum of an ensemble of emitters is the result of the homo-geneous “natural” spectra of single emitters subjected to interparticle inhomogeneities and perturbations from the environment. For semiconductor nanocrystals (NCs), ef-forts to tune ensemble linewidths for optical applications have focused primarily on eliminating sample inhomogeneities because conventional single-molecule methods cannot reliably build accurate ensemble-level statistics for single-particle linewidths. Photon-correlation Fourier spectroscopy in solution (S-PCFS) offers a unique ap-proach for investigating single-nanocrystal spectra with large sample statistics, with-out user selection bias, with high signal-to-noise ratios, and at fast timescales.
With S-PCFS, we directly and quantitatively deconstruct the ensemble spectra of nanocrystals into contributions from the average single-NC homogeneous linewidth, spectral dynamics, and sample inhomogeneity. First, we discovered that single NCs at room temperature, in contrast to cryogenic temperatures, do not exhibit spectral dynamics on sub-millisecond timescales. Second, the linewidths of these homogeneous spectra were found to vary significantly from batch to batch and subject to synthetic control. Our findings crystallize our understanding of the synthetic challenges facing underdeveloped nanomaterials such as InP and InAs nanocrystals and introduce new avenues for the synthetic optimization of fluorescent nanoparticles.
Finally, we have made strides toward understanding the underlying physical pro-cesses responsible for the homogeneous spectra of single nanocrystals at room temper-ature. Through careful synthetic control over the nanocrystal structure and composi-tion, we have been able to understand changes in the homogeneous spectral linewidth in terms of exciton-phonon coupling. Combined with a simple spectral lineshape model, we have worked towards quantitatively understanding exciton-phonon cou-pling with respect to specific nanocrystal structural and composition parameters. Thesis Supervisor: Moungi G. Bawendi
Acknowledgments
I’ve heard it said
That people come into our lives for a reason Bringing something we must learn
And we are led
To those who help us most to grow If we let them
And we help them in return
Well, I don’t know if I believe that’s true
But I know I’m who I am today because I knew you . . . Who can say if I’ve been changed for the better? But because I knew you
I have been changed for good. —Wicked, The Musical
In many ways, this PhD thesis represents the culmination of a lifetime of educa-tion. For such an occassion, the least I can do is take this space to deeply thank all of the people who have been instrumental in my education and in my development as a person. Even if they will never know how much they have meant to me.
I want to begin by thanking several important gradeschool teachers who helped this wide-eyed immigrant child adapt and learn and grow. I want to first thank Mrs. Judy Baxter who was my ESL teacher at my elementary school and then later a Science teacher in 5th grade. Mrs. Nancy Titchen was undoubtedly the most important teacher I ever had. I know this because of the sheer volume of vivid memories I still have about being in her third- and fourth-grade classes. She had a talent for engaging us as budding individuals rather than mere children. I wonder if I will ever learn to do the same. In the awful experience that was middle school, Mr. Win Leitzer was one of the bright spots because he always brought energy and enthusiasm to his science class.
High school was a more rewarding experience. Mr. Scott Audlin was the first teacher I had who legitimately challenged us and expected the best from us each and every day. Mr. John Wagner was built in a similar vein. I will always remember his parting words of advice to the graduating class: “If you’re going to do something, do it right”. Mrs. Donna Weber taught mathematics with a clarity that I only appreciated after leaving high school. Both Mr. Wagner and Mrs. Weber wrote recommendation letters to colleges for me and I can never thank them enough for that. I also want to acknowledge Ben Stone, the TA at the CTY Johns Hopkins “nerd camp” that I attended. He really made me think about myself that summer. Finally, I want to thank Dr. Jeremy Berg and Dr. Ernie Maynard for kindly providing me with my first exposure to real scientific research.
School instructors can only teach you so much. It took me a long time to realize how significantly I am affected by each and every one of my friends. Timothy Amyot and Romulo Cabeza were my first close friends in elementary school. I was particularly
close to Timothy, who had a very mature outlook on life that was completely foreign to me at the time. From him, I first learned the value of having trustworthy friends who have your back. Thomas Chae, Michael Pan, Sarah Hahn, Sarah Lewis, and Kate Thompson played significant roles in my development as a young adult. I have included their names here despite losing virtually all contact with them after middle school. It was in high school that I made some of my most memorable friendships. Alex Berg, David Bochner, and Brandon Ferguson have been some of my most loyal and dependable friends since high school. I hope that they consider me one of theirs as well.
Attending Stanford University was an extraordinary experience. As I continue to be reminded, it is always the people who make being at any place worthwhile. Some of the people I met there on my very first day remain some of my closest friends now. I particularly want to thank Kellen Schefter, Alex Berg, and Michael Ramm for their support over the years – the kind only a special kinship can cultivate. Anthony Scodary, Nico Benitez, Josh Stark, and Alex Williamson round out the remainder of the draw group and have been an endless source of wit, humor, introspection, and adventure. I also want to note how much I value my friendship with Kara Johnson, whose seemingly endless enthusiasm and energy is an inspiration in itself.
I met, worked with, and learned from incredible scientists during my time at Stan-ford. Ben Spry was my first TA at Stanford and became an excellent and supportive mentor during my entire time there. So Yeon Kim, my research mentor in the Mo-erner lab, had an endless well of patience for a clumsy undergrad. I also learned a great deal working with Whitney Duim, Erik Miller, Adam Cohen, Sam Lord, Julie Biteen, and Hsiao-lu Lee. Finally, Professor W. E. Moerner was an excellent under-graduate advisor: patient, understanding, and supportive. To this day, I am shocked at how much time and attention he afforded to working with me and he deserves a tremendous amount of my gratitude.
I have been extremely privileged to attend MIT for graduate school. First, the infrastructure has been excellent. I want to thank Li Miao for providing us with exceptional administrative support. Susan Brighton, Mary Turner, Melinda Cerny, and Jennifer Weisman were always helpful in the Chem Ed office. I want to thank all the people at MIT Medical who helped put me back together whenever I was broken. Lastly, I want to thank the National Science Foundation for their Graduate Research Fellowship and the Department of Energy Office of Basic Sciences for funding the PCFS project. It is humbling to recognize that taxpayer money has fully funded my graduate education. I hope that my future endeavors will result in a return on this investment.
Here, I want to thank several of the instructors of courses that helped me develop as a scientist. Bob Silbey, Andrei Tokmakoff, and Leonid Levitov each taught quan-tum mechanics offering differing, yet, complementary approaches. I had a similar experience with the solid-state physics courses taught by Rajeev Ram and Patrick Lee. I want to thank James Fujimoto for his often-times maddening, but ultimately extremely rewarding, optics and nonlinear optics courses. Beyond courses, Professors Andrei Tokmakoff, Christian Degen, Jianshu Cao, and Robert Griffin have all been helpful for my education as members of my thesis committee.
However, the overwhelming amount of learning in graduate school occurred in the lab. I want to warmly thank Lisa Marshall for training me since my first day in the Bawendi lab. Lisa had a talent for patiently explaining concepts until I finally understood. Moreover, she was a inventive scientist with creative ideas for every hurdle we encountered. Working closely with her on the experimental execution of S-PCFS was an extremely educational and memorable experience.
I have also worked very closely with Xavier Brokmann, the father of PCFS, from afar. Despite working a full-time job and being married with children, Xavier was an endless source of physical insight and mathematical expertise. It was not unusual to receive an email from him about a paper he found on the arXiv or a full-blown derivation in response to a simple question. I am grateful for his support over the years and proud to have worked with him to help turn PCFS from an intriguing and clever technique into a useful and practical tool.
I would like to gratefully acknowledge the mentorship I received from Gautham Nair, Brian Walker, Peter Allen, Hee-Sun Han, and Wenhao Liu. Especially dur-ing my early years in the lab, each offered invaluable insight into the workdur-ings of science, graduate school, careers, and most importantly, of Moungi. I also enjoyed working with other members of the lab including Cliff Wong, Ou Chen, Jos´e Cordero-Hernandez, Daniel Harris, Darcy Wanger, Jungmin Lee, Thomas Bischof, Mark Wil-son and Russell Jensen. I am particularly thankful to Jos´e, Ou, and Dan for teaching me quantum dot synthesis. I also had a very nice collaboration with Liam Cleary, a member of Professor Jianshu Cao’s group. Tackling the world of theoretical models was definitely an interesting and valuable experience for me.
Working with Andrew Beyler has been the most rewarding of my collaborations. I don’t believe it to be a coincidence that we were both very productive as soon as we started working together. Andrew has a keen eye for thinking rigorously and mathematically, and our skills and approaches very much complemented the other’s. Additionally, he has a fun personality and, despite the occasional heated debate, never takes things personally and doesn’t allow you to either. Thank you Andrew for your hard work, intellectual contributions, and friendship.
I will miss the conversation and company of wonderful friends that I made outside of the lab. Ben Ofori-Okai, Steph Teo, Christopher Lemon, and Kevin Chang were always great for conversation and fun. I also greatly enjoyed my time living with and hanging out with Yuta Kuboyama, Rune Haugseng, and Jethro van Ekeren. I would like to make special mention of several of my closest friends at MIT. Jen Yao and Sam Peng are reliable friends with a great sense of perspective and a willingness to share. Sam and I also shared many battles on the basketball courts at the Z center. I developed a special bond with Eric Marberg over our inclinations toward intellectual musings on human behavior. Finally, I would like to thank three people whom I have come to regard as my “MIT siblings”. Raoul Correa and I entered the Bawendi lab at the same time as spectroscopy students and we really grew up together, having many adventures along the way. Armed with patience and compassion, Jennifer Scherer and Kara Manke braved some of the ugliest sides of my personality and helped me navigate through some of the darkest turns in my life. I hope I never make the mistake of taking such kindness for granted.
There is a well-known saying that “familiarity breeds contempt”. That is, the more you get to know somebody, the less you like or respect that person. However, Moungi Bawendi is one of the rare individuals for whom this is not the case. I came to graduate school to learn to be a scientist and with each passing year, my personal growth actually coincided with holding Moungi in higher esteem. With a laid-back but professional demeanor, Moungi encouraged a freedom to explore and disagree, while maintaining sage guidance when necessary. All this with an unwavering commitment to doing science rigorously and honestly, and a grounded understanding that grad students are real people with lives that can sometimes be challenging. Thank you Moungi for all that you have done for me. It has been a tremendous honor and a unique privilege. As the Roman writer Apuleius originally wrote, “familiarity breeds contempt, but rarity wins admiration”.
I have reserved the end of my lengthy acknowledgements section for my parents, Xianghao Cui and Tiexin Piao, whose love and dedication I can only begin to appreci-ate. Determined to raise their son in the US, my parents made tremendous sacrifices, many of which I will probably never know. Despite my best efforts, I frankly find myself at a loss here – my literary capabilities are simply insufficient. I may never be able to articulate the depths of my gratitude or express to them the earnestness of my adoration. I also realize that I may never be able to give in return all that they have done for me. I can only hope to reciprocate by sharing with them a life without regrets and of love and peace.
Contents
1 Introduction 21
1.1 Optical Measurements of Photoluminescence . . . 21
1.2 Single-Molecule Microscopy and Spectroscopy . . . 22
1.3 Semiconductor Nanocrystal Quantum Dots . . . 23
1.4 Overview of Thesis . . . 24
2 Photoluminescence Intensity From Single Nanocrystals 29 2.1 Intensity Binning . . . 29
2.1.1 Limitations of Intensity Binning . . . 32
2.2 Photoluminescence Decay . . . 33
2.2.1 Multiexciton Emission . . . 34
2.2.2 Excitonic Fine Structure . . . 35
2.3 Combining Intensity Binning and PL Decay . . . 36
2.3.1 Fluctuating Non-Radiative Rates and Single-Nanocrystal Quan-tum Efficiency . . . 36
2.3.2 Trion Emission . . . 38
2.3.3 Type A and Type B Intensity Fluctuations . . . 39
2.4 Photon Correlation . . . 41
2.4.1 Broad Timescale Dynamics: Blinking . . . 42
2.4.2 Antibunching of Emission from Single Emitters . . . 43
2.4.3 The Antibunching Signal of Single Nanocrystals Reflects Mul-tiexciton Recombination . . . 44
2.4.5 New Directions for Photon-Correlation Studies of Multiexcitons
in Single Nanocrystals . . . 47
3 Single-Nanocrystal Spectroscopy 49 3.1 CCD-based Spectroscopy . . . 49
3.1.1 Spectral Diffusion at Low Temperature . . . 50
3.1.2 Spectral Features at Low Temperature . . . 51
3.1.3 Limitations of CCD-based Spectroscopy . . . 52
3.2 Adding Spectral Resolution to Time-Resolved Measurements . . . 53
3.2.1 Measuring Distinct Emission Processes in a Single Nanostructure 53 3.2.2 Spectral Diffusion Under Two Detection Channels . . . 54
4 Photon-Correlation Fourier Spectroscopy (PCFS) 57 4.1 Description of PCFS . . . 57
4.2 Interferometry, Coherence, and Spectra . . . 59
4.2.1 Derivation of the Interferometer Output Intensity . . . 60
4.2.2 Interferogram of a Gaussian Spectrum . . . 63
4.3 Derivation of PCFS Using Coherence . . . 65
4.3.1 Denominator . . . 66
4.3.2 Numerator . . . 68
4.3.3 Combining Numerator and Denominator . . . 70
4.3.4 Relationship to the First PCFS Derivation . . . 71
4.4 PCFS on Single Nanocrystals at Low Temperature . . . 72
4.5 Beyond Probing Single Emitters . . . 74
5 Fluorescence Correlation Spectroscopy (FCS) 75 5.1 FCS Theory . . . 75
5.1.1 Photon Pairs from an Ensemble of Emitters . . . 76
5.1.2 Derivation of Two Forms for the Intensity Correlation Function 79 5.2 FCS in Practice . . . 80
5.2.2 Fitting in FCS . . . 82
5.3 Application of FCS . . . 84
5.3.1 Biocompatibility . . . 85
5.3.2 Size-Changing Cancer Nanotherapeutics . . . 86
5.4 Conclusion . . . 88
6 PCFS in Solution (S-PCFS) 89 6.1 S-PCFS Theory: Combining FCS with PCFS . . . 90
6.1.1 Intuition For Combining PCFS and FCS . . . 91
6.1.2 Formal Derivation of S-PCFS Governing Equation . . . 92
6.1.3 Notation . . . 94
6.2 Advantages, Disadvantages, and Tradeoffs . . . 95
6.3 S-PCFS on a Broad Mixture of Quantum Dots . . . 97
7 Spectral Dynamics in Nanocrystals at Room Temperature 101 7.1 Analyzing Spectral Dynamics using PCFS . . . 102
7.1.1 Small-τ Limit . . . 102
7.1.2 Absence of Spectral Dynamics . . . 103
7.1.3 Dynamic Spectra . . . 103
7.2 Absence of Spectral Dynamics in CdSe/CdZnS Particles . . . 104
7.3 Comparing S-PCFS to Conventional Fluorescence Spectroscopy . . . 106
8 Single-Nanocrystal Spectral Linewidths 109 8.1 Fitting . . . 110
8.2 S-PCFS as a Direct Probe of Spectral Inhomogeneity . . . 113
8.3 Single-NC Linewidth Variations and Synthetic Control . . . 115
8.4 Implications of Single-NC Linewidth Variations . . . 117
8.5 Conclusions . . . 119
9 Exciton-Phonon Coupling in Nanocrystals 121 9.1 Spectral Linewidth Broadening with CdS Shell Growth . . . 122
9.2 Spectral Lineshape Modeling . . . 126
9.2.1 Modeling the Spectral Correlation . . . 126
9.2.2 Exciton-Phonon Coupling Mechanisms in Quantum Dots . . . 128
9.2.3 Multimodal Brownian Oscillator Model . . . 129
9.2.4 Weighted Phonon Density of States . . . 129
9.3 Spectral Lineshape Modeling Results . . . 130
9.4 Conclusions . . . 132
List of Figures
1-1 Schematic of the Conventional Single-Molecule Epifluorescence Setup 22 1-2 Methods for Probing the Photon Stream from Single Nanocrystals . . 24 1-3 Deconstructing the Ensemble PL Spectra of Nanocrystals at Room
Temperature . . . 26 2-1 Binning the Emission Intensity from Single Nanocrystals . . . 30 2-2 Photoluminescence (PL) Decay . . . 33 2-3 PL Decay Can Show Multiexciton Emission from a Single NC . . . . 34 2-4 Evidence of Exciton Fine Structure in the Temperature Dependence of
the PL Decay . . . 35 2-5 PL Decay Kinetics Can Vary with Emission Intensity . . . 37 2-6 “Grey” State Emission from Single Nanocrystals Attributed to Trions 38 2-7 “Type A” and “Type B” Intensity Fluctuations . . . 40 2-8 Photon Correlation and Antibunching . . . 42 2-9 Schematic of the Hanbury Brown and Twiss Correlation Setup . . . . 44 2-10 Cartoon of the Pulsed Photon-Correlation Data From a Single NC . . 46 2-11 Variations in the Single-NC Biexciton Quantum Yield . . . 47 3-1 Conventional CCD-based Single-Nanocrystal Spectroscopy . . . 50 3-2 Dual-Color Time-Resolved Measurements . . . 54 3-3 Dual-Monochromator Photon-Correlation Technique for Measuring
Spec-tral Dynamics . . . 55 4-1 Conceptualizing Photon-Correlation Fourier Spectroscopy . . . 58
4-2 Schematic of the Mach-Zehnder Interferometer . . . 60
4-3 Example Interferogram of a Gaussian Spectrum . . . 63
4-4 PCFS on Single Nanocrystals at Low Temperature . . . 74
5-1 Conceptualizing Fluorescence Correlation Spectroscopy (FCS) . . . . 78
5-2 Schematic of the FCS Setup . . . 81
5-3 Testing the Biocompatibility of Magnetofluorescent Superparticles with FCS . . . 86
5-4 Measuring Size-Changing Nanoparticles with FCS . . . 87
6-1 Schematic of the Setup Used in S-PCFS . . . 90
6-2 S-PCFS Performed on a Broad Mixture of Quantum Dots . . . 98
7-1 Measuring the Time Dependent Single-NC Spectral Correlation Function104 7-2 Absence of Spectral Dynamics on Submillisecond Timescales . . . 105
7-3 Comparing Spectral Correlations Obtained by S-PCFS and Conven-tional Fluorescence Spectroscopy . . . 107
8-1 S-PCFS Data Analysis and Fitting . . . 110
8-2 Comparison of Fluorescence Data from S-PCFS and Fluorometer . . 112
8-3 S-PCFS Comparison of Different Core Materials Composition . . . . 113
8-4 S-PCFS on CdSe/CdS Particles with Near-Perfect Spectral Monodis-persity . . . 114
8-5 S-PCFS on Commercial CdSe Samples and CdSe/CdS Shell Growth Series . . . 116
8-6 Transmission Electron Micrographs of Various Samples . . . 117
9-1 Single-NC Linewidths for CdSe Cores with Different Shell Composition Thicknesses . . . 123
9-2 Cartoon Illustrating Fr¨ohlich Coupling . . . 124
9-3 Single-NC Spectral Linewidths for a CdSe Core Size Series . . . 125
List of Tables
Chapter 1
Introduction
1.1
Optical Measurements of Photoluminescence
At the root of nearly all the physical sciences is the study of the properties of mi-croscopic systems. A particularly fruitful avenue for these types of investigations has been optical measurements, which take advantage of light-matter interactions. Phys-ical processes at the molecular scale can be investigated by monitoring the fate of a photoexcited electron. For instance, photovoltaic devices can be studied by measuring the separation and transport of optically-excited carriers.1 Also, vision in animals can
be understood by studying the conformational changes of receptor proteins that occur upon absorption of light by chromophores.2 Finally, the complexities of
photosynthe-sis can be unraveled by monitoring the transfer of energy between photosystems that eventually results in the biosynthesis of ATP.
Luminescent materials belong to a intriguing class of optically-active materials that is attractive for many applications such as bio-imaging, LEDs, and displays. Photoluminescence, the phenomenon of absorbing and subsequently emitting light, offers a particularly practical window to the microscopic world because the emitted light acts as a reporter of the emitter with minimal background. Moreover, the symmetry between the absorption and emission processes offers a neat framework for understanding the photoluminescence signal.
Objective
Laser Sample
Emission Filter
Detector
Figure 1-1: The conventional single-molecule fluorescence setup typically consists of an excitation laser and a high-NA objective in an epifluorescence geometry.
1.2
Single-Molecule Microscopy and Spectroscopy
Systems comprised of microscopic constituents often exhibit both significant het-erogeneity between individual members as well as time-dependence in their proper-ties. These complexities can render the results of ensemble-averaged measurements ambiguous, leaving the intrinsic physics obscured.3 Single-molecule microscopy and
spectroscopy have revolutionized the study of microscopic systems because of their ability to unambiguously disentangle the effects of inhomogeneity and dynamical fluc-tuations.4
Conventional single-molecule fluorescence techniques rely on removing ensemble averaging by spatially isolating single emitters on a surface and measuring their fluo-rescence.5 As shown in Figure 1-1, this is typically performed by using a laser for an
excitation source and a high numerical aperture objective in an epifluorescence mi-croscopy geometry. In this arrangement, the excitation and collection are performed using the same pathway. Scatter from the excitation laser is removed using a filter and the fluorescence from the single emitter is detected. Throughout this thesis, we reflect on variations of the schematic shown Figure 1-1 that provide access to different types of information at the single-emitter level.
While the study of biochemical and cellular systems has prominently benefited from single-molecule investigations,6 these techniques have also been essential for
single-molecule fluorescence spectroscopy, many of the fundamental optical properties of colloidal semiconductor nanocrystal quantum dots were obscured by ensemble av-eraging over their inherent inhomogeneities. Single quantum dot spectroscopy has become a leading technique for the unambiguous determination of the governing ex-citonic physics of these nanoscale systems.
1.3
Semiconductor Nanocrystal Quantum Dots
The defining feature of semiconductor nanomaterials is that their electronic energy levels are determined not only by their material composition but also by their struc-ture. This is because the energies of these states are perturbed by quantum confine-ment when a spatial dimension of a nanostructure becomes comparable to the effective size of the electronic wavefunction.8 This effect is maximized in the case of quantum
dots (QDs), where confinement occurs in all three dimensions. Here, photoexcitation results in an electron-hole pair, often called an “exciton”, that is bound primarily by the dimensions of the particle rather than the carriers’ mutual Coulombic interaction. The energy of these excitons, and thus the optical properties of QDs, can be directly tuned by changing the particle size. Quantum dots can be self-assembled through molecular beam epitaxy9 or chemically synthesized in solution.10 This thesis focuses
on the latter, which are often referred to as “nanocrystals” (NCs), because they are colloidal suspensions of crystalline material.
Semiconductor nanocrystals are synthesized, modified, and processed in solu-tion.10 They generally consist of a core, an inorganic shell, and a passivating
lig-and layer.11 The size, composition, and geometry of the core, shell, and ligands can be tuned to produce particles with high brightness and photostability12–15 from the
visible10 to the mid-wavelength infrared.16–20 Compared to their molecular dye coun-terparts, they have larger absorption cross sections, broader absorption spectra, and narrower emission linewidths.21, 22 Moreover, with modifications to the ligand layer on the surface of the nanocrystal,1, 21, 23 these particles can be made amenable to different
ζ,τ
τ
T
{
t
Figure 1-2: The signatures of nanoscale processes are encoded within the stream of photons emitted from a single nanoparticle. Our understanding of nanoscale phenomena in colloidal quantum dots has developed alongside our ability to characterize this photon stream.
applications such as biological imaging,21 displays,24 photodetectors,25 solar cells,26 solid-state lighting,27 and more.1, 28
The growing use of nanocrystals in optical applications has relied on the interplay between advancements in synthetic methodologies and advancements in our under-standing of their fundamental physical properties. However, the chemical synthesis of these materials tends to produce a structurally polydisperse sample with a distribu-tion of optical properties. Therefore, ensemble-level investigadistribu-tions of nanocrystals are invariably complicated by inhomogeneous spectral broadening and averaging of any dynamical properties.7 With the advent of single-molecule fluorescence spectroscopy, nanocrystals can be investigated one at a time, bypassing ensemble averaging and revealing unforeseen phenomena.4 The signatures of these nanoscale processes are encoded within the stream of photons emitted from a single nanoparticle (Fig 1-2).
1.4
Overview of Thesis
In this thesis, we begin with a discussion on the application of single-molecule fluores-cence techniques to single nanocrystals. In Chapters 2 and 3, we review how our un-derstanding of nanoscale phenomena in colloidal quantum dots has developed along-side our ability to characterize the photon stream from individual particles. From
relatively simple integrative “binning” techniques to more advanced single-photon counting methods, measurements of the timing and energies of photons emitted from single nanoparticles have helped reveal complex and dynamical phenomena. Addi-tionarlly, we reflect on how the inherent complexity and disorder of nanocrystals has necessitated the assembly of a diverse toolbox of single-molecule techniques. In this way, single-molecule studies of colloidal quantum dots represent an archetype for the elucidation of optical physics at the nanoscale.
However, conventional single-molecule spectroscopy suffers from a fundamental tradeoff between spectral resolution, temporal resolution, and signal-to-noise ratio. In Chapter 4, we discuss photon-correlation Fourier spectroscopy (PCFS), an ad-vanced spectroscopic technique that monitors spectral information through a dif-ferent paradigm that in the past. In essence, PCFS measures spectral information by monitoring the energy differences between photon pairs. We provide theoreti-cal background and a summary of experimental implementations of PCFS on single nanocrystals.
Despite the power of PCFS and the new types of spectral information that it can access, this technique still relies on investigating isolated emitters one at a time. As a result, it is non-trivial to extrapolate any findings from a single particle to the sample batch as a whole. For nanocrystals, these concerns have hindered the unambiguous characterization of the links between synthetic methodologies and single-nanocrystal spectral properties. For the remainder of this thesis, we discuss an extension of PCFS that takes the principles of PCFS, but applies them to study single-nanocrystal spectral properties with ensemble-level statistics.
As a foundation for understanding this extension of PCFS, we provide in Chapter 5 an introduction to fluorescence correlation spectroscopy (FCS), which is a technique for monitoring the temporal distribution of photons from emitters in solution diffusing through a laser focus. Rather than spatially separating emitters on a surface and monitoring the emission from each emitter one at a time, FCS serves to separate the emission from emitters temporally by monitoring the relative arrival times of photons as emitters diffuse into and out of the focal volume. With this analysis, photon pairs
“Intrinsic”
spectrum “Natural”spectrum
Spectral dynamics Inhomogeneous broadening
Ensemble spectrum
Figure 1-3: In this thesis, we deconstruct the ensemble spectra of nanocrystals at room temperature and determine the contributions due to inhomogeneous broadening, spectral diffusion, coupling to the bath that broadens the “natural” spectrum.
can be determined to have arrived from the same emitter or from different emitters. Chapter 6 and the remaining chapters span a larger effort to deconstruct the room-temperature emission spectra of nanocrystals. As shown in Figure 1-3, the emission spectrum of an ensemble of emitters consists of the spectra of single emitters (the homogeneous component) convoluted with the heterogeneities in the system (the in-homogeneous component). The single-emitter spectrum originates from broadening of the lifetime-limited natural emission spectrum by intrinsic and extrinsic interactions with the environment.29 Typically, these interactions are a combination of
photoin-duced spectral diffusion (extrinsic) and excitonic coupling to the bath (intrinsic).30
FCS monitors whether photon pairs originated from the same emitter of different emitters. PCFS monitors the spectral coherence between photon pairs. In Chap-ter 6, we discuss the marriage of FCS and PCFS, which gives us PCFS in solution, or S-PCFS. With S-PCFS, spectral information can be distinguished from photon pairs that came from the same emitter and photon pairs that came from different emitters thereby providing direct access to both single-emitter spectral information
with ensemble-level statistics and spectral information of the entire ensemble. We first provide a theoretical treatment and then provide a proof-of-principle experiment that demonstrates the successful experimental implementation of S-PCFS.
In Chapter 7, we discuss the implementation of PCFS to study spectral diffusion. We discuss a study of spectral diffuion in nanocrystals on timescales much more rapid than conventional single-molecule techniques can access. In Chapter 8, we study the intrinsic single-nanocrystal spectral linewidth averaged over a sample batch. We observe significant variations in single-NC emission linewidths that appear to be directly linked to the structure and composition of the particles and therefore provide a new avenue for the rational design of nanocrystals for optical applications. We discuss the origins of these spectral linewidth changes in Chapter 9 and end with some concluding remarks in Chapter 10.
Chapter 2
Photoluminescence Intensity From
Single Nanocrystals
The fluorescence quantum yield of luminescent materials is of paramount importance for practical applications. However, unlike the best organic dyes, which had been established to have near-unity quantum yields,31 early CdSe nanocrystals exhibited quantum yields that were far from unity.10 It was unclear whether the low ensemble
quantum yield resulted from poor emission efficiency of individual particles, from subpopulations of emissive and non-emissive particles, or from temporal dynamics in the emission. In this chapter, we discuss how single-molecule techniques found an immediate niche addressing this quandary. By removing ensemble averaging, they revealed complexity in single-nanocrystal emission that could not have been inferred from ensemble measurements. All of the work discussed in this chapter was performed by other researchers, many of whom were also in the Bawendi lab. Much of this chapter appeared in a review paper written with Andrew Beyler, Thomas Bischof and Mark Wilson (Ref. 32).
2.1
Intensity Binning
Fluorescence measurements of individual nanocrystals are generally performed by dispersing them on a substrate, exciting them with a laser in an epifluorescence
a)
b)
c)
0 20,000 40,000 60,000 0.4 0.6 0.8 1 Time (s) PL In te ns ity (n or m )New Generation CdSe/CdS Conventional CdSe/CdS Pr ob ab ili ty D is tr ibut io n Time (s) 0.1 1 10 100
d)
100 10-2 10-4 10-6 0 5 10 15 20 0 100 300 500 700 Time (s) PL C oun ts / 50 ms{ { { { {
T T T T T T{
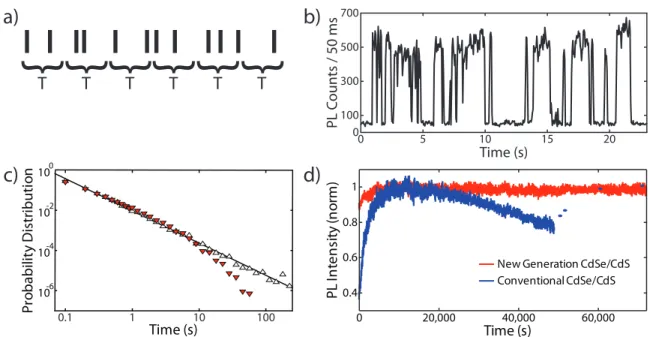
Figure 2-1: a) The photon stream emitted by a single emitter can be analyzed in terms of the number of photons per integration bin of duration T. b) An intensity trace collected from a single InAs nanocrystal shows fluorescence intermittency or “blinking”. c) The probability density of on-times (red) and off-times (open) from the intensity trace of a single CdTe nanocrystal follows a power-law. The on-time distribution possesses a truncation at longer durations (Adapted from Ref. 36 with permission. Copyright 2001 by the American Physical Society). d) An ensemble of CdSe/CdS core/shell particles exhibits intrinsic photodarkening under cw excitation due to truncation in the on-time power law distribution (blue) while an ensemble of next-generation CdSe/CdS particles with suppressed blinking shows no photodarkening.15
microscope, and then detecting the photon stream emitted by each particle.5, 7 The
most straightforward analysis of this stream, intensity binning, quantifies the number of photons detected during a series of integration times, T , and monitors how the emission intensity changes as a function of time (Fig. 2-1a). As discussed in a number of reviews, intensity binning has been used to study the photon emission rate, the photostability of the emitter, and the timing of fluctuations in the intensity of single nanocrystals.33–35 Here, we highlight several key findings and their implications.
Single QDs exhibit far greater overall photostability than many of their molec-ular dye counterparts. Under ambient conditions, many single molecules emit no more than ∼106 photons before they “photobleach” irreversibly.37 However, during early investigations, individual CdSe QDs were found to be much more photostable, emitting upwards of 109 photons before irreversibly bleaching.38
Despite their photostability, the emission from a single QD was found to exhibit nearly binary quenching and revival of intensity (Fig. 2-1b).39 A similar
“blink-ing” phenomenon had been previously observed in single dye molecules.40 In these
molecules, “on” events and “off” events could be distinguished by applying an appro-priate threshold to the binned intensity traces. This analysis showed that the proba-bility densities for the distribution of on- and off-event durations followed exponential or biexponential decays, reflecting the characteristic timescales for the intermittency process. For dyes, blinking has been understood in terms of intersystem crossing between the singlet excited state and a manifold of non-emissive triplet states.40, 41
In contrast, the on- and off-times of single nanocrystals were distributed across many orders of magnitude in time, giving rise to probability densities that were best described by a power law: P (τon/off) ∝ τon/offα .
38, 42, 43 The on- and off-time
distri-butions followed the same power-law exponent, though depending on experimental conditions such as excitation intensity or temperature, the on-time power law could show a truncation, or cut-off, at longer times (Fig. 2-1c).36, 44 Taken together, these
observations implied that blinking in nanocrystals cannot be described by simple tran-sition rates and that the underlying mechanism of blinking must be more complicated than intersystem crossing to a dark state. Blinking was initially believed to result from the non-radiative Auger-like interaction between the photogenerated electron-hole pair and a spectator charge within the core states.45 However, recent studies have challenged this hypothesis46, 47 and have suggested that blinking arises from the
interplay between the exciton and additional charges in the system (photogenerated or not), carrier trap states, and other non-radiative pathways.34, 35, 48, 49
The power-law statistics of single QD blinking have far-reaching implications for QD applications. Because individual QDs often exhibit on-time distributions with a truncation timescale much shorter than their off-time distributions,36, 50 an ensem-ble of QDs will undergo photodarkening under cw illumination (Fig. 2-1d, blue). In other words, the emission intensity of an ensemble of QDs will decrease to an equilib-rium value because, for any given nanocrystal, long off-times occur more frequently than long on-times. This effect, also referred to as statistical aging, is an intrinsic
and purely statistical photodarkening process and is therefore reversible (Fig. 2-1d, blue).50, 51 This result illustrates the intimate connection between single-molecule
properties and ensemble photodynamics.
There have been considerable synthetic efforts toward mitigating the effects of blinking. In the past five years, advancements in the synthesis of CdSe core/shell particles have led to particles with strongly suppressed blinking.15, 52–54 Characterized
by short off-time durations and long on-time durations, these particles were found to possess high on-time fractions, unusual exponents in their on- and off-time power-law distributions, and a lack of intrinsic photodarkening (Fig. 2-1d, red).15 This blinking
suppression was initially believed to be largely due to the thickness of the CdS shell, however recent studies suggest that the structure at the core/shell interface may play a greater role.15, 52, 55 Despite these tremendous strides in nanocrystal synthesis,
the physical origin of blinking and the mechanism of its suppression remain open questions.56
2.1.1
Limitations of Intensity Binning
Intensity binning methods are excellent for many investigations because they can access timescales ranging from milliseconds to thousands of seconds and probe signals over a large dynamic range. However, this method alone is insufficient for fully understanding the physical mechanisms underlying QD emission. First, analysis of on-and off-times requires the use of thresholds, which can introduce artifacts.57 Moreover, all binning methods suffer from the same fundamental drawback: they cannot resolve individual photon detection events. An intensity trace can show, for example, that in a given 50 ms interval, 200 photons were emitted by the particle. However, it cannot report on the timing between individual excitation and emission events nor can it show how these photons were temporally dispersed inside that integration time. To address this fundamental limitation of integrated binning techniques, we turn to time-resolved photoluminescence and photon-correlation techniques, which analyze the precise arrival times of emitted photons.
a)
Excitation Pulse QD Emission t1 t2 t3 t4b)
Rhodamine 640 0 10 20 30 40 50 Time (ns) 100 10-1 10-2 10-3 PL Intensity (norm)Figure 2-2: a) The photoluminescence (PL) decay is the histogram of photon arrival times relative to an excitation pulse. The shape and rate of the decay provides insight into the radiative and non-radiative processes of the single emitter. b) The PL decay of most organic dyes is monoexponential, reflecting time-invariant first-order recombination kinetics (Adapted from Ref.62 with permission. Copyright 2005 MIT).
2.2
Photoluminescence Decay
Unlike intensity binning, which reveals dynamics that span many fluorescence cycles, time-resolved photoluminescence (PL) decay measurements examine the processes that affect individual emission events. The PL decay kinetics of single molecules are typically measured using time-correlated single-photon counting (TCSPC), which determines the elapsed time between an excitation pulse and the subsequent detection of a single photon emitted by the sample (Fig. 2-2a). The PL decay trace is a histogram that is built up over many excitation pulses, with each one contributing at most one stochastically-determined arrival time. In practice, TCSPC allows for the measurement of picosecond-to-microsecond–scale temporal dynamics regarding the emission process.58, 59
Processes that affect radiative and non-radiative relaxation manifest themselves in the rate and functional form of the PL decay.60, 61 Figure 2-2b shows the PL
decay for the organic dye Rhodamine 640 in solution.62 In this case, the PL decay is monoexponential, indicating time-independent first-order relaxation kinetics with a time constant given by the lifetime of the excited state.31 In contrast, PL decay measurements of single nanocrystals have revealed complexities often unseen in the world of molecular dyes. We summarize below two single-QD PL decay studies: the first explores the more complex decay dynamics of multiexcitons and the second demonstrates how the excitonic fine structure results in multiple radiative pathways.
n = 0.06 Time (ns) 0 100 200 300 PL Intensity (norm) Increasing Excitation Intensity 10-4 10 0 10-1 10-2 10-3 n = 0.23 n = 0.83 n = 2.49 n = 10.0
Figure 2-3: Upon increased excitation, the PL decay of a single nanocrystal develops a rapid decay on sub-nanosecond timescales. This is a signature of emission from multiexcitons. Here, n is the average number of excitons per nanocrystal (Adapted from Ref. 62 with permission. Copyright 2005 by The American Physical Society).
2.2.1
Multiexciton Emission
In a departure from the typical photophysics of organic dyes, single semiconductor nanocrystals are capable of supporting multiple excitations concurrently.63 In this way, nanocrystals are akin to bulk semiconductors, where free excitons can interact to give rise to bound multiple-excitonic states, or multiexcitons.64 Multiexcitons have decay pathways unavailable to single excitons, including non-radiative Auger-like channels.65 As a result, multiexcitonic recombination dynamics can be distinct from those of single excitons and, if they are sufficiently emissive, their photophysics can be extracted from the PL decay of single nanocrystals.
Figure 2-3 shows the change in the PL decay of a single nanocrystal at room tem-perature upon increased excitation intensity.66, 67 At higher excitation intensities, the PL decay develops a distinct component at much faster timescales. The intensity de-pendence of the fast component is reversible, eliminating the possibility that it arises from photodegradation. Instead, this feature arises from multiexcitons, which are more prevalent at higher excitation intensities due to the increased probability of se-quential absorption. The rapid decay of the multiexcitonic emission is consistent with previous demonstrations of enhanced Auger decay in quantum-confined systems.65
PL I nte ns ity (norm) Time (ns) 0 500 1000 Increasing Temperature 1500
Figure 2-4: The PL decay curves for a single QD measured at 2.7, 10, 12, 15, 18, and 28 K show that the lifetime decreases with increasing temperature, an indication of thermal mixing between a low-energy dark excitonic state and a higher-energy bright state (Adapted from Ref. 68 with permission. Copyright 2003 by the American Physical Society).
2.2.2
Excitonic Fine Structure
The PL decay lifetime of an ensemble of CdSe nanocrystals at cryogenic temperatures was measured to be hundreds of nanoseconds, much longer than bulk CdSe.69 This
observation clashed with conventional thinking: the radiative rate was expected to increase upon confinement of the electron-hole pair. Moreover, the lifetime of the PL decay increases by over an order of magnitude as the temperature is lowered from 26 K to 2 K,68, 70 a phenomenon not commonly seen to such an extent in organic
dyes.71 Measurements of single nanocrystals have confirmed that the lengthening of
the PL lifetime is an intrinsic property, not a diffusion effect (Fig. 2-4).68 Though
initially believed to be due to surface effects,70, 72 this result has been explained by
the electronic fine structure of CdSe nanocrystals.73, 74
The lowest-energy exciton, or ground-state exciton, of CdSe is eight-fold degener-ate.75 Calculations predict a lifting of this degeneracy to five states due to the effects of the nanocrystal crystal field, the particle shape anisotropy, and the electron-hole ex-change interaction.75 Notably, these calculations show that within the fine structure, the lowest-energy state is optically inactive or “dark” and the second-lowest energy state is optically active or “bright”. Thus, the temperature dependence of the PL
decay lifetime can be attributed to thermal relaxation to the lowest-energy optically-inactive state, which has a slow radiative recombination time because the transition is spin-forbidden.76–78 This process is reminiscent of low-temperature phosphorescence
in some organic molecules. Using temperature- and magnetic-field dependent mea-surements, single-nanocrystal investigations have robustly corroborated the theory of excitonic fine structure in CdSe particles.68, 79
2.3
Combining Intensity Binning and PL Decay
Thus far, our discussion of PL decay measurements has focused solely on time-averaged measurements. That is, the PL decay trace contains all of the photons emitted from the single nanocrystal. However, single-photon detection events can also be monitored in absolute time, which captures both their timing with respect to the excitation pulse that created it and its relative position in the photon stream. This technique allows sub-histograms to be constructed from selected portions of the photon stream, making it possible to determine whether decay dynamics are corre-lated with other observables, such as integrated intensity or time.80–82 We summarize
below several key results that highlight the additional complex physics that can be probed through the application of this technique to single nanocrystals.
2.3.1
Fluctuating Non-Radiative Rates and Single-Nanocrystal
Quantum Efficiency
Ensembles of nanocrystals typically exhibit complex, multiexponential PL decays. However, it was unclear whether this was due to heterogeneity between nanocrystals, multiple emission processes within individual particles, or complex temporal dynamics in single nanocrystals. As such, measurements on single nanocrystals have been necessary to distinguish between these possibilities.
Studies of single CdSe/ZnS core/shell particles showed that although PL decay dynamics fluctuated over slow timescales (seconds),83 they approached
monoexpo-a)
b)
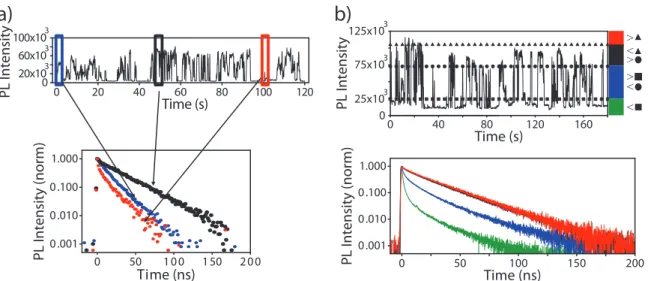
Time (s) 0 20 40 60 80 100 120 PL Intensity 0 20x103 60x103 100x103 Time (ns) 0 50 100 150 200 0.001 0.010 0.100 1.000 PL Intensity (norm) Time (s) 0 PL Intensity 0 25x103 75x103 125x103 Time (ns) 0 50 100 150 200 > > > < < < 0.001 0.010 0.100 1.000 PL Intensity (norm) 40 80 120 160Figure 2-5: a) The PL decay of single NCs is found to vary with the emission intensity. Although decay dynamics are nearly monoexponential over short time windows, b) they are multiexponential when averaged over long times at all but the highest emission intensities. This suggests slow fluctuations in the non-radiative rate, while the consistent monoexpo-nential decay at peak emission intensities reflects purely radiative decay (Adapted from Ref. 62 with permission. Copyright 2004 ).
nential behavior during sufficiently short integration times (Fig. 2-5a). At the same time, PL decays generated from all photons emitted at moderate intensities were multiexponential (Fig. 2-5b),80 indicating that the effective non-radiative rate was
time-varying. Intimately tied to the blinking process, these variations were attributed to interactions of the exciton with its environment.80, 83
Notably, PL decay traces constructed selectively from photons detected when the integrated intensity was >90% of the peak intensity were not only reliably mono-exponential, but yielded a consistent decay time constant – even between particles from different synthetic batches or sizes (Fig. 2-5b).80 This led to the assertion that
the decay dynamics observed when a single CdSe/ZnS dot is brightest reflects the intrinsic radiative decay.80
The consequence of this observation, as later confirmed directly in measurements of single nanocrystals exposed to changing dielectric environments, is that the quan-tum efficiency of emission when CdSe/ZnS particles are at their brightest is nearly unity.84, 85 In fact, the low ensemble quantum yields of nanocrystals in solution have
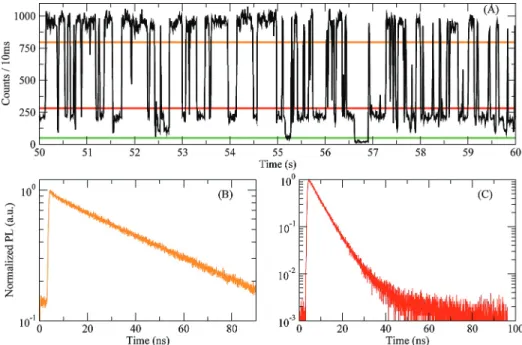
Figure 2-6: a) The emission intensity trace of a single CdSe/CdS nanocrystal shows three discrete intensity levels. b) The PL decay of the highest intensity level is a monoexponential decay with a lifetime of ∼44 ns. c) The PL decay of the “grey” state is biexponential with average lifetime of ∼5.2 ns (Reprinted with permission from Ref. 87. Copyright 2009 American Chemical Society).
such, the synthesis of nanocrystal batches possessing near-unity solution quantum yield was predicted to be possible, and indeed, has been achieved.14, 15
2.3.2
Trion Emission
Although the general mechanism of blinking is still under debate, single-nanocrystal studies have identified a subclass of intensity fluctuations with a distinct physical origin. As shown in Figure 2-6, the emission trace of single CdSe/CdS nanocrystals can exhibit a “grey” state, with a well-defined intensity between those of the “on”-and “off”-states.87 Additionally, the PL decay of the grey state has a shorter lifetime than the on-state. These grey states have been attributed to emission from the trion – an exciton in the presence of a spectator charge in the core states of the nanocrys-tal.54, 87–89 Therefore the shortened PL decay lifetime results from the additional
electron-hole recombination channels.
electrochemical cells.90 In a recent study, it was found that PL decay lifetimes in
single CdSe/CdS with very thick shells (16–19 monolayers) could vary significantly without having a discernible effect on the emission intensity.82 Here, the thick shell
was proposed to suppress the non-radiative Auger decay mechanism in the negative trion, making it as emissive as the neutral exciton. Thus, the intensity remains constant while the PL decay lifetime shortens upon trion formation. This result shows that trions need not necessarily be “grey”.
Trion formation was once believed to be the primary mechanism responsible for blinking.45 However, Figure 2-6 shows that additional mechanisms are involved.87 While the “grey” state has been convincingly explained by trion formation, these and other investigations have concluded that trions cannot be responsible for the “off” state.46, 47, 91, 92
2.3.3
Type A and Type B Intensity Fluctuations
An additional way in which PL decay measurements can be combined with intensity binning is using a “fluorescence lifetime-intensity distribution” (FLID) diagram. As shown in Figure 2-7, it is a two-dimensional histogram showing the correlation be-tween intensity and PL decay lifetimes.93 This analysis was recently applied to single-nanocrystal electrochemical studies. Upon application of different potentials, two types of fluorescence intensity dynamics were observed in single CdSe/CdS nanocrys-tals with thick shells (7–9 monolayers).81
The first type of intensity fluctuation, called “Type A”, occurred when changes in the PL decay lifetime tracked that of the emission intensity (Fig. 2-7a).81 These
dynamics were attributed to negative trion formation. In contrast, the second type of fluctuation, called “Type B”, occurred when the PL decay lifetime was independent of changes in intensity (Fig. 2-7b). It was argued that these dynamics occurred when a rapid, non-radiative channel captured “hot” photoexcited electrons before they could relax. In this scenario, photons are only detected when excitons decay normally, leaving the lifetime unaffected. This hot electron trapping process was offered as a possible mechanism responsible for the “off”-state in blinking.
0 1 2 3 4 5 0 5 10 15 20 25 0 1 2 3 4 5 PL intensity (counts ms –1) Average lifetime (ns) V = 0 V Average lifetime (ns) PL intensity (counts ms –1 ) Time: 4 s 0 5 10 15 20 25 0 1 2 3 4 5
a)
0 2 4 6 8 10 0 5 10 15 20 25 0 2 4 6 8 0 2 4 6 8 PL intensity (counts ms –1) X0 V = +0.8 V Average lifetime (ns) PL intensity (counts ms –1 ) B-type Average lifetime (ns) 0 8 16 24 Time: 4 sb)
Figure 2-7: a) For “Type A” fluctuations, the PL decay lifetime changes in parallel with the emission intensity. b) For “Type B” fluctuations, the PL decay lifetime is unchanged with changes in the emission intensity (Adapted from Ref. 81 with permission from Macmillan Publishers Ltd: Nature, 2011).
However, a recent report has challenged this mechanism and suggested a different surface-dependent non-radiative process.92 These authors provide corroborating
evi-dence that photoinduced charging, involving the reversible trapping of the “hot” hole by surface states, does indeed lead to “grey” states. However, they suggest that the “off”-state results from occasional, reversible chemical oxidation of a surface species by the photogenerated hole. Additional mechanisms have been proposed for the “off”-state in single nanocrystals48 and further investigations are necessary to resolve the physical processes responsible for all intensity fluctuations in nanocrystals.
PL decay measurements, which resolve the temporal relationship between an ab-sorption event and the subsequent emitted photon, probe the nature of the emissive state. This methodology becomes even more powerful when combined with other analytical tools such as intensity binning. As nanocrystals further evolve synthet-ically and our ability to manipulate them in environments such as electrochemical cells becomes more sophisticated, these techniques will continue to unearth new pho-tophysics.
2.4
Photon Correlation
In PL decay measurements, the arrival times of photons are compared to their corre-sponding photoexcitation event. When PL decay is combined with intensity binning, the short-time dynamics of exciton recombination can be related to long-time dynam-ics affecting the nanocrystal. However, this broad range of dynamical information can also be accessed by analyzing the relative arrival times of photons within the stream itself. This is the essence of photon correlation, a means for analyzing emission dy-namics over the complete range of relevant timescales without the use of binning or thresholds.
Photon correlation analyzes the photon stream in terms of the time spacing be-tween pairs of photons. This is typically done by calculating the normalized correla-tion funccorrela-tion:
g(2)(τ ) = hI(t)I(t + τ )i
hI(t)i hI(t + τ )i (2.1) for an intensity signal I(t) and temporal delay τ . Depending on whether I(t) is treated as a continuous or discrete signal, g(2)(τ ) can be interpreted in two different
ways.
If I(t) is treated as a continuous, analog signal, g(2)(τ ) reflects the tendency for
I(t) to have changed after some delay τ . The correlation operation is related to the convolution operation in that the product of two signals is compared as a function of their relative delay. Therefore, it is useful to think of g(2)(τ ) as mapping the timescale at which I(t) no longer resembles itself. This concept will be useful for interpreting the spectral correlation function discussed later in the context of photon-correlation Fourier spectroscopy.
If I(t) is treated as a discrete, digital signal, g(2)(τ ) reflects the tendency for photons to be detected after some relative delay τ . In photon correlation, g(2)(τ ) is
proportional to the histogram of photon pairs with time τ between them. Therefore, an appropriate way of thinking about g(2)(τ ) is as the conditional probability: given
a)
b)
τ1 τ2 τ3 τ4 τ5 τ6 Coincidence Counts 100 200 300 -4 -2 0 2 4 Time Delay τ (µs) 0Figure 2-8: a) In photon correlation, the temporal separations between pairs of photons in the photon stream are analyzed. b) The unnormalized intensity autocorrelation function for a single PbS/CdS nanocrystal under CW excitation shows the “antibunching dip”, where the probability of detecting two photons simultaneously is reduced. Here, the intensity correlation function at τ → 0 does not reach zero because of the presence of background and because this NC is an imperfect two-level quantum mechanical emitter (Adapted from Ref. 94 with permission. Copyright 2012 American Chemical Society).
at some time τ later?95 We note that this is not to be confused with the so-called
“waiting time distribution”, which is the probability density that the next photon is detected at time τ later.95, 96
Physical phenomena can be revealed by the structure of g(2)(τ ). If intensity
fluc-tuations have no characteristic timescale, or if photon arrivals are independent from one another (i.e. they follow Poisson statistics), then g(2)(τ ) = 1. In the
intensity-correlation picture, this either means that the signal is unchanging or that fluctuations are no different across all timescales. In the photon correlation picture, the probabil-ity of detecting a second photon is the same for all τ after the first detection event.95, 96 Therefore, deviations from unity in g(2)(τ ) indicate that photons within the stream
are not independent from one another, but are related by some physical mechanism.
2.4.1
Broad Timescale Dynamics: Blinking
Intensity-correlation analysis has long been applied to the blinking of single dye molecules. In these studies, the decay of g(2)(τ ) can be modeled with a summation of
well-defined timescales.97, 98 However, this technique is less applicable to
nanocrys-tal blinking because the power-law blinking statistics span such a large range of timescales. As such, individual g(2)(τ ) measurements tend to be highly irreproducible
and distinct decay timescales are difficult to resolve.99 Moreover, because a single
cor-relation function is used to compare all photons in the stream, it cannot be used to study the distributions of “on”- and “off”-times.
2.4.2
Antibunching of Emission from Single Emitters
While intensity correlation and photon correlation are nearly identical in mathemati-cal usage and interpretation, there is one situation where the distinction is paramount: the limit of τ → 0. In this limit, the quantum mechanical nature of fluorescent emit-ters renders the intensity-correlation interpretation inaccurate.95
If the emission from a single emitter were a classical electromagnetic field, lim
τ →0g
(2)(τ ) = hI(t) 2i
hI(t)i2 = C (2.2)
where C is a non-zero constant. However, for a two-level quantum mechanical emitter, lim
τ →0g (2)
(τ ) = 0 (2.3)
That is, the probability of detecting two photons simultaneously from a single quan-tum mechanical emitter is identically zero.100–103
The Hanbury Brown and Twiss dual-detector setup (Fig. 2-9) is used to char-acterize such a photon stream and can illustrate this antibunching effect. Here, an emitted photon can be detected either by detector 0 or detector 1, but not by both at the same time. Therefore, under continuous-wave (CW) excitation, antibunching reveals itself as a dip in the cross-correlation of the two detectors as τ → 0 as in Figure 2-8b.94, 104
Antibunching can also be observed in photon-correlation measurements using pulsed excitation. These pulsed correlation measurements have the advantage of
Objective Laser Sample APD 0 APD 1 Correlator Emission Filter
Figure 2-9: The Hanbury Brown and Twiss correlation setup is used in many photon-correlation studies. An emitted photon can be detected either by APD0 or APD1, but not by both at the same time. While any single-photon detector may be used, avalanche photodiodes (APDs) were used in all measurements in this thesis.
associating photon detection events to particular excitation events.105, 106 Here, the
timing between detected photons indicates whether they were emitted from the same excitation pulse or different excitation pulses. As such, g(2)(τ ) appears as a series of
peaks for each successive excitation (Fig. 2-10). The side peaks at integer multiples of the repetition time are the result of single-photon events, where two distinct exci-tation pulses have produced two emission photons. The absence of a center peak at τ → 0 demonstrates that the emitter cannot emit two photons after a single excitation pulse.
2.4.3
The Antibunching Signal of Single Nanocrystals
Re-flects Multiexciton Recombination
Antibunching has often been used as a litmus test for the presence of a single quan-tum mechanical emitter because classical signals cannot produce an initial rise in their g(2)(τ ).101 Incomplete antibunching can be an indication of multiple radiative
processes in a single emitter, or the presence of multiple emitters. Many organic dyes have sufficiently simple photophysics that the degree of antibunching directly reflects the number of emitters present.107, 108 However, the existence of multiexciton emission
in single nanocrystals necessitates an extension of this interpretation.
As discussed in Section 2.2.1, nanocrystals can support multiexcitons, which can be created via sequential absorption events. Consequently, a single nanocrystal can be
understood as a collection of interacting two-level systems, which may emit multiple photons after a single excitation pulse. As such, the extent of antibunching in the emission from a single nanocrystal is controlled by the radiative quantum efficiency of the multiexcitons.106
We consider a pulsed photon-correlation measurement in the limit of low excitation intensity, where triexcitons and higher-order excitons are unlikely to be created. Here, the ratio of the integrated areas of the center and side peaks of g(2)(τ ), which we
define as g0(2), is quantitatively related to the ratio of biexciton and exciton quantum yields:109 g0(2) = hn (n − 1)i hni2 ≈ ηBX ηX (2.4) where n is the number of photons emitted by the nanocrystal.
This result shows that the use of antibunching as a litmus test for the presence of a single nanocrystal is unwarranted.109 Moreover, it shows that photon correlation
can be used as a direct window into the recombination dynamics of biexcitons in nanocrystals – a species that is difficult to spectrally resolve from the single exciton110
and temporally resolve from higher-order excitons. Until this recent result, biexcitons had remained relatively unstudied at the single-nanocrystal level.
2.4.4
Variability of Biexciton Quantum Yields
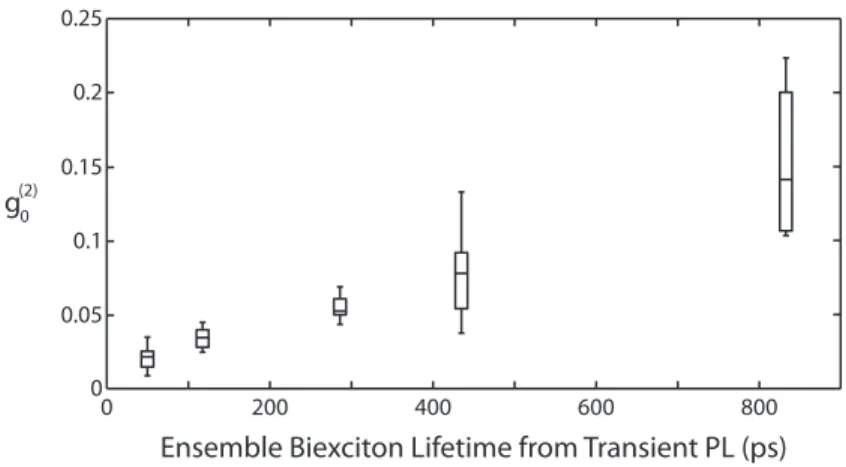
In the initial report of this pulsed photon-correlation technique applied to single core/shell nanocrystals, the authors observed significant heterogeneity in the biexci-ton quantum yield between particles within a synthetic batch (Figure 2-11).109 They
attributed the variations to slight differences in structure between individual par-ticles that affected Auger recombination, the non-radiative mechanism believed to be responsible for quenching biexciton emission. We discuss below two reports that corroborate this finding and further investigate the mechanisms of biexciton recom-bination.
Combining the pulsed photon-correlation method and single-nanocrystal PL spec-troscopy, the first study reported instances of near-unity biexciton quantum yields in
g (2) (τ) -trep 0 trep hν hν hν hν hν hν
τ = t
2- t
1Figure 2-10: This cartoon illustrates the shape of g(2)(τ ) for a single nanocrystal under pulsed excitation. Here, the side peaks (τ = ± trep) correspond to photon pairs from
separate excitation pulses, while the center peak (τ = 0) corresponds to photon pairs from a single excitation pulse. The presence of a peak at τ = 0 indicates emission from multiexcitons. In the limit of low excitation intensity, the ratio of the areas under the center and side peaks is equal to the ratio of biexciton and exciton quantum yields (Adapted with permission from Ref. 109. Copyright 2011 American Chemical Society).
single CdSe/CdS particles.111 Extremely large dot-to-dot variations were observed for the biexciton quantum yield, even though all particles displayed strongly suppressed blinking. Reasoning that Auger recombination was the mechanism quenching biex-citon emission, the authors suggested that blinking suppression of the exbiex-citon must originate from a different mechanism, possibly reduced rates of carrier trapping or migration.
The second study combined photon correlation with intensity binning to probe the relationship between blinking and biexciton quantum yields.112 A strong correlation
between biexciton quantum yields and blinking was expected if the same process, Auger recombination, were responsible for both. However, only a weak correlation between biexciton quantum yield and on-time fraction was found for single CdSe/CdS particles. This further supported the hypothesis that biexciton quenching and blink-ing do not share the same mechanism. These authors proposed a mechanism where biexciton recombination occurs through a combination of Auger- and trap-assisted pathways.
0 0.05 0.1 0.15 0.2 0.25 200 400 600 800 0 g(2) 0
Ensemble Biexciton Lifetime from Transient PL (ps)
Figure 2-11: The biexciton quantum yield can vary substantially over multiple nanocrystals within the same synthetic batch. The biexciton quantum yield scales with the biexciton lifetime (Adapted from Ref. 109 with permission. Copyright 2011 American Chemical Society).
2.4.5
New Directions for Photon-Correlation Studies of
Mul-tiexcitons in Single Nanocrystals
As we have discussed, photon-correlation techniques provide unique insight into biex-citon recombination dynamics at the single-nanocrystal level. These methods will continue to make important contributions towards our understanding of fundamental nanocrystal physics and more complicated nanoscale systems. For example, a topic that has been of interest for several years is the interaction between single nanocrys-tals and metallic surfaces.113 Several recent investigations have reported changes in
the photon statistics of single core/shell particles in proximity to gold or silver nanos-tructures or films.114–117 Each study reported modifications of both the radiative and
non-radiative rates for the exciton and biexciton, with the outcome being an enhance-ment in the ratio between the center and side peaks. One study has even reported strong photon bunching, where photons are more likely to be emitted in groups than individually – a radical change in the photon statistics.114
Moreover, advances in photon-counting technologies are allowing for even more sophisticated analyses of the photon stream. Rather than merely looking at the co-incidences of photons from a given excitation pulse, a few recent investigations have explored the precise timing of all photons relative to their excitation pulse.116 This
allows one, for instance, to determine if simultaneously detected photons originated from biexcitonic recombination in a single nanocrystal or from a cluster of parti-cles.118 These types of approaches offer a window into the recombination dynamics of
biexcitons separate from that of the exciton and will likely continue to be explored. Through increasingly sophisticated methods of determining the quantity and tim-ing of photons, we have learned a tremendous amount about the unique emission properties of single nanocrystals. However, we have yet to discuss an orthogonal axis in the analysis of the photon stream that provides even more information: the en-ergy axis. Our understanding of the photoluminescence spectra of colloidal quantum dots has benefited tremendously since the application of single-molecule techniques to their study.