HAL Id: hal-03035002
https://hal.archives-ouvertes.fr/hal-03035002
Submitted on 2 Dec 2020
HAL is a multi-disciplinary open access
archive for the deposit and dissemination of sci-entific research documents, whether they are pub-lished or not. The documents may come from teaching and research institutions in France or abroad, or from public or private research centers.
L’archive ouverte pluridisciplinaire HAL, est destinée au dépôt et à la diffusion de documents scientifiques de niveau recherche, publiés ou non, émanant des établissements d’enseignement et de recherche français ou étrangers, des laboratoires publics ou privés.
Experimental Assessment of the Annual Growth Ring’s
Impact onthe Mechanical Behavior of Temperate and
Tropical Species
Claude Feldman Pambou Nziengui, Jonas Turesson, Rostand Moutou Pitti,
Mats Ekevad
To cite this version:
Claude Feldman Pambou Nziengui, Jonas Turesson, Rostand Moutou Pitti, Mats Ekevad. Experi-mental Assessment of the Annual Growth Ring’s Impact onthe Mechanical Behavior of Temperate and Tropical Species. Bioresources, North Carolina State University, 2020. �hal-03035002�
PEER-REVIEWED ARTICLE
bioresources.
com
1
Experimental Assessment of the Annual Growth Ring’s
2
Impact to the Mechanical Behavior of Temperate and
3
Tropical Species
4 5
Claude Feldman Pambou Nziengui,a,b,* Jonas Turesson,c Rostand Moutou Pitti,a,d and 6
Mats Ekevad c 7
8
This study presents an innovative experimental protocol linking a
9
nondestructive (on computed tomography scanner) and destructive
10
approach (bending test on electrostatic press). This study aims to
11
evaluate the annual growth ring’s impact on the mechanical behavior of
12
wood. The tests were carried out on temperate specimens (Pseudotsuga
13
menziesii and Abies alba Mill) from the Massif Central Region of France
14
and tropical specimens (Aucoumea klaineana Pierre, Milicia excelsa, and
15
Pterocarpus soyauxii) from Gabon. The connection between the
16
mechanical parameters, taken from these tests and their structural
17
characteristics are also highlighted. Based on these results, a database
18
was formed of the annual growth ring’s impact on the mechanical
19
characteristics of these species. The results show that there is a link
20
between the annual growth ring, and the mechanical and physical
21
characteristics of the species. The number and width of the earlywood
22
ring and its mechanical properties are also investigated for each type of
23
species. This comparison and the link highlighted was possible due to
24
the study of the impact of dry density’s specimens, considered in this
25
work as an adjustment parameter on the study of the mechanical
26
behavior of these species.
27 28
Keywords: Tropical species; Temperate species; Congo basin forest; Massif central forest; Bending test
29 30
Contact information: a: Université Clermont Auvergne, CNRS, Institut Pascal, BP 10448, 63000
Clermont-31
Ferrand, France; b: USTM, Ecole Polytechnique de Masuku (EPM), LareVa Bois, BP 901 Franceville
32
Gabon; c: Luleå University of Technology, Division of Wood Science and Engineering, Department of
33
Engineering Sciences and Mathematics, Forskargatan 1, 931 87, Skellefteå, Sweden; d: CENAREST, IRT,
34
BP 14070, Libreville, Gabon; *Corresponding author: pclaudefeldman@gmail.com
35 36 37 INTRODUCTION 38 39
Predicting the behavior of wood under mechanical or environmental stress is 40
essential to improve the design and durability of timber structures (Gérard et al. 2011). 41
This refers to the understanding of the various physical and mechanical characteristics of 42
wood. This understanding is affected by the multitude of climates encountered 43
throughout the world, which attribute to each species endemic characteristics proper to 44
the environment in which the species is found (Manfoumbi Boussougou 2012). One 45
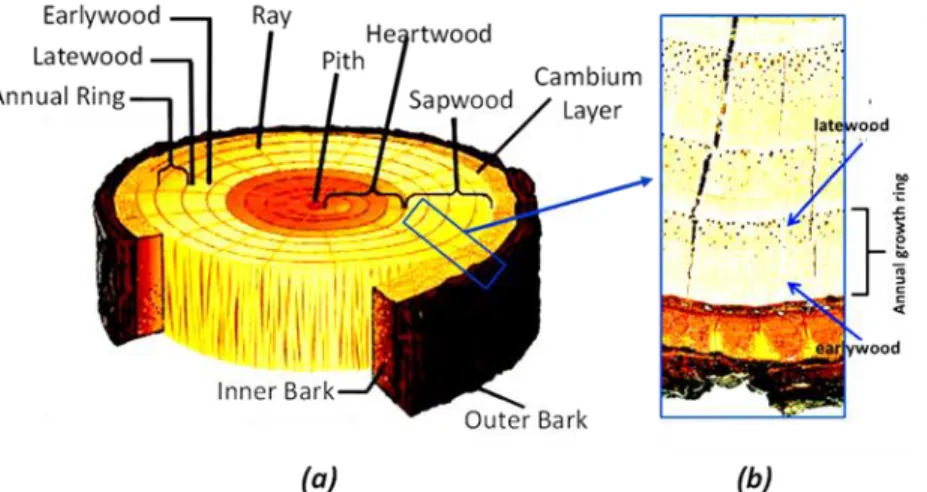
explanation of these intrinsic characteristics could be given by the anatomical structure 46
for each species (Fig. 1). 47
48 49 50 51
PEER-REVIEWED ARTICLE
bioresources.
com
52
Fig. 1. (a) Cross-section of a tree trunk and (b) annual growth ring of wood
53 54
The microscale structure in wood globally affects its mechanical behavior. This 55
can be investigated due to advancements in theoretical, numerical, and experimental 56
approaches. Gershon et al. (2010) have shown that it is necessary to know the microscale 57
structure ofpalmetto wood to be able to optimize its fracture toughness. Another work on 58
palmetto wood (Saavedra Flores 2016) explains that there are influences of several 59
micro-structural features (such as cellulose content and its crystallinity, the microfibril 60
angle, and the cell-wall thickness of micro-fibers) on the Young modulus and density. 61
The growth of annual rings affects the mechanical behavior of wood (Miksic 2013). 62
Wood is a heterogeneous, anisotropic, and hygroscopic natural composite material, with 63
high strength and stiffness relative to its weight (Mishnaevsky and Qing 2008; Bahar 64
2019). By starting from these hypotheses, Stanzl-Tschegg (2006) noted that the structure 65
of wood is highly optimized for the needs of living trees. This does not mean that wood is 66
optimized for usage in constructions where this article is focusing. The study by Morales-67
Conde and Machado (2017) assesses the cross-section for variation of timber bending of 68
modulus of elasticity and brings more information linked to our work. The authors show, 69
despite the stress waves approach used, a great correlation between the cross-sectional 70
variation and the modulus of elasticity of the wood studied, which roughly fits with the 71
aims of this study. Based on previous studies (Jaskowska-Lemańska and Wałach 2016; 72
Ramage et al. 2017; Zeller et al. 2017; Abdelmohsen et al. 2018), it is logical to say that 73
the mechanical behavior of wood is based on its micro-structural features, for example 74
content of cellulose, fibril angles, and the annual growth rings. 75
This work aims at performing an experimental comparative study on five species 76
with different physico-mechanical characteristics. The study is made possible due to a 77
specific experimental approach built by connecting annual growth rings with global 78
mechanical behavior by determining their intrinsic mechanical characteristics. Five 79
species were studied: two European temperate species from the Massif Central in France, 80
Douglas fir (Pseudotsuga menziesii) and White fir (Abies alba Mill); and three tropical 81
species from Gabon, Okume (Aucoumea klaineana Pierre), Iroko (Milicia excelsa) and 82
Padouk (Pterocarpus soyauxii). The difference between the chosen species is the climate 83
of their habitat. In Gabon, for example, the climate shows a mean annual rainfall of 1900 84
mm, a mean relative humidity of 85%, and mean annual temperature of 27 °C (Medzegue 85
et al. 2007; Pambou Nziengui et al. 2017; Engonga Edzang et al. 2020). This kind of 86
region has two types of seasons: a six months’ dry season and a six months’ rainy season. 87
PEER-REVIEWED ARTICLE
bioresources.
com
During the dry season, almost no rainfall occurs in comparison to the rainy season when 88
most of the rainfall occurs. Thus, the quantity of water absorbed by the tree during the 89
rainy season becomes very important for the growth of the tree. 90
To date, no study has compared tropical species (African tropical region) and 91
temperate species regarding the link between the growth of annual rings and the 92
mechanical properties. The reason for this concern is that the tropical species has a 93
continuous growth of annual rings during the year (Manfoumbi Boussougou 2012; 94
Ramage et al. 2017) and this is not the case for the studied temperate species. Both the 95
tropical and temperate species are commonly used in structure for heavy and light 96
frameworks, glulam, paper pulp, fiber panels, in cooperage, packaging, maritime work, 97
and luxury furniture (Adamopoulos 2009; Treml and Jeske 2012; Sopushynskyy 2017). 98
In France there were more than 170 Mm3 of white fir and 93 Mm3 of Douglas fir in 2009 99
(Pambou Nziengui et al. 2019). The chosen tropical species are the most widespread 100
species in the tropical forest of Gabon and also among the most exported and used 101
species in the field of timber structures (Odounga et al. 2018). 102 103 104 EXPERIMENTAL 105 106 Wood specimens 107
The wood specimens were cuboid shaped with the approximately dimensions of 108
200×10×10 mm3 (Fig. 2). These specimens were cut following the fiber direction (in the 109
longest direction). A total of 125 clear wood specimens was obtained. The specimens of 110
temperate species were taken from collapsed beams used in an earlier study of creep tests 111
(Pambou Nziengui et al. 2019; Tran et al. 2018). The specimens of tropical species were 112
cut from butt logs at an approximate position of one meter above the roots of the standing 113
tree (Odounga et al. 2018). To equalize the moisture content (MC) of the specimens, the 114
specimens were stored in a climate chamber for 48 h. The temperature and the relative 115
humidity in the climate chamber were set to 20 °C and 64.7%, respectively. Table 1 116
shows the total number of specimens and the statistical mean of the principal physical 117
characteristics for each group before the experimental campaign. 118
119
Table 1. Number of Specimens and Physical Characteristics for Each Tested
120
Species Group with Coefficient of Variation (COV) in Parentheses 121
Species Name No. MCmean [%] ρdry, mean [kg/m3]
Temperate Douglas fir DF 30 9.8 (11.1%) 563 (4.5%)
White fir WF 48 9.9 (13.6%) 447 (8.1%)
Tropical
Iroko I 17 9.0 (17.8%) 582 (13.8%)
Padouk P 15 8.3 (13.4%) 733 (3.0%)
Okume O 15 10.3 (15.7%) 505 (4.1%)
No.: number of specimens; MCmean: mean moisture content; dry, mean: mean dry density
122 123
To distinguish the earlywood and latewood, which make up the annual growth 124
ring, the specimens were scanned in a computed tomography scanner (CT-scanner). The 125
data from the CT-scanner was visualized and analyzed by the Image J software 126
(https://imagej.nih.gov/ij/). 127
128
Four-points flexural test
PEER-REVIEWED ARTICLE
bioresources.
com
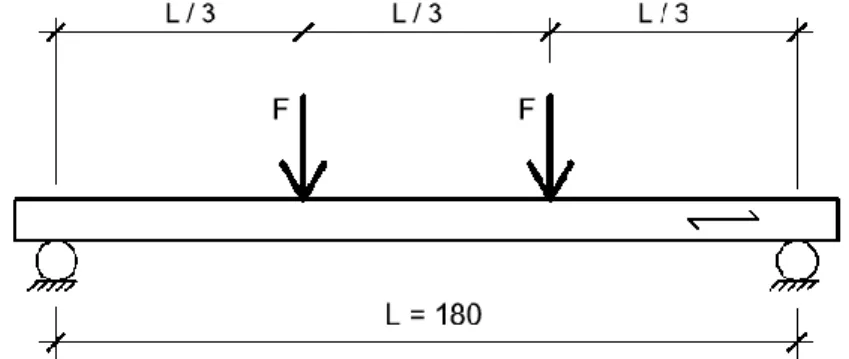
All specimens were loaded in four-point flexural test until failure by an 130
electrostatic press (Fig. 2). The four-point bending test set-up was performed according to 131
the European requirement (EN 1995-1-1 2004) and as presented by (Manfoumbi 132
Boussougou 2012). The specimens were measured and weighed to determine their 133
physical parameters (Table 1). 134
135
136 137
Fig. 2. Four-point flexural test set-up with the fiber direction of the specimen loaded
138 139
The modulus of elasticity (MOE) was calculated for each specimen according to 140
Eq. 1, 141
(1)
142
where F2-F1 is an increase of force on the regression line and W2-W1 is the increase of 143
the corresponding displacement as described in the European standard requirement (EN 144
1995-1-1 2004). L represents the distance between the two supports (Fig. 2), Iz the
145
moment of inertia, G is the shear modulus, b and h are the width and height of the 146
specimen, respectively. Due to lack of data for the tropical species, the influence of G 147
was neglected. The maximum flexural stress was defined to Eq. 2, 148
Cmax=My/Iz (2)
149
where M is the flexural moment at the maximum force, Fmax, during the four-point
150
flexural test, y is the distance from the neutral axis to the area of highest flexural moment 151
and Iz the moment of inertia. For this four-point flexural test set-up, M was calculated as
152
presented by Eq. 3, 153
M=(LFmax)/3 (3)
154
To calculate Cmax, the length y in Eq. 2 can be set equal to h/2 [25]. A comparison
155
between Cmax calculated in this study and the maximum flexural failure stress given by
156
the CIRAD wood collection (Gérard et al. 2011), Cmcir, was done.
157 158 159
RESULTS AND DISCUSSION
160 161
Mechanical Characterization of the Specimens in Static Tests
162
The mean values of modulus of elasticity (MOE), maximum loading (Fmax), and
163
maximum flexural stress (Cmax) obtained, for each species studied, are presented in Table
164
2. The Cmcir value is the maximum flexural stress given by the CIRAD wood collection
PEER-REVIEWED ARTICLE
bioresources.
com
(Gérard et al. 2011). The highest MOEmean of 15.6 GPa was obtained for DF species. The
166
lowest MOEmean of 9.2 GPa was calculated for O. The lowest and highest Fmax, mean was
167
measured for WF and DF, respectively and the specimens with largest variation among 168
the tropical and temperate species was P and DF, respectively. By taking into account the 169
results of (Gérard et al. 2011) and its dry density (Table 1), P was expected to have the 170
highest Cmax mean among all tested species, but according to Table 2, it had a lower Cmax
171
mean but with the highest COV. In general, all tested species (except WF and P) had a 172
higher Cmax, mean than Cmcir. These results highlight the intra-extra trees variability,
173
which exists for specimens taken from the same trees. 174
175
Table 2. Result from the Four-Point Flexural Test with COV in Parentheses
176
Name MOEmean (GPa) Fmax, mean (N) Cmax, mean (MPa) Cmcir (MPa)
Temperate DF 15.6 (10.5%) 522 (20.7%) 102 (20.4%) 91 WF 10.7 (16.4%) 383 (15.3%) 77 (16.0%) 80 Tropical I 12.8 (18.1%) 492 (13.7%) 94 (14.8%) 87 P 14.1 (13.5%) 407 (21.6%) 83 (21.5%) 116 O 9.2 (9.1%) 422 (12.7%) 82 (11.9%) 62 177
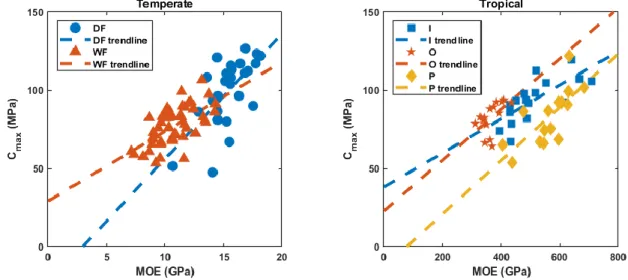
Figure 3 shows the evolutions of the Cmax versus MOE for all tested specimens.
178
There was an increasing Cmax for a higher MOE. This behavior is observable for the both
179
temperate and tropical specimens. The difference in COV, which exists for the groups of 180
specimens presented in Table 2 is also visible in Fig. 3 by the highlighting of the 181
dispersion, which seems large for DF (for the temperate specimens) and P (for tropical 182
specimens). The groups of specimens with lower COV (O and WF) showed a non-183
scattering pattern in Fig. 3 compared to groups of specimens with higher COV. The R2 -184
values for the trendlines were calculated as 0.41, 0.41, 0.53, 0.30, and 0.53 for DF, WF, I, 185
O, and P, respectively. 186
187
Fig. 4. Modulus of elasticity (MOE) versus maximum flexural stress (Cmax)for the groups of 188
temperate and tropical specimens
189 190
Figure 4 shows a comparison between the ρdry and Cmax. Due to the low COV for
191
the ρdry of the DF, the DF specimens are non-scattered. The lower values of Cmax for some
192
DF specimens occur due to material variations. The DF specimens with lower Cmax were
PEER-REVIEWED ARTICLE
bioresources.
com
kept in the analysis because they could not be classified as statistical outliers. The results 194
for the temperate specimens were similar for the tropical specimens where the group of 195
specimens with highest COV could illustrate a trendline with reasonable R2-values. The 196
trendlines in Fig. 4 had an R2-value of 0.40 and 0.35 for WF and I, respectively. The 197
other temperate and tropical specimens resulted in trendlines with low R2-values and are 198
not presented. Iroko (I) was the only tropical group of specimens following a trendline. O 199
and P did not illustrate a trendline due to the low COV of ρdry, which were 4.1% and
200
3.0%, respectively. This variation in ρdry was too low compared to the COV of ρdry for I
201
and WF, which were 13.8% and 8.1%, respectively. This statistical study done on the 202
intrinsic mechanical characteristics of the specimens from temperate and tropical species, 203
gives interesting information to build a database of the mechanical properties of the 204
species studied. This database will be important for the next sections of this work. 205
206
207
Fig. 5. Dry density (ρdry) versus maximum flexural stress (Cmax) for the groups of temperate and
208
tropical specimens
209 210
Cross-section Characterization of the Specimens
211
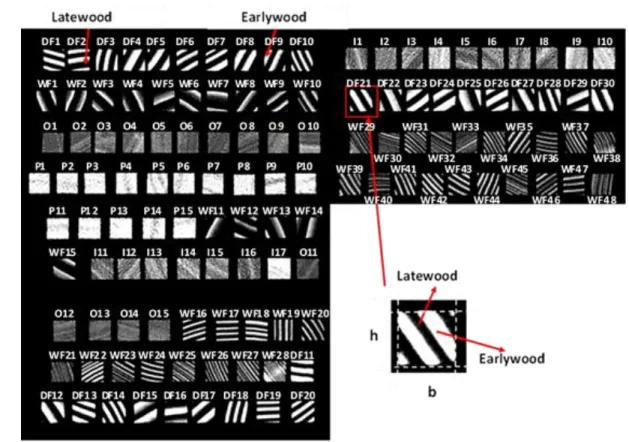
The CT scans of specimens cross-sections are presented in Fig. 5. The earlywood 212
and latewood, which make up the annual growth ring of tree, are illustrated with white 213
and black color, respectively. The distinction between earlywood and latewood is easily 214
observable for the temperate specimens (Fig. 5, DF and WF species), but on the cross 215
sections of the tropical specimens, the distinction of annual growth ring is almost 216
impossible to see (Fig. 5; O, I and P species). These observations are in accordance with 217
the literature (EN 1995-1-1 2004; Sopushynskyy et al. 2017), which shows that the 218
distinction between earlywood and latewood is therefore not obvious in tropical species. 219
The main explanation of the non-perception of this difference, for the tropical specimens, 220
could be given by the harsh climate met in the region of their growth and the fact that the 221
tropical species has a continuous growth of the annual rings during the year (Manfoumbi 222
Boussougou 2012; Ramage et al. 2017). Specifically, for the P specimens the distinction 223
between the lines of latewood and earlywood seems very difficult to observe, which is 224
the same case for O and I. In the specimens O2, O12, I3, I5 (Fig. 6), there is little 225
distinction observable between the latewood and earlywood of these tropical species. The 226
density difference through the specimen could explain the difference. By taking into 227
account this result, globally for the tropical species, the scanning of their cross-section 228
PEER-REVIEWED ARTICLE
bioresources.
com
does not make it possible to distinguish the line between earlywood and latewood. 229
230
231
Fig. 6. Result from the CT-scanner with specimens named and numbered after species
232 233
Starting from this map (Fig. 5), Image J software was used to examine the width 234
of the earlywood for the temperate specimens. The results and the summary of the width 235
mean values of earlywood rings (mean) and the number mean values of earlywood rings
236
(NEmean) are presented in Table 3. The tropical specimens had a lower NEmean than the
237
temperate specimens. Lowest number of NEmean of 1.9 had P. For the tropical specimens,
238
O had the highest NEmean and COV. The temperate specimens had the highest and lowest
239
COV of 56.6% (WF) and 22.9% (DF), respectively, for the NEmean. No mean could not be
240
measured for the tropical specimens due to difficulty of define where earlywood starts 241
and latewood ends (see Fig. 5 for specimens of species I, P, and O). 242
243
Table 3. Mean Width (mean) and Number of Earlywood Rings (NEmean) for the
244
Groups of Tropical and Temperate Specimens with COV in Parentheses 245
Name mean [mm] NEmean
Temperate DF 5.07 (31.4%) 2.8 (22.9%) WF 3.37 (69.6%) 5.5 (56.6%) Tropical I - 2.3 (29.9%) P - 1.9 (30.7%) O - 2.5 (45.6%) 246
Assessment of the Annual Growth Ring in the Mechanical Properties of the
247
Species Studied
248
To understand the effects of the annual growth ring on the mechanical behavior, 249
PEER-REVIEWED ARTICLE
bioresources.
com
comparisons were made between the ρdry and NE (Fig. 6) and the ρdry and Fig. 7).
250 251
252
Fig. 7. Dry density (ρdry) versus the number of earlywood rings (NE) for the groups of temperate
253
and tropical specimens
254 255
The temperate specimens show that there was a correlation between the ρdry and
256
NE. This conclusion was drawn only from the WF specimens and not the DF specimens 257
due to the DF specimens low COV of 22.9%. For the tropical specimens, a correlation 258
between ρdry and NE is difficult to see due to the low spread of the specimens. The
259
illustrated trendlines for the tropical specimens had lower R2-values of 0.30 and 0.32 for I 260
and O, respectively, compared to the R2-value of 0.40 for WF. The tropical trendlines 261
was showing a positive correlation between ρdry and NE but due to the lower R2 values,
262
the trend is not as clear as for the temperate specimens. For the group of DF specimens 263
and the group of P specimens trendlines were not presented due to the low R2-values. 264
The correlation between the ρdry versus for the temperate specimens is
265
presented in Fig. 7. A negative correlation between ρdry and could be seen for the WF
266
specimens. Due to the low COV of 22.9% and 31.4% for ρdry and , respectively, for the
267
DF specimens it was not possible to see any correlation between ρdry and The trendline
268
for the group of WF specimens had an R2-value of 0.60. A trendline for the group of DF 269
specimens was not presented due to the low R2-value. 270
PEER-REVIEWED ARTICLE
bioresources.
com
272
Fig. 8. Dry density (ρdry) versus the width of earlywood rings for the groups of temperate
273 specimens 274 275 276 CONCLUSIONS 277 278
1. An experimental study of the evaluation of the annual growth ring impact on the 279
intrinsic physico-mechanical characteristics of wood has been done. The samples 280
were dimensioned and tested in a four-point flexural test according to the European 281
standard requirement. Two groups of specimens have been studied (temperate and 282
tropical species). To be able to visualize the earlywood and latewood (annual growth 283
ring), the specimens were scanned by a computed tomography scanner before the 284
four-point flexural test. 285
2. The results show that, for temperate species, the distinction between earlywood and 286
latewood make up the annual growth ring and is easily distinguishable. However, for 287
a tropical species the distinction is less clear. The study shows trendlines for the 288
temperate and tropical specimens connecting the modulus of elasticity to the 289
maximum flexural stress. It was also possible to show a trendline between the dry 290
density and the maximum flexural stress for the two groups of temperate and tropical 291
specimens of White fir and Iroko, respectively. Another trendline was shown between 292
the dry density and number of earlywood rings for the group of temperate specimens 293
of White fir and the groups of tropical specimens of Iroko and Okume. A last 294
trendline was shown between the dry density and the mean width of the earlywood 295
rings for the group of temperate specimens of White fir. The mean width of the 296
earlywood rings was not possible to measure for the groups of tropical specimens due 297
to the difficulty of define exactly where earlywood starts and latewood ends. 298
3. The results showed a connection between the annual growth rings of the tree and their 299
intrinsic physico-mechanical characteristics mainly based on the dry density of the 300
wood for both the tropical and temperate specimens. It was possible to show that the 301
dry density was affected by the number and width of the earlywood rings. Moreover, 302
the dry density affected the maximum flexural stress and where the maximum 303
PEER-REVIEWED ARTICLE
bioresources.
com
flexural stress is strongly connected to the modulus of elasticity. This results in an 304
increased number of earlywood rings which then results in an increased modulus of 305
elasticity and increased maximum flexural stress. These results illustrate the need to 306
have a fairly large number of specimens to avoid the large variation noted within the 307
mechanical properties determined in this work. These results are interesting but are 308
limited by the fact that it is a new experimental approach used for this type of study. 309
It could be necessary for the next experimental study to create a method to distinguish 310
clearly the annual growth rings of tropical species by increasing, for example, the size 311
of the samples to be studied. 312 313 314 ACKNOWLEDGMENTS 315 316
The authors would like to thank Luleå University of Technology in Skellefteå, 317
Sweden, including the Wood Science and Engineering Division of the Department of 318
Engineering and Mathematics for the provision of study materials. The authors also thank 319
the TOR Program of the French Embassy in Sweden which allowed the initial 320
collaboration but also the ANR for the financial support of this work through the project 321
CLIMBOIS N ° ANR-13-JS09-0003-01 labeled ViaMeca. And finally, the authors thank 322
the CNRS, which partly supported this work through the PEPS project "Green 323
Engineering" RUMO and Region AURA thanks to SCUSI Project. 324 325 326 REFERENCE CITED 327 328
Abdelmohsen, S., Adriaenssens, S., El-Dabaa, R., Gabriele, S., Olivieri, L., and Teresi, L. 329
(2019). “A multi-physics approach for modeling hygroscopic behavior in wood low-330
tech architectural adaptive systems,” Computer-Aided Design 106, 43-53. DOI: 331
10.1016/j.cad.2018.07.005 332
Adamopoulos, S., Milios, E., Doganos, D., and Bistinas, I. (2009). “Ring width, latewood 333
proportion and dry density in stems of Pinus brutia Ten. ,” European Journal of 334
Wood and Wood Products 67(4), 471. DOI: 10.1007/s00107-009-0345-x 335
Bahar, R., Ouertani, S., Azzouz, S., Naili, H., El Ayeb, M. T., and El Cafci, A. (2019). 336
“Mechanical properties changes in oak (Quercus canariensis) and stone pine (Pinus 337
pinea) wood subjected to various convective drying conditions,” European Journal of 338
Environmental and Civil Engineering 1–13. DOI: 10.1080/19648189.2018.1500308 339
Brancheriau, L., Kouchade, C., and Brémaud, I. (2010). “Internal friction measurement of 340
tropical species by various acoustic methods,” J. Wood Sci. 56(5), 371–379. 341
EN 1995-1-1 (2004). “1-1 Eurocode 5: Design of timber structures,” European 342
Committee for Standardization, Brussels, Belgium. 343
Engonga Edzang, A. C., Pambou Nziengui, C. F., Ekomy Ango, S., Ikogou, S., and 344
Moutou Pitti, R. (2020). “Comparative studies of three tropical wood species under 345
compressive cyclic loading and moisture content changes,” Wood Material Science & 346
Engineering 1-8. DOI : 10.1080/17480272.2020.1712739 347
Gérard, J., Guibal, D., Paradis, D., Vernay, M., Beauchêne, J., Brancheriau, L., Châlon, 348
I., Daigremont, C., Détienne, P., Fouquet, D., Langbour, P., Lotte, S., Thévenon, M-349
F., Méjean, C., and Thibaut, A. (2011). Tropix 7. CIRAD. DOI: 350
PEER-REVIEWED ARTICLE
bioresources.
com
10.18167/74726f706978 351
Gershon, A. L., Bruck, H. A., Xu, S., Sutton, M. A. and Tiwari, V. (2010). “Multiscale 352
mechanical and structural characterizations of Palmetto wood for bio-inspired 353
hierarchically structured polymer composites,” Materials Science and Engineering C 354
30(2), 235-244. DOI: 10.1016/j.msec.2009.10.004 355
Jaskowska-Lemańska, J., and Wałach, D. (2016). “Impact of the direction of non-356
destructive test with respect to the annual growth rings of pine wood,” Procedia 357
Engineering 161, 925-930. DOI: 10.1016/j.proeng.2016.08.761 358
Manfoumbi Boussougou, N. (2012). Contribution à l’Adaptation de l’Eurocode 5 Aux 359
Essences Tropicales Dans Leur Environnement, Thesis, Univ. Limoges, France. 360
Medzegue, M. J., Grelier, S., Bertrand, M., Nziengui, M., and Stokes, A. (2007). “Radial 361
growth and characterization of juvenile and adult wood in plantation grown okoumé 362
(Aucoumea klaineana Pierre) from Gabon,” Annals of Forest Science 64(8), 815-824. 363
DOI: 10.1051/forest:2007065 364
Miksic, A., Myntti, M., Koivisto, J., Salminen, L., and Alava, M. (2013). “Effect of 365
fatigue and annual rings’ orientation on mechanical properties of wood under cross-366
grain uniaxial compression,” Wood Science and Technology 47(6), 1117-1133. DOI: 367
10.1007/s00226-013-0561-8 368
Mishnaevsky, L., and Qing, H. (2008). “Micromechanical modelling of mechanical 369
behaviour and strength of wood: State-of-the-art review,” Computational 370
Materials Science 44(2), 363-370. DOI: 10.1016/j.commatsci.2008.03.043 371
Morales-Conde, M. J., and Machado, J. S. (2017). “Evaluation of cross-sectional 372
variation of timber bending modulus of elasticity by stress waves,” Construction and 373
Building Materials 134, 617-625. DOI: 10.1016/j.conbuildmat.2016.12.188 374
Odounga, B., Pitti, R. M., Toussaint, E., and Grédiac, M. (2018). “Mode I fracture of 375
tropical woods using grid method,” Theoretical and Applied Fracture Mechanics 95, 376
1-17. DOI: 10.1016/j.tafmec.2018.02.006 377
Pambou Nziengui, C. F., Ikogou, S., and Moutou Pitti, R. (2018). “Impact of cyclic 378
compressive loading and moisture content on the mechanical behavior of Aucoumea 379
klaineana Pierre,” Wood Material Science & Engineering 13(4), 190-196. DOI: 380
10.1080/17480272.2017.1307281 381
Pambou Nziengui, C. F., Moutou Pitti, R., Fournely, E., Gril, J., Godi, G., and Ikogou, S. 382
(2019). “Notched-beam creep of Douglas fir and white fir in outdoor conditions: 383
Experimental study,” Construction and Building Materials 196, 659-671. DOI: 384
10.1016/j.conbuildmat.2018.11.139 385
Ramage, M. H., Burridge, H., Busse-Wicher, M., Fereday, G., Reynolds, T., Shah, D. U., 386
Wu, G., Yu, L., Fleming, P., Densley-Tingley, D., and Allwood, J. (2017). “The 387
wood from the trees: The use of timber in construction,” Renewable and Sustainable 388
Energy Reviews 68, 333-359. DOI: 10.1016/j.rser.2016.09.107 389
Saavedra Flores, E. I., and Haldar, S. (2016). “Micro–macro mechanical relations in 390
Palmetto wood by numerical homogenisation,” Composite Structures 154, 1-10. DOI: 391
10.1016/j.compstruct.2016.06.050 392
Sopushynskyy, I., Kharyton, I., Teischinger, A., Mayevskyy, V., and Hrynyk, H. (2017). 393
“Wood density and annual growth variability of Picea abies (L.) Karst. growing in 394
the Ukrainian Carpathians,” European Journal of Wood and Wood Products 75(3), 395
419-428. DOI: 10.1007/s00107-016-1079-1 396
Stanzl-Tschegg, S. E. (2006). “Microstructure and fracture mechanical response of 397
wood,” International Journal of Fracture 139(3–4), 495-508. DOI: 10.1007/s10704-398
PEER-REVIEWED ARTICLE
bioresources.
com
006-0052-0 399
Timoshenko, P. S. (1968). Résistance des matériaux. Résistance des matériaux. Dunod, 400
Paris, https://cds.cern.ch/record/111473 401
Tran, T. B., Bastidas-Arteaga, E., Aoues, Y., Pambou Nziengui, C. F., Hamdi, S. E., 402
Moutou Pitti, R., Fournely, E., Schoefs F., and Chateauneuf, A. (2018). “Reliability 403
assessment and updating of notched timber components subjected to environmental 404
and mechanical loading,” Engineering Structures 166, 107-116. DOI: 405
10.1016/j.engstruct.2018.03.053 406
Treml, S., and Jeske, H. (2012). “Splinter formation of OSB strands during flat disc 407
cutting of ring porous hardwoods,” European Journal of Wood and Wood Products 408
70(1-3), 293-297. DOI: 10.1007/s00107-011-0559-6 409
Zeller, L., Ammer, C., Annighöfer, P., Biber, P., Marshall, J., Schütze, G., del Río 410
Gaztelurrutia and Pretzsch, H. (2017). “Tree ring wood density of Scots pine and 411
European beech lower in mixed-species stands compared with monocultures,” Forest 412
Ecology and Management 400, 363-374. DOI: 10.1016/j.foreco.2017.06.018 413
414
Article submitted: February 24, 2020; 415