Design of a Single Capillary-Parenchymal Co-culture Bioreactor
by
Ernest S. Kim
Sc.B. Mechanical Engineering Brown University 1997
SUBMITTED TO THE DEPARTMENT OF MECHANICAL ENGINEERING IN PARTIAL
FULFILLMENT OF THE REQUIREMENTS FOR THE DEGREE OF MASTER OF SCIENCE IN MECHANICAL ENGINEERING
AT THE
MASSACHUSSETTS INSTITUTE OF TECHNOLOGY JUNE 2002
02002 Ernest Soonho Kim. All rights reserved.
MASSACHUSETTS INSTITUTE
OF TECHNOLOGY
CT 2 5 22
LIBRAR IES
hereby grants to MIT permission to reproduce and to distribute publicly paper and electronic copies of this thesis document in whole or in part.
Signature of Author:
Department of Mechanical Engineering May 24, 2002 Certified by:
The Charles
Jeffrey T. Borenstein Stark Draper Laboratory Thesis Supervisor Certified by:
Roger D. Kamm Professor of Mechanical Engineering Thesis Supervisor
Professor Ain A. Sonin Professor of Mechanical Engineering Graduate Officer, Department of Mechanical Engineering Accepted by:
Design of a Single Capillary-Parenchymal Co-culture Bioreactor
Ernest S. Kim
Submitted to the Department of Mechanical Engineering on May 24, 2002, in partial fulfillment of the requirements for the Degree of Master of Science in Mechanical Engineering.
Abstract
For the over 80,000 patients currently on the waiting list for complex internal organ transplant, tissue engineering is the only promising long-term solution to the problem of insufficient donor organs. Although some non-vascular tissues have been successfully engineered and implanted, thick, complex organs, such as the liver, require integration of vascular networks to deliver oxygen and nutrients to cells deep within the engineered constructs. Current efforts to engineer liver tissue include utilization of large-scale (-10 centimeters) micro-machined fluidic networks of blood vessels and capillaries cultured adjacent to confluent sheets of hepatocytes, and smaller constructs (-300 by 200 micrometers) of endothelial cells and hepatocytes which self-organize in co-culture. These approaches utilize microlithography technology to form structures on the length scales of blood vessels and capillaries. Another requirement for tissue-engineered organs is new materials. One such material is a class of self-assembling oligopeptides, which, in solution, form a gel when exposed to sufficient saline concentrations. Cell cultures in these peptide gels have shown excellent viability, and the gels have been shown to be very biocompatible, eliciting no immune response when implanted.
The objective of this thesis is to design and fabricate a novel bioreactor for co-culture of endothelial and hepatic parenchymal cells in a unique geometry. The bioreactor mimics the in
vivo characteristics of the smallest functional unit of the liver, a single capillary and the adjacent
hepatocytes, i.e. a 'capillary-parenchymal element' (CPE). The motivation for this work is the need to understand the cell-cell interactions that occur at this most basic unit of the liver; this knowledge can then be applied to the development of tissue-engineered replacement organs. The overall dimensions of the bioreactor are on the scale of a single capillary and the adjacent hepatocytes. The device utilizes microlithography fabrication technology to specify the location and geometry of the various cell-types. Additionally, this study is among the first applications of the self-assembling peptide gel.
The device enables the study of co-cultured cells to further the development of in vitro co-cultured tissue and tissue-engineered replacement organs. Analytic and numerical modeling techniques were used to investigate fluid flow and to model mass transfer in the little-understood gelation process of these self-assembling peptides, thus aiding in the design of the bioreactor. The experimental setup incorporated instrumentation to observe and control flow in the microscopic device. To fabricate the membrane, protocols and procedures were developed to initiate gelation of the peptide in previously untried conditions and geometries.
Thesis Supervisor: Jeffrey T. Borenstein
Title: Group Leader, MEMS Sensors Group, The Charles Stark Draper Laboratory, Inc. Thesis Supervisor: Roger D. Kamm
Acknowledgments
I would like to thank my thesis advisors, Roger Kamm and Jeffrey Borenstein, for their guidance
and encouragement throughout this work. I am fortunate and lucky to have worked with them. I would also like to acknowledge and thank Dr. Joseph P. Vacanti and his lab at Massachusetts General Hospital for supporting and helping to inspire this work, and for initiating the collaboration between my advisors. Dr. Mohammad Reza Kaazempur-Mofrad has been an enormous help with the modeling and the writing process. His efforts and willingness to help students are phenomenal. I am grateful to CIMIT (The Center for Integration of Medicine and Innovative Technology) for supporting this work and the work of my aforementioned mentors and advisors. Claire Sasahara has been exceptionally helpful, from my days as a teaching assistant, and throughout my research. Also, Shuguang Zhang and Alan Grodzinsky kindly allowed me to use their facilities for peptide synthesis and have both been truly inspirational teachers. I am grateful for the support, input, and friendship of my fellow graduate students and post-docs in the Kamm group. Michael Caplan was always willing to lend his time and patience to teach me about the peptide and peptide synthesis. Discussions with the peptide group, Davide Marini, Wonmuk Huang, and Gina Kim, on science and life in general, have been enlightening and fun. Thanks also to Ana Isasi, Belinda Yap, Janice Tan, Sephalie Patel, and Helene Karcher for making the Fluids Lab a fun place to work and write.
At Draper Laboratory, Chris Dube and Angela Zapata devoted significant amounts of time and energy to helping me put together the written thesis, for which I am very grateful. I would like to thank everyone in the MEMS Sensors group for being helpful, warm and patient, and for fabricating my devices. Ed MacCormack, John Mahoney, and the rest of the folks in the Draper Central Machine shop were always very helpful and friendly, and would stop whatever they were doing when I came by with questions on mechanical design. Thanks also to Eli Weinberg, Kevin King, and ChiaoChun Joanne Wang, fellow students at Draper, for providing camaraderie and minds to bounce ideas off of.
My musical cohorts, local and worldwide, have been instrumental (!) in maintaining balance in my life: Brian Church and Stephen Budney (Tristan da Cunha), Kirthi Reddy (mopu mopu), and John Mcgreevy and Jason Zevin (RPBC). My housemates, Angus Davol, Brian, and Mark Schnittman, my friends, near and far, old and new, and my family, far and farther, old and new, have really made the past few years of my life the best so far, and I give them my deepest love and thanks.
This thesis was prepared at The Charles Stark Draper Laboratory, Inc., under Cooperative Agreement DAMD17-07-2-00, sponsored by the Department of the Army.
Publication of this thesis does not constitute approval by Draper or the sponsoring agency of the findings or conclusions contained herein. It is published for the exchange and stimulation of ideas.
Contents
Abstract 3 Acknowledgments 5 Contents 7 List of Figures 11 List of Tables 16 1 Introduction 17 1.1 Background 17 1.1.1 Tissue Engineering 17 1.1.2 The Liver 181.1.3 Growing Cells and Co-Culture 19
1.1.4 Previous Work 21
1.2 Enabling Technologies 22
1.2.1 Self-Assembling Oligopeptide 22
1.2.2 MicroElectroMechanical Systems (MEMS) 23
1.3 Objectives and Scope of This Study 23
2 Device Design 27
2.1 Device Concept 28
2.2 Material Selection 32
2.3 Membrane Design: Stress Analysis 33
2.3.1 Flow-Induced Stress 33
2.3.2 Stresses Due to Pressure Differences Across the Membrane 35
2.3.2.1 Bending 36
2.3.2.2 Surface Tension 37
2.3.3 Micron-Scale Design: Stress Analysis Results 38
2.3.3.1 Flow-Induced Stress Results 39
2.3.3.2 Pressure Difference-Induced Stress Results 40
2.3.4 Transport Considerations 40
2.4 Macro-Scale Device Design 42
2.4.1 Flow delivery 42
2.4.2 Visibility, Cost Reduction, and Pressure Regulation 42
2.5 Fabricated Device Specifications 43
2.6 Summary 47
3 Fabrication and Experimental Setup 49
3.1.1 Mask Fabrication 49
3.1.2 Silicon Wafer Processing 50
3.1.3 Glass Wafer Processing 51
3.1.4 Glass-Silicon Bonding and Dicing 52
3.2 Fluidic Fittings 52
3.2.1 Design of the Fittings 52
3.2.2 Assembly Procedure 53
3.3 Device Validation 54
3.4 Experimental Setup 55
3.5 Summary 58
4 Computational Analysis 59
4.1 Flow Parameters and Constraints 59
4.2 Analytic Solution to the Three-Dimensional Flow 61
4.2.1 Derivation of the Analytic Solution 61
4.2.2 Application and Execution of the Analytic Model 65
4.2.3 Results from the Analytic Model 67
4.3 Numerical Model: Fluid Flow and Mass Transfer 70
4.3.1 Setting up the Numerical model 70
4.3.2 Numerical Results 72
4.4 Summary 75
5 Experimental Studies 77
5.1 Macro-Scale Experiment 77
5.1.1 Macro-Scale Experiment: Introduction 77
5.1.2 Macro-Scale Experiment: Materials and Methods 78
5.1.3 Macro-Scale Experiment: Results 81
5.1.4 Macro-Scale Experiment: Discussion (The Congo Red Stain 89
Gradient)
5.1.5 Macro-Scale Experiment: Conclusions 90
5.2 Micron-Scale Viscosity Experiment 92
5.2.1 Micron-Scale Viscosity Experiment: Introduction 92 5.2.2 Micron-Scale Viscosity Experiment: Methods 93 5.2.3 Micron-Scale Viscosity Experiment: Results and Discussion 96
5.2.4 Micron-Scale Viscosity Experiment: Conclusions 97
5.3 Micron-Scale Membrane-Forming Experiment: Micro Experiment 97
Design I-g
5.3.1 Micro Experiment Design I-g: Introduction 97 5.3.2 Micro Experiment Design I-g: Methods and Results 97 5.3.2.1 Prepare Experiment, Confirm Equal Resistance 99
5.4.1 Prepare Experiment, Confirm Equal Resistance
5.4.2 Infuse Peptide
5.4.3 Infuse Saline, Begin Gelation 5.4.4 Stop Flow, Continue Gelation
5.5 Summary
6 Recommendations for Further Development of the Capillary-Parenchymal Element (CPE) Bioreactor
6.1 Improvements for Successful Membrane Formation: Processes and Materials
6.1.1 Mask Selection
6.1.2 Material Selection
6.2 Improvements for Successful Membrane Formation: Geometry Design
6.2.1 Resistance Reduction
6.2.2 Center Channel Dimension
6.2.2.1 Numerical Results for a 24-12-24 Device 6.2.2.2 Numerical Results for a 24-6-24 Device 6.3 Investigating the Nature of Gel Formation
6.4 Testing the Gel
6.5 Cell Culture
6.5.1 Surface Chemistry Modification
6.5.2 Geometry Modification
6.6 Summary
7 Summary and Conclusions
7.1 7.2 7.3
Summary of the Work Results
Recommendations for Further Work
References Appendix
A2.1 Shear Stress on the Membrane
A2.2 Stresses Due to Pressure Differences Across the Membrane: Bending
A2.3 Stresses Due to Pressure Differences Across the Membrane: Surface Tension
A3.1 Mask Layouts
A3.2 Fluidic Fittings: Fabrication and Assembly
A3.2.1 Large-Bore Fittings A3.2.2 Small-Bore Fittings A3.3 Adhesive Gasket
110 110 111 111 111 113 113 113 114 115 115 117 117 119 121 121 123 123 123 125 127 127 127 128 131 135 135 138 140 142 144 144 145 146
A3.4 Modifications to the Harvard Apparatus PHD 2000 Push/Pull Syringe 148
Pump
A4.1 Peptide Solution Density Measurements 155
A4.2 Peptide Solution Viscosity Measurements 156
A4.3 Derivation of the Analytic Solution 157
A4.4 Analytic Model Implemented in MATLAB 165
A4.4.1 MATLAB Code 166
A4.5 Diffusivity Calculation for Peptide 169
A4.6 Non-Dimensionalizing the Numerical Model 171
A5.1 Preparation of the Peptide Solution 175
A5.2 Micron-Scale Viscosity Experiment: Measurement Procedure and 175
Validation
A5.3 Calculation of pcenter 177
List of Figures
1.1 Diagram of the liver 18
1.2 Cross-section view of a sinusoid and the adjacent hepatocytes 19
1.3 A diagram of the cellular and vascular organization of the liver, and a section 23
diagram of the proposed bioreactor
2.1 Top view of the device; the channels are completely filled with water. 28
2.2 Self-assembling peptide solution is flowed through the center channel of the 28
device, while water is flowed through the side channels.
2.3 Saline solution is added to the side channel flow. 29
2.4 The peptide solution begins to form a gel at the fluid interfaces. 29
2.5 The peptide solution forms a full gel between the two saline-filled channels. 30 2.6 Diagram showing cells in culture in the device. The section view shows the 30
endothelial cells in the morphological configuration of a capillary.
2.7 Schematic of the device, showing key dimensions 31
2.8 Isometric view of the channels with laminar flow 34
2.9 Forces on the membrane 34
2.10 Flow in a rectangular channel; the gray wall represents the membrane. 35
2.11 A pressure gradient across the membrane(Pa > Pb) causes deformation. 36
2.12 A section view of the deformed membrane, attached to the top (glass) and 36
bottom (silicon) surfaces of a channel; a diagram showing the stress distribution in the membrane and the bending moment
2.13 A pressure difference across the membrane causes the membrane to bow. 37
2.14 The stretched geometry of the membrane 37
2.15 A plot of the minimum membrane thickness (tmi) for the average velocity of 39
flow in the channels (Vaverage) for a fluid with the viscosity and density of water
2.16 The pressure required to fracture the membrane for a range of membrane 40 thicknesses
3.1 Diagram showing the silicon photolithography process 50
3.2 Diagram showing the metal-on-glass deposition process 51
3.3 A top view of the device, looking through the glass. The detail image shows a 53
magnified view of the converged-channel area. An isometric drawing of a large-bore and small-bore fluidic fitting.
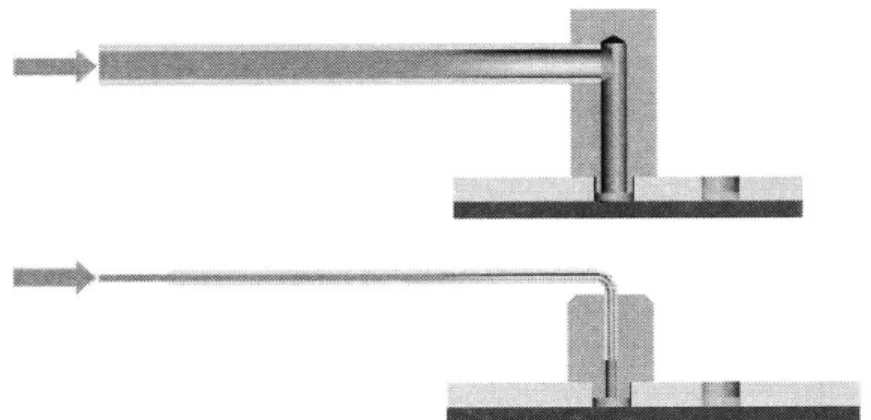
3.4 A smaller volume of solution becomes diluted in the small-bore tubing than in 53
the large-bore tubing.
3.5 A cut-away view of an assembled large-bore fluidic fitting, showing placement 54 of the adhesive ring and the application of the epoxy
3.6 Testing to verify that the channels are unoccluded 55
3.7 The modified Harvard PHD2000 syringe pump 56
3.8 The experimental setup 58
4.1 Flow rates are chosen that provide laminar flow conditions. 60
4.2 The membrane is to be of uniform thickness along the entire converged-channel 60
area.
4.3 Modeled geometry, analytic solution of the velocity field, model of the 61
numerical flow solution, model of the mass transfer solution for concentration
4.4 A top view of the converged-channel area; the red box shows the fully- 62
developed region for low Reynolds number flow
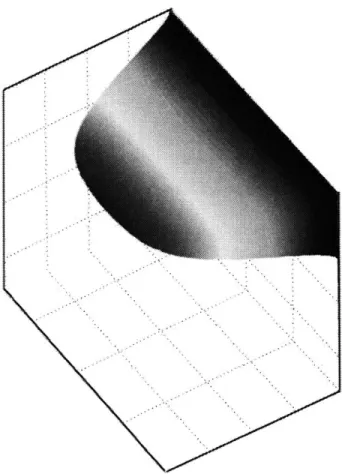
4.5 An isometric view of the boxed-region in Figure 4.4 63
4.6 A cross-section view of the converged-channel region corresponding to the area 64 denoted by the dotted line in Figure 4.5
4.7 A single quadrant of the cross-section shown in Figure 4.6 64
4.8 A plot of the flow ratio Qs:Qp as a function of ym 66
4.9 A plot of the flow ratio Qs:Qp as a function of gpeptide:!.sahine 66
4.10 A plot of the absolute flow rates (Qs and
Qp)
as linear functions of the axial 67pressure gradient over the converged-channel region (dp/dx)
4.11 The flow profile for gsaine = 0.001 Pa-s, gpeptide = 0.0060 Pa-s, ym = 24 tm 68
4.12 The flow profile for gsafine = 0.00711 Pa-s, 9peptide = 0.0060 Pa-s, ym = 24 pm 69
4.13 (a) The converged-channel device area geometry for Fcl; (b) model of the 71
geometry, cut along two planes of symmetry
4.14 A vector plot of the numerical results for the normalized velocity field; flow is 72
left to right
4.15 An isometric vector plot of the numerical results for the normalized velocity 73
field; flow is upper right to lower left
4.16 A band plot of the numerical results for the normalized mass transfer solution 74
for peptide concentration
4.17 A band plot of the numerical results for the normalized mass transfer solution 74
for saline concentration
4.18 The overlapping region where concentrations of peptide and saline are 75
sufficient for gelling
4.19 Normalized pressure in the device 75
5.1 Schematic of the macro-scale experimental setup; tubing and syringes are not to 78
scale. Syringes were mounted on and removed from the pump as they were
needed (See Section 5.1.2 for the protocol).
5.2 Device Fc8, shown with fluorescein dye flowing in through the center channel 79
and out the outlet channels on the right
5.3 Device Fc8 fluidic ports, labeled as followed: CL = large-bore center inlet, Cs = 79
small-bore center inlet, Co = large-bore center outlet; SL = large-bore side inlets, Ss = small-bore side inlets, So = large-bore side outlets
5.4 Water was "pushed" into the device through the large bore inlets and "pulled" 80
out through the large-bore outlets.
5.5 Peptide solution was infused through the center channel at 10 gl/min, while 80
water was infused through the side channels at 20 gl/min.
5.6 A solution of saline, fluorescein, and Congo Red was infused through the side 81
inlets at 20 gl/min; peptide flow was maintained at 10 pl/min.
5.7 t - 0. The observed black marks and nicks were imperfections on the glass 82
surface. This and the following images have been reversed to show flow from
5.10 t = 36:00. High-magnification image showing Congo Red staining along the 83
upper leading edge of the saline-peptide interface, indicating the presence of peptide gel
5.11 t = 40:00. The converged-channel area stitched from two images. 84
5.12 t = 83:00. Fluorescein was flushed from the device. Congo Red staining was 85
very visible.
5.13 t = 86:00. The gel appeared torn at the divergence of the channels. 85
5.14 t = 164:00. Fluorescein has been removed from the device. Congo Red stain is 86
visible along the edges of the peptide region.
5.15 A "panoramic" view of device, showing the inlet channels and the outlet 86
channels. Note the gelled and stained peptide particles in the upper right outlet channel.
5.16 t = 19:49:00. High-magnification image of the fractured peptide gel membrane. 87
5.16a Detail view a of Figure 5.16. 87
5.16b Detail view b of Figure 5.16. 87
5.16c Detail view c of Figure 5.16. 88
5.17 High-magnification image showing the Congo Red staining gradient. 88
5.17b Detail view of Figure 5.17. Note the staining gradient and the dark edge of the 89
stained region on the right.
5.18 (a) Water is flowed through a large-bore inlet, while the peptide solution is in 90
the small-bore inlet path. (b) Peptide solution is infused into the device,
causing pressure to build up and expand the large-bore inlet tubing. (c) The syringe pump infusing the peptide is stopped and pressure in the small-bore path falls. The tubing in the large-bore inlet path contracts and causes water to flow into the device.
5.19 Schematic of setup for the micron-scale viscosity experiment 93 5.20 A plot of the normalized center stream width as a function of the viscosity ratio 95
!center: 9side
5.21 Schematic of the setup for the micron-scale membrane forming experiment 98
designated Micro Experiment Design I-g
5.22 Saline-fluorescein-Congo Red solution was pumped into the two side channels 99
through Ss's while water was infused through the center channel
5.23 Laminar flow and an unclogged device were verified. 100
5.24 Water was flowed through the device until fluorescein dye was no longer 100
visible.
5.25 When solution is pumped through a small-bore inlet and stopped, then solution 101 is infused through the large-bore inlet, solution in the small-bore path should be
present right up to the intersection of the two flows, not accounting for diffusion effects.
5.26 Peptide was infused through the center channel while water was flowed through 101
the side channels.
5.27 t = 0:31. A thin 'skin' appeared to form on the outside surfaces of the center 103
peptide stream.
5.28 t = 0:41. Infusing flow rates were reduced to allow further gelation of the 103
peptide solution.
5.30 t = 6:05. The dark gelled regions appeared to wash away, leaving transparent 104 Congo Red-stained structures.
5.31 t = 4:54:15. No further gelling was observed. Peptide solution was no longer 105
present in the device.
5.32 t = 0:15 from July 24, 2001, trial 4. The peptide solution formed a dark gel on 105
the surfaces of the peptide stream that were exposed to saline.
5.33 t = 3:13 from July 24, 2001, trial 4. The dark gel appeared to wash away, 106
leaving thin, transparent Congo Red-stained gel 'skins.' The 'skins' seemed to be a barrier to fluorescein.
5.34 t = 4:24 from July 24, 2001, trial 4. The gel structure was nearly invisible. 106
5.35 (a) Air bubbles may be hidden in the stainless steel large-bore tubing of a 107
plugged inlet. (b) As fluid is pumped through the small-bore inlet, the pressure caused by resistance in the device causes the air bubble to contract. (c) When the pump is stopped, the air bubble expands, driving fluid through the device.
5.36 Schematic of the setup for the micron-scale membrane forming experiment 109
designated Micro Experiment Design II-p.
6.1 Inlet and outlet channels become deeper and wider away from the converged- 115
channel device area.
6.2 A plot of pressure versus width for various channel depths. The smallest 116
pressure for inlet and outlet channels calculated here was 3.44 mm H20 for
2000x 100 pm channels
6.3 A wider channel results in a larger volume of diluted solution due to diffusion. 116
6.4 The edges of the peptide stream have gelled, but the center appears to be a fluid. 117 6.5 A vector plot of the velocity profile for channel widths 24-12-24 pm, 118
psaline: gpeptide = 1:1, and Qsaline:Qpeptide = 1. 38: 1
6.6 An isometric vector plot of the velocity profile for channel widths 24-12-24 gm, 118 9saline 9peptide = 1:1, and Qsaline Qpeptide = 1.38: 1
6.7 A band plot of the concentration profile of saline for a device with channel 119
widths 24-12-24 gm
6.8 A vector plot of the velocity profile for channel widths 24-6-24 gim, 119 9saline:ppeptide = 1:1, and Qsaline Qpeptide = 2-59:1
6.9 An isometric vector plot of the velocity profile for channel widths 24-6-24 gim, 120
9saline:9peptide = 1:1, and Qsaline Qpeptide = 2.59:1
6.10 A band plot of the concentration profile of saline for a device with channel 120 widths 24-6-24 pm
6.11 (a) Dye of known diffusivity and molecular size is flowed into one channel, 122 water in the other. Flow is stopped in both channels, and the change in
concentration density as (b) the dye diffuses through the peptide gel and (c) into the water-filled channel is observed by measuring the intensity of fluorescence over time.
6.14 Revised Fcl showing new fluidic paths. Detail of converged-channel area, 124 fluid paths are labeled: the current-design center and side inlets, Ci and SI's; the
current-design center and side outlets, Co and So's; the new auxiliary inlets and outlets, Al's and Ao's.
6.15 Cells are flowed into the device in suspension; they are flowed in through the 124 Si's and out through So's.
6.16 Cells are flushed from the inlet and outlet channels; fluid is flowed in through 125
the Al's and Ao's, and out through the Si's and So's.
A2.1 Cross-section of the channel, showing the side of the channel adjacent to the 136
membrane
A2.2 The stretched geometry of the membrane 141
A3.1 Layout for silicon wafer pattern. Horizontal and vertical axes are not part of the 142 pattern. Diameter of the wafer is 10.0 cm.
A3.2 Detail view of the layout for device Fcl 143
A3.3 Layout for glass wafer pattern. Horizontal and vertical axes are not part of the 143 pattern. Diameter of the wafer is 10.0 cm.
A3.4 Machine drawing for large-bore fluidic fitting 144
A3.5 Cross-section of the large-bore fluidic fitting, showing locations of epoxy 144
A3.6 Machine drawing for small-bore fluidic fitting, base 145
A3.7 Machine drawing for small-bore fluidic fitting, tube 146
A3.8 Cross-section of the small-bore fluidic fitting, showing location of epoxy 146
A3.9 Drawing of the adhesive gasket 146
A3.10 Assembly of the adhesive gasket, part 1 147
A3.11 Assembly of the adhesive gasket, part 2 147
A3.12 Exploded view, showing the location of the adhesive gasket between the glass- 148 silicon device and the fluidic fitting
A3.13 Standard PHD 2000 with 4 syringe rack 148
A3.14 PHD 2000 Push/Pull Syringe Pump 149
A3.15 Exploded-assembly drawing of the Harvard PHD2000 Push-Pull Pump 150
Modifications
A3.16 Rail Slider, modification of an existing part 151
A3.17 Lower Clamp Plate, modification of an existing part 151
A3.18 Sliding Clamp Plate, modification of an existing part 152
A3.19 Position Plate, modification of an existing part 152
A3.20 Clamp Rack, modification of an existing part 153
A3.21 Piston Retaining Bracket, new part, sheet 1 of 2 153
A3.22 Piston Retaining Bracket, sheet 2 of 2 154
A3.23 Clamp Rack Standoff, new part 154
A4.1 Mass vs. volume for 1.0 weight percent KFE8 solution 155
A4.2 Viscosity vs. shear rate for 1.0 weight percent KFE8 solution 156 A5.1 Scanning-electron microscope image of the cross-section of an etched silicon 176
channel. The dimensions are different from those used in this study, but the curvature at the bottom of the channel will exist in our fabricated geometries. (Image courtesy of Joe Ricker, The Charles Stark Draper Laboratory, Cambridge, MA)
A5.2 An image of the device showing the measurement of the channel (left) and the 177
center stream (right). The fluid is flowing from right to left in this image.
A5.3 Drawings of (a) the assumed-geometry, used in the analytic solution, and (b) 178
the actual geometry formed in the etch process
A5.4 The standard deviation for data sets n=6 and n=5, for a range of adjustment 179
factors
A5.5 The single-syringe pressure release fixture 180
A5.6 The saline pressure release fixture. The black base represents the syringe 180
mounting block of the syringe pump.
A5.7 The saline pressure release fixture, shown in the open position 181 A5.8 The saline pressure release fixture in the closed position 181
A5.9 2x Clamp Plate 182
A5.10 Clamp Lever 183
A5.11 Harvard Pump Modification 183
List of Tables
2.1 Design parameters for the micron-scale fluidic devices and ranges of values 32
2.2 Mechanical properties of 10 mg/ml KFE8 peptide gel 38
2.3 Dimensions and syringes combinations for devices Fcl-Fc8, critical pressures 44 for the gel membrane in these devices, and estimated times for salt to diffuse
into the peptide stream
2.4 Comparison of 100x(critical pressures)/(pressure required for flow) for the 44 devices at physiologic average fluid velocities
2.5 Design motivations for the devices 47
5.1 Flow rate data for the micron-scale viscosity experiment 95
5.2 Calculated viscosity values from center stream measurements 96
5.3 Quantitative outline of the micron-scale membrane forming experiment 99
A4.1 Density data for a 1.0 weight percent KFE8 solution 155
A4.2 Calculated error for the MATLAB model with varying mesh size 165
A4.3 Calculated error for the MATLAB model with varying n in the series expansion 165
A4.4 Tabulation of the total molecular volume of a KFE8 monomer 170
A4.5 Tabulation of the total molecular volume of a KFE8 intermediate 170
A4.6 Tabulation of the total molecular volume of a KFE8 filament 170
Chapter 1
Introduction
1.1
Background
1.1.1 Tissue Engineering
There are currently over 80,000 patients on the waiting list for complex internal organs
[26]. For these patients, options include extra-corporeal assist devices (such as kidney dialysis
treatments) and artificial replacement devices (e.g., artificial heart). For some conditions, such as severe liver failure, transplantation is the only viable option. Annually in the U.S., 3500 patients undergo liver transplantation, while 30,000 seeking transplants will die [21]. To deal with the gross inequality between supply and demand of available donor organs, tissue engineering is the most logical and promising potential solution.
In the field of tissue engineering, several types of non-vascular tissues have been grown
in vitro and successfully implanted in human patients (skin and cartilage) and animal models
(bone marrow) [12]. However, thick, complex organs have posed a greater challenge. For these tissues the radius of the organ exceeds diffusional length scales for oxygen and nutrients (approximately 150 micrometers). Vascular networks must be incorporated into these engineered organs to deliver these materials to cells deep within this tissue, via cell culture medium (in vitro) or blood (in vivo). This study will focus on tissue engineering efforts for a specific organ of this type, the liver.
1.1.2 The Liver
The main functions of the liver involve the handling of nutrients and pollutants, which are passed into the liver through the bloodstream; the liver is also important in acting as a reservoir that regulates the supply of blood to the body.
Veno covo
Hepatic ve Hepatic artery to Hepatic sinchs connective tissue
Pbrtol
vein Intestinal vein
Capillary Intestinal artery
Figure 1.1. Diagram of the liver [14]
The liver has two blood supplies: the hepatic artery, which supplies nutrients and oxygen to the
liver cells; and the portal vein, which collects the blood that leaves the spleen, stomach, small
and large intestine, gall bladder, and pancreas, and carries it to the liver, where nutrients and toxins are processed (Figure 1.1) [6].
When blood enters the liver through the portal vein, the liver vasculature branches into smaller and smaller channels, down to the capillary level (Figure 1.2).
SINUSOID SPACE OF HEPATIC DISSE CELL M- BILE ENDOTHELIAL CANALICULUS CELL INTERCELLULAR SPACE TO BILE DUCT
Figure 1.2. Cross-section view of a sinusoid and the adjacent hepatocytes [11]
Material and fluid exchange occurs between the sinusoids, which are specialized capillaries formed by loosely-connected fenestrated endothelial cells, and the hepatocytes. Material transport of nutrients and toxic substances occurs by osmosis and diffusion from the sinusoid, across the Space of Disse (width of 1 micron or less) and other intracellular spaces, through the hepatocyte cell membrane [11]. Blood flows out of the sinusoids and into larger and larger veins, leaving the liver through the vena cava. The hepatocytes secrete wastes as bile into the bile canaliculi. The bile canaliculi are connected to bile ducts, which empty into the gastrointestinal tract.
1.1.3 Growing Cells and Co-Culture
Culturing cells for the purpose of tissue engineering requires control over cell morphology and function. For an engineered liver, the important cell types to consider are the cells that form the vasculature (endothelial cells) and the parenchymal cells (hepatocytes). For these cell types, the environment can be controlled to achieve the desired cell expression, that of capillaries and functioning liver tissue.
Given the proper environment, endothelial cells in culture will form capillary-like structures. One approach to capillary formation is to fabricate a microfluidic network of channels, then grow endothelial cells on the inner walls of the channels. The channels are coated with cell-adhesion molecules, and then endothelial cells in suspension are dynamically seeded and cultured in the network. Endothelial cells have been shown to successfully adhere to and be cultured in micro-channels for more than 4 weeks [5].
Furthermore, endothelial cells can develop capillary-like morphology on a flat substrate through control of the cell-adhesion regions. Dike et al. patterned hydrophilic lines of various widths onto otherwise hydrophobic treated gold-plated glass slides [10]. Fibronectin was deposited onto the hydrophilic regions; endothelial cells were then seeded onto the fibronectin lines and cultured. On 30 micrometer and wider lines, the endothelial cells spread out and grew in a flat sheet. On 10 micrometer lines (typical capillary width), the cells lined up one or two cell widths along the length of the line and rolled up into three-dimensional capillary-like structures.
It is now common knowledge that mesenchymal cells should be co-cultured with hepatocytes to improve hepatocyte viability in vitro [31]. Hepatocytes in co-culture with mesenchymal cell types (endothelial cells, fibroblasts, and others) exhibit prolonged morphologic and functional differentiation characteristics that are quickly lost when hepatocytes are cultured alone [2]. Studies have demonstrated co-culture in various two- and three-dimensional configurations, with many variables, including randomly-mixed cells, segregated cells, static culture, continuous perfusion culture, and different chemical environments [4,13].
1.1.4 Previous Work
The main obstacle to building a tissue-engineered liver for implantation is the challenge of creating vasculature in vitro. One strategy is to take advantage of existing vascular beds in the patient, injecting or implanting cells directly into these areas [30]. While this approach has shown some short-term success in the liver, in the long run it does not result in a healthy organ, and the approach is useless for organs with less-extensive vascular beds. Very promising results have been achieved by the use of angiogenesis growth factors to promote blood vessel formation in in vitro cell cultures [27]. Still, this process is limited by the speed of blood vessel formation. Another means to achieve vascularized liver tissue is to use microfabrication technology to create geometries that promote blood vessel formation. Several strategies employ varying degrees of scale and imposed structure to achieve this goal.
One approach focuses on developing a vascularized "mini-liver" in vitro [13]. Mixtures of endothelial cells and hepatocytes are cultured in microfabricated wells (-300 micrometers in diameter by 200 micrometers deep) through which cell culture medium is perfused. The cells self-organize, driven by surface-adhesion effects, and form globules of liver cells surrounded by endothelial cells. As these globules adhere to each other and to the walls of the channel, the interstitial spaces are lined with endothelial cells and resemble the inner walls of capillaries. Perfusion of cell-culture medium through the crevices between the globules simulates blood flow through capillaries [12].
The other approach seeks to build organ-scale liver tissue by stacking large (10 centimeters in diameter) layers of two-dimensional vasculature and cultivated sheets of hepatocytes [12,19]. The vascular layers are fabricated by culturing endothelial cells in precision-machined branching fluidic channels modeled after physiologic capillary networks,
made from degradable polymers using MEMS technology. These vascular sheets are stacked in alternating layers with layers of hepatocytes, and the vascular sheets are connected to form a three-dimensional fluidic network. The endothelial cells form blood vessels and capillaries within the channels. As the blood vessels and hepatocytes develop, they produce extra-cellular matrix to provide structural integrity as the biodegradable networks break down [28].
1.2
Enabling Technologies
1.2.1 Self-Assembling Oligopeptide
A new biomaterial, a porous hydrogel (a three-dimensional network of hydrophilic
polymers) made of self-assembling oligopeptides, shows potential as a scaffold for engineered tissue [34]. This recently identified class of oligopeptides consists of short amino acid sequences consisting of alternating hydrophilic and hydrophobic residues that join in -sheet conformation to form long helical ribbon-like strands in solution. These strands bundle together into filaments. When either the ionic strength of the solution is above a certain threshold so that the charges are effectively screened, or the pH of the solution causes the net charge on the molecules to be nearly zero, the filaments cross-link to form a hydrogel [25]. The peptides self-assemble into a lattice of fibers with a matrix density that is dependent on the peptide concentration [24]. The peptide gel elicits no immune response when injected into laboratory animals, and has been shown to support viable cultures of several cell types [18,23,33]. The matrices are fragile, but the self-assembling property can be used to construct gel structures with minimal handling. Furthermore, after cell attachment, the natural matrices produced by the cells help increase
1.2.2 MicroElectroMechanical Systems (MEMS)
MEMS microfabrication technology is well suited to machining geometries on the scale
of cells and capillaries. Microlithography and etching techniques allow one to manufacture three-dimensional features with in-plane resolution of ±0.1 micrometers for features up to 40 micrometers deep, either by patterning directly onto flat substrates (generally silicon or Pyrex wafers), or by creating molds for polymer casting [5,22]. Different processes can alter the substrate surface chemistry from hydrophobic to hydrophilic, and can be used to control cell adhesion.
1.3
Objectives and Scope of This Study
The objective of this thesis was to design and fabricate a bioreactor for co-culture of endothelial and hepatic parenchymal cells mimicking the in vivo characteristics of the smallest functional unit of the liver, a single capillary and the adjacent hepatocytes, i.e. a 'capillary-parenchymal element' ('CPE', see Figure 1.3).
Erdotheha ceS micro-machined channel s endlothelial cells hepatocytes Space of Disse peptide membrane
Figure 1.3. A diagram of the cellular and vascular organization of the liver [16] (left), and a section diagram of the proposed bioreactor (right)
The need to understand the cell-cell interactions that occur at this most basic unit of the liver is the motivation for this work. Knowledge gained from the study of these interactions in the bioreactor can be applied to the development of tissue-engineered replacement organs. The co-culture bioreactor consists of two cell-scale fluid channels separated by a thin porous membrane made of self-assembling oligopeptide hydrogel. This approach is distinguished from other small-scale co-culture studies by the highly specified geometry of the bioreactor; this is significant, as cell expression and morphology are affected and in some cases dictated by the geometry of the cell environment [10].
Additionally, this study is among the first applications of a new biomaterial, the self-assembling peptide. The bioreactor exploits the characteristics of the peptide to form the hydrogel in a unique fashion. This study aims to promote and expand the tissue-engineering applications of the peptide.
The design of the bioreactor was guided by physiologic data, as well as by the constraints of the materials and instrumentation. Fluid and solid mechanics analysis of the device was performed to aid in the design of the bioreactor geometry (Chapter 2). Standard MEMS microfabrication technologies were used to construct the micro-fluidic component of the devices, while precision-machined parts were used to interface the micro-fluidic components to high-precision fluid control instrumentation (Chapter 3). Analytic and finite element modeling (FEM) techniques were employed to model fluid flow and mass transfer in the device to estimate the optimal parameters, to be implemented in the gel membrane-forming experiments (Chapter 4). The experimental work focused on forming a gel membrane between two capillary-scale channels. To fabricate the membrane, protocols and procedures were developed to initiate
a gel membrane were achieved (Chapter 5). Continuing efforts to understand the gelling process, and well as to fabricate the gel, are required to successfully construct the bioreactor (Chapter 6).
Innovative achievements in this study include the unique design of the bioreactor, specifically: the use of highly specified geometry to promote capillary growth, and the scale of the bioreactor to study the interactions between a single capillary and the adjacent hepatocytes. The method by which the gel is formed is novel, as are the accompanying results from the numerical mass transfer models and experiments. These results provoke further investigation into the nature of the gelling process of the peptide.
Chapter 2
Device Design
The proposed device for co-culture of a capillary-parenchymal element (CPE) consists of two capillary-scale fluidic channels in parallel, separated by a membrane made of porous self-assembling oligopeptide matrix. Silicon and glass MEMS fabrication processes were used to fabricate the micron-scale geometry of the devices. This micron-scale substructure was connected to macro-scale devices, including syringe pumps to control fluid flow through the device, and an optical microscope to record images of the device and peptide matrix formation. The design of the micron-scale geometry was determined by the physics of the materials and the available micro-machining technology, as well as by constraints and requirements of the macro-scale devices. Solid and fluid mechanics analysis was used to consider the effects of pressure and flow-induced stresses on the peptide membrane, and to determine its optimal dimensions. Choosing the dimensions of the side channels required consideration of the physiology (dimensions of the liver capillaries (sinusoids) and hepatocytes) as well as the flow rate ratios available from the syringe pumps. The inlet and outlet channels were designed to allow sufficient visibility of the converged-channel device area with the microscope, while maximizing the number of devices on a single silicon wafer to minimize cost.
2.1
Device Concept
The device concept was to form a peptide gel membrane between two cell-sized channels
by first flowing peptide solution between the two channels, then flowing saline in the two side
channels to cause the peptide solution to gel. Design of the bioreactor was directed by the physiology of the liver, the properties of the peptide gel, and characteristics of the gel-forming process. The following procedure was proposed for forming the gel membrane:
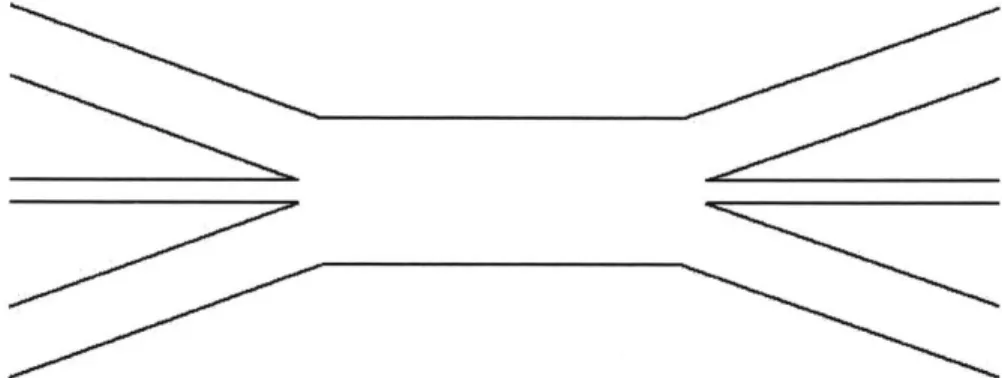
- A device is constructed consisting of three channels that converge into a single wide, long
channel, which diverges back into three channels (Figure 2.1). The channels are completely filled with water.
Figure 2.1. Top view of the device; the channels are completely filled with water.
- Under laminar flow conditions, self-assembling peptide solution is flowed through the center channel of the device, while water is flowed through the side channels (Figure 2.2).
water
- A saline solution consisting of sodium salt, fluorescein salt (a fluorescent dye for flow
visualization) and Congo Red (a stain that binds to the P-sheet structures formed by the peptide for visualization of the gel) is introduced into the side channel flows (Figure 2.3).
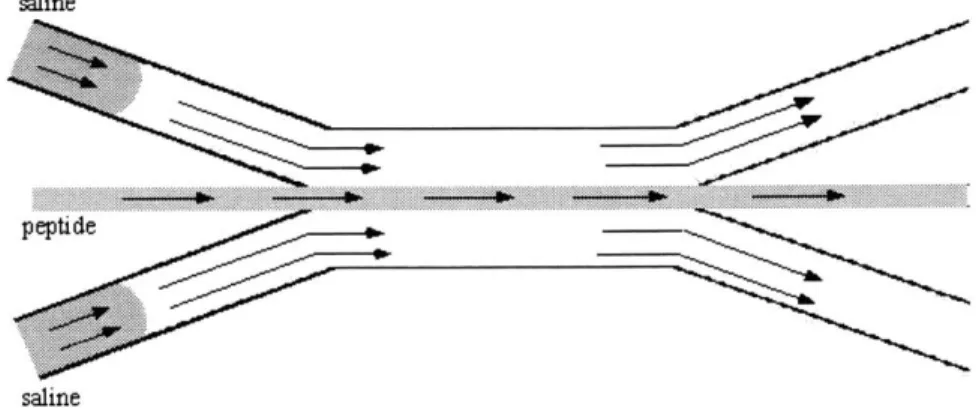
saline
. ... .... ..
p eptide
saline
Figure 2.3. Saline solution is added to the side channel flow.
- As the saline comes into contact with the peptide solution, the ionic strength of the peptide
solution rises above the threshold so that the charges are effectively screened, and the peptide solution begins to form a gel at the fluid interfaces. At this point, all the flow streams are stopped to allow complete gelation to occur undisturbed by the flow (Figure 2.4).
Peptide
Figure 2.4. The peptide solution begins to form a gel at the fluid interfaces.
- Saline diffuses through the gel and into the peptide solution, and the rest of the peptide
Peptide
Figure 2.5. The peptide solution forms a full gel between the two saline-filled channels.
- The saline-fluorescein-Congo Red solution is flushed out of the device with water, leaving a
peptide gel membrane separating the two parallel channels.
Once a stable gel is formed, characterization measurements can be made. For example, a chemical or pressure gradient can be imposed across the membrane to investigate its conductivity and mechanical properties. To use the device for cell seeding, cell adhesion molecules, such as fibronectin, can be flowed in solution through the channels to make the surfaces "sticky" to cells. One channel may then be seeded with endothelial cells and the other with hepatocytes (Figure 2.6).
...
...
...
~ ~~K1II...I
.
....
. .endothelial cell
Oxygenated cell culture medium is flowed through each channel, and the system is incubated. The geometry of the capillary channel is designed to give the endothelial cells mechanical cues to promote capillary formation. Hepatocytes can adhere to the membrane and the walls of the other channel. Once the liver cells and endothelial cells have successfully grown and developed, the capillary is then supplied with oxygenated cell culture medium. The cell culture medium on the hepatocyte side is replaced with a non-nourishing fluid ("pseudo-bile") to remove waste products from the cells. The hepatocytes are sustained by diffusion of oxygen and nutrients through the capillary wall and peptide membrane.
The design variables for the micron-scale geometry are the width and depth of each channel, and the length of the device area (see Figure 2.7). The dimensions of the side channels are based on the dimensions of endothelial cells (channel a, see Table 2.1) and hepatocytes (channel b). The center channel (channel c) is sized to the width of the desired membrane, which must possess adequate strength while allowing for material transport between the two side channels.
Table 2.1. Design parameters for the micron-scale fluidic devices and ranges of values
Design Geometric Based on Range of values
Area parameters
device area length length of capillary 0.3 - 1 mm [15]
channel a width and depth dimensions of sinusoids 7 - 15 pm in
diameter; average
10 pm [1]
channel b width and depth dimensions of hepatocytes 13 - 30 gm in
diameter; average 25 pm [1] channel c width and depth width of the Space of Disse and Dependent on fluid
material properties of the peptide and pressure
gel: strength, conductivity, etc. variables
2.2 Material Selection
Fabrication of the micron-scale fluidic device employed established MEMS technology, based on an etched silicon wafer bonded to a drilled glass wafer. The silicon paradigm has been used extensively in the area of microfluidics and tissue engineering, and surface chemistry modification techniques for cell seeding and culture are well-established [4,5,10]. These types of fluidic networks are also often made of elastic polymers, the most commonly used being poly(dimethlysiloxane) (PDMS). These polymers can be used to manufacture devices quickly and cheaply, but have the disadvantage of being highly compliant. Fluid flow at physiologic flow rates through long channels with cross-sectional dimensions that are on the size scale of capillaries generates high pressures. The inherent compliance of a non-rigid polymer device causes the device to deform and expand under high pressures. This compliance causes the device to act as a fluid capacitor, introducing transient effects on flow rates that need to be well-controlled. A glass-silicon device is considerably more rigid than a molded polymer device and reduces these effects. Furthermore, the silicon-glass paradigm is readily available and
well-In this study, the peptide sequence KFE8 used to form the hydrogel membrane (synthesized by the BioPolymers Lab at MIT, Cambridge, MA). This peptide was chosen due to its similarity to another peptide sequence for which mechanical property data was available
(discussed in Section 2.3.3). 'KFE' refers to the side chains of the amino acids that make up the peptide: Lysine (K), positively charged and hydrophilic; phenylalanine (F), non-polar and hydrophobic; and glutamic acid (E), negatively charged and hydrophilic. '8' refers to the
number of amino acids in the peptide. Thus, KFE8 corresponds to the sequence 'FKFEFKFE'.
2.3 Membrane Design: Stress Analysis
The purpose of the gel membrane is to provide a permeable fourth "wall" to channel a so that the endothelial cells have four continuous walls to adhere to and form a capillary. Prior to cell seeding, the inside walls of the capillary channel are treated with cell-adhesion molecules to promote cell attachment (see Section 6.5.1). Ideally, the gel would have a thickness close to the width of the Space of Disse ( 1 micron, see Figure 1.2). The minimum width of the gel is determined by the strength of material, and flow and pressure conditions in the channels. The gel membrane experiences both shear stress from flow in channels a and b, and normal and in-plane stresses resulting from pressure differences across opposite sides of the membrane.
Quantitative analysis of these effects guides the design of the gel dimensions.
2.3.1 Flow-Induced Stress
The gel membrane experiences shear stress from the fluid flow in the side channels. The stress on the gel will be highest along its edges (Figure 2.8).
Figure 2.8. Isometric view of the channels with laminar flow
A simple force balance shows that
Total Force on the membrane = I reaction forces from edges 1,2,3,4 (see Figure 2.9).
In the worst-case scenario, the gel will be in tension, held only by edge 1.
Figure 2.9. Forces on the membrane
The stress over the area where the gel is attached to edge 1 is
F
0-= C -h'o't (2.1)
t~h'
where F,, is the total force on the membrane, t is the thickness of the membrane, and h is the height of the membrane. The Navier-Stokes equation for fully-developed fluid flow in one of the channels is solved and the shear stress calculated, then integrated over the membrane area to give
Figure 2.10. Flow in a rectangular channel; the gray wall represents the membrane.
Equal flow is assumed on both sides of the membrane, so by symmetry this result, multiplied by 2, gives an estimate of the total force on the membrane (Ftot) from the fluid shear stress on both sides of the membrane (see Appendix A2.1 for the full derivation). The total force on the membrane is
F,0, = 2F,,,id, =4Lj d--dz. (2.2)
dy
Choosing flow conditions, the height and length of the gel, and using the maximum strength of the gel (a,.ax, from the known mechanical properties of the material, see Table 2.2), the
minimum necessary thickness of the gel is given by
t. = F'' (2.3)
2.3.2
Stresses Due to Pressure Differences Across the Membrane
Stress on the membrane also occurs when there is a pressure gradient across the membrane (Figure 2.11). When the membrane deforms, it will bow towards the side with the lower pressure.
Figure 2.11. A pressure gradient across the membrane (Pa > Pb) causes deformation.
In-plane stresses will occur due to bending and membrane tension. If the stresses are separated into x and z components, the maximum stresses will occur along the shorter dimension h.
2.3.2.1
Bending
A vertical cross section of the membrane can be modeled as a beam-bending problem
(Figure 2.12):
From the stress analysis, the maximum curvature of the beam occurs at z = 0, h (see Appendix
A2.2 for the full derivation). Across this section, the maximum o values occur at y = ±
A.
Forh=O, y = 2 , and a, = a;n. (the material fracture strength), one can calculate the critical pressure
APcit at which the membrane will break.
2.3.2.2 Surface Tension
In addition to bending, pressure differences across the membrane will cause it to bow in the direction of lower pressure. This bowing will stretch and strain the membrane (see Figure
2.13).
AP,
Figure 2.13. A pressure difference across the membrane causes the membrane to bow.
h+
SIn
Figure 2.14. The stretched geometry of the membrane
Figure 2.14 shows the stretched geometry of a vertical cross-section of the membrane (represented by the gray line). From an original dimension of h, the membrane has stretched to length S. If the membrane is thin, the stresses due to in-plane strain can be approximated as uniform across the thickness of the membrane. The Laplace equation can be used to determine
Appendix A2.3 for the full derivation). From the maximum strain of the material, Emax, the minimum radius of curvature can be determined. The APerit calculated with this radius value, R, is the critical pressure that will generate critical strains and stresses, breaking the gel, and is given by
APrIt __ U t (2.4)
R
2.3.3 Micron-Scale Design: Stress Analysis Results
The self-assembling peptide used in this study was KFE8. Due to the recent discovery of these materials, data for the mechanical properties of a KFE8 hydrogel were not available. Data was available for another peptide, EFK8, for which the synthesis process was less robust. The two peptides share nearly identical sequences; the only difference is that a phenylalanine (F) in EFK8 (KFEFKFEF) is pulled from the end of the sequence and placed at the beginning of the KFE8 (FKFEFKFE) sequence. The similarities of the peptides are such that similar mechanical properties can be assumed. The material properties for the EFK8 peptide at a concentration of
10 mg/ml (-1 weight percent) are listed in Table 2.2. These values were used in the stress
analysis calculations.
Table 2.2. Mechanical properties of 10 mg/ml KFE8 peptide gel [24]
Young's modulus, E 14,700 Pa Max. elongation, Emax 0.012 (1.2 %) Fracture strength, Gmax 196.5 Pa
h = 25 pm, average fluid velocity Vaverage = 3 minm/s, and the fluid viscosity pfluid = pwater = 0.001
Pa-s.
2.3.3.1
Flow-Induced Stress Results
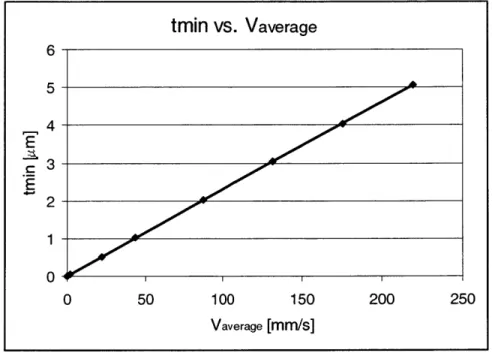
Typical average fluid velocity values are on the order of vaverage - 3 mm/s. The minimum
gel thickness that will not fracture under these conditions is 0.0815 pm (Figure 2.15).
tmin vs. Vaverage 6 5- 4-E r3- E2-0 -4 01 i 0 50 100 150 200 250 Vaverage [mm/s]
Figure 2.15. A plot of the minimum membrane thickness (t,, n) for the average velocity of flow
in the channels (Vaverage) for a fluid with the viscosity and density of water
An extremely thin gel can withstand surprisingly high flow velocities (for Vaverage = 10 rmm/s, twin
= 0.23 pm). The limiting membrane thickness will be determined by AP across the membrane,
2.3.3.2
Pressure Difference-Induced Stress Results
For a range of values for membrane thickness, t, critical pressures that will cause the gel to rupture for both bending effects and surface tension-induced strain were calculated, and the smaller APcrit value was identified. For values of t less than 10 microns (i.e., in the range of the Space of Disse), these pressures were very small, on the order of a few millimeters of water (Figure 2.16). The minimum membrane thickness will be determined by how well the pressure difference across the membrane can be controlled. The results show that these effects, and not the fluid flow shear stress, will determine the minimum thickness value of the membrane.
Critical Pressure vs. membrane thickness
7- 6-0E 4-+ bending E surface tension 2-0 0 2 4 6 8 10
membrane thickness [microns]
Figure 2.16. The pressure required to fracture the membrane for a range of membrane thicknesses
2.3.4 Transport Considerations
Initially during cell culture, oxygenated cell culture media is to be infused through the channel containing endothelial cells, as well as through the hepatocyte channel. However, once the cell culture is established, oxygenated cell culture medium will flow only through the endothelial cell ("capillary") channel to mimic the in vivo environment. It is important to
determine if oxygen and other nutrients will diffuse through the membrane in sufficient amounts to sustain the viability of the hepatocytes.
For a gel formed from a 10 mg/ml peptide solution (approximately equivalent to a 1 weight percent solution), the pore size is roughly 100 nanometers [24]. The gel is 99% water, so it is assumed that the diffusivity of solute through the gel is the same as through water. In our device, the hepatocytes will line channel b no more than 1 or 2 cells deep (see Figure 2.6). For such a low number of cells, it can be assumed that the rate of oxygen flux across the membrane is greater than or equal to the rate at which oxygen is consumed.
During membrane formation, the rate at which the peptide solution gels depends on how fast the salt ions diffuse into the peptide. If the salt ions are assumed to have the same mobility through the gel as in water, the time required for salt ions to diffuse completely through the peptide stream can be estimated. The approximate diffusional length scale, 6, for a species with diffusivity D is
3~2jDrdf3 (2.5)
where and rdff is the diffusional time scale. The width of the desired membrane, and thus the width of the peptide stream is t. Saline (DNaC1 = 1.483 x 10⁻⁵ cm2/s at NaCl concentration = 0.1
M, at 25'C [32]) will infiltrate the peptide stream from both sides, so
t
2 (2.6)
2
Substituting Eq.2.6 into Eq.2.5 gives
Ird , (2.7)
'd 16D
t
the time for salt to diffuse distance - in water (see Table 2.3). 2
2.4 Macro-Scale Device Design
In the device design of the micron-scale devices, 'macro-scale' refers to anything that is outside of the converged-channel region: inlet and outlet channels, hardware, and other instrumentation. Design requirements and constraints at the macro-scale will influence device design parameters at the micron-scale.
2.4.1 Flow Delivery
A standard syringe pump consists of a syringe mount and an actuator, which pushes or
pulls the syringe plunger. A single-actuator syringe pump allows multiple syringes to be mounted, but the actuator will move all the attached plungers at the same linear speed. The cross-section dimensions of the channels were chosen so that a single syringe pump pushing multiple syringes could infuse fluids into the channels at equal average velocities. For the trivial case of three equal-dimensioned channels, three identical syringes are attached to the syringe pump. For micron-scale channels with differing dimensions, syringes are chosen that have cross-sectional area ratios that are equal to those of the channels. With this equal average velocity constraint, the finite number of different commercially available syringes limits the possible combinations of channel geometries.
2.4.2 Visibility, Cost Reduction, and Pressure Regulation
The device area must be unobstructed by fluidic fittings or tubing, and there must be sufficient clearance on the top surface of the device to allow close positioning of the objective