HAL Id: hal-00297986
https://hal.archives-ouvertes.fr/hal-00297986
Submitted on 25 Mar 2008HAL is a multi-disciplinary open access
archive for the deposit and dissemination of sci-entific research documents, whether they are pub-lished or not. The documents may come from teaching and research institutions in France or abroad, or from public or private research centers.
L’archive ouverte pluridisciplinaire HAL, est destinée au dépôt et à la diffusion de documents scientifiques de niveau recherche, publiés ou non, émanant des établissements d’enseignement et de recherche français ou étrangers, des laboratoires publics ou privés.
A rapid transition from ice covered CO2-rich waters to a
biologically mediated CO2 sink in the eastern Weddell
Gyre
D. C. E. Bakker, M. Hoppema, M. Schröder, W. Geibert, H. J. W. de Baar
To cite this version:
D. C. E. Bakker, M. Hoppema, M. Schröder, W. Geibert, H. J. W. de Baar. A rapid transition from ice covered CO2-rich waters to a biologically mediated CO2 sink in the eastern Weddell Gyre. Biogeosciences Discussions, European Geosciences Union, 2008, 5 (2), pp.1205-1235. �hal-00297986�
BGD
5, 1205–1235, 2008From ice covered CO2-rich waters to a biological CO2 sink D. C. E. Bakker et al. Title Page Abstract Introduction Conclusions References Tables Figures ◭ ◮ ◭ ◮ Back Close
Full Screen / Esc
Printer-friendly Version Interactive Discussion Biogeosciences Discuss., 5, 1205–1235, 2008
www.biogeosciences-discuss.net/5/1205/2008/ © Author(s) 2008. This work is distributed under the Creative Commons Attribution 3.0 License.
Biogeosciences Discussions
Biogeosciences Discussions is the access reviewed discussion forum of Biogeosciences
A rapid transition from ice covered
CO
2
-rich waters to a biologically mediated
CO
2
sink in the eastern Weddell Gyre
D. C. E. Bakker1, M. Hoppema2, M. Schr ¨oder2, W. Geibert2,*, and H. J. W. de Baar3
1
School of Environmental Sciences, University of East Anglia, Norwich, UK
2
Alfred Wegener Institute for Polar and Marine Research, Bremerhaven, Germany
3
Royal Netherlands Institute for Sea Research, Texel, The Netherlands
*
now at: Earth Science, School of Geosciences, University of Edinburgh, UK
Received: 18 February 2008 – Accepted: 18 February 2008 – Published: 25 March 2008 Correspondence to: D. C. E. Bakker ([email protected])
BGD
5, 1205–1235, 2008From ice covered CO2-rich waters to a biological CO2 sink D. C. E. Bakker et al. Title Page Abstract Introduction Conclusions References Tables Figures ◭ ◮ ◭ ◮ Back Close
Full Screen / Esc
Printer-friendly Version Interactive Discussion Abstract
Circumpolar Deep Water (CDW), locally called Warm Deep Water (WDW), enters the Weddell Gyre in the southeast, roughly at 25◦E to 30◦E. In December 2002 and
January 2003 we studied the effect of entrainment of WDW on the fugacity of carbon dioxide (fCO2) and dissolved inorganic carbon (DIC) in Weddell Sea surface waters.
5
Ultimately the fCO2 difference across the sea surface drives CO2air-sea fluxes. Deep
CTD sections and surface transects of fCO2were made along the Prime Meridian, a northwest-southeast section, and along 17◦
E to 23◦
E during cruise ANT XX/2 on FS
Polarstern. Upward movement and entrainment of WDW into the winter mixed layer
had significantly increased DIC and fCO2 below the sea ice along 0◦W and 17◦E to
10
23◦E, notably in the southern Weddell Gyre. Nonetheless, the ice cover largely
pre-vented outgassing of CO2 to the atmosphere. During and upon melting of the ice,
biological activity rapidly reduced surface water fCO2by up to 100 µatm, thus creating
a sink for atmospheric CO2. Despite the tendency of the surfacing WDW to cause CO2 supersaturation, the Weddell Gyre may well be a CO2 sink on an annual basis due
15
to this effective mechanism involving ice cover and ensuing biological fCO2reduction.
Dissolution of calcium carbonate (CaCO3) in melting sea ice may also play a role in this rapid reduction of surface water fCO2. The CO2source tendency deriving from the
upward movement of “pre-industrial” CDW is declining, as atmospheric CO2levels
con-tinue to increase, and thus the CO2sink of the Weddell Gyre will continue to increase
20
as well (provided the upward movement of WDW does not change significantly).
1 Introduction
The Southern Ocean plays a pivotal role in the global carbon cycle. A considerable part of the global oceanic uptake of anthropogenic carbon dioxide (CO2) occurs in
this vast region (Sabine et al., 2004; McNeil et al., 2007). Recent observations and
25
BGD
5, 1205–1235, 2008From ice covered CO2-rich waters to a biological CO2 sink D. C. E. Bakker et al. Title Page Abstract Introduction Conclusions References Tables Figures ◭ ◮ ◭ ◮ Back Close
Full Screen / Esc
Printer-friendly Version Interactive Discussion they anthropogenic or not (Stephens and Keeling, 2000; Hoppema, 2004; Lenton and
Matear, 2007; Le Qu ´er ´e et al., 2007; Lovenduski et al., 2007; Zickfeld et al., 2007). Upwelling of CO2-enriched deep water and its long-term trends play the major role in
all these analyses.
The Weddell Gyre is an elongated, mainly wind-driven, cyclonic gyre (Gordon et
5
al., 1981) in the Atlantic sector of the Southern Ocean, south of the Antarctic Cir-cumpolar Current (ACC). Water flows westwards in the southern limb and eastwards in the northern limb of the gyre (Fig. 1). Due to its divergent nature, Ekman pump-ing causes major upward transport of subsurface water in the gyre’s interior. Forma-tion of deep and bottom water occurs in the southern and western parts of the gyre
10
(e.g. Carmack and Foster, 1975; Gordon et al., 1993; Foldvik et al., 2004); dense wa-ter originating here is found in most of the southern hemisphere as Antarctic Bottom Water (AABW). Surface water of the gyre is exchanged with the adjacent ACC along all of its northern and eastern boundaries. Subsurface water is supplied by the ACC, where it is swept into the Weddell Gyre at its eastern boundary, i.e. 25◦E to 30◦E
(Dea-15
con, 1979; Gouretski and Danilov, 1993; Schr ¨oder and Fahrbach, 1999). There may be another subsurface water supply near 20◦W (Bagriantsev et al., 1989). This
subsur-face water, known as Circumpolar Deep Water (CDW), but locally called Warm Deep Water (WDW), is recognized by its temperature maximum (Tmax) just underneath the
pycnocline. The highest Tmax are found in the southeastern Weddell Gyre, indicating
20
that that region is the main recipient of CDW source water (Deacon, 1979; Gouretski and Danilov, 1993). On its course through the gyre, the Tmax is attenuated by mixing
with waters above and below. As a result the temperature of Tmaxin the southern limb is higher than in the northern limb of the gyre. The Tmax is accompanied by maxima
of salinity, dissolved inorganic carbon (DIC), and nutrients and by an oxygen minimum
25
(Whitworth and Nowlin, 1987; Hoppema et al., 1997), although the exact depths of the extremes vary and may not be identical.
Seasonal ice coverage is a prominent feature of the Weddell Gyre. In the far west perennial ice is found, while towards the east the vast ice field disappears rapidly in
BGD
5, 1205–1235, 2008From ice covered CO2-rich waters to a biological CO2 sink D. C. E. Bakker et al. Title Page Abstract Introduction Conclusions References Tables Figures ◭ ◮ ◭ ◮ Back Close
Full Screen / Esc
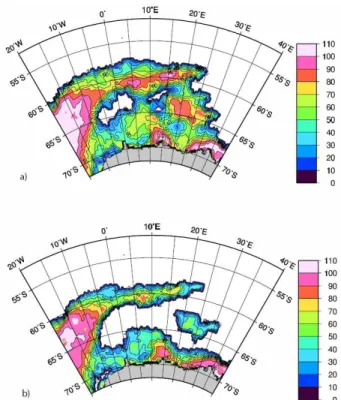
Printer-friendly Version Interactive Discussion late spring and early summer. Two stages of ice disappearance in the central and
eastern gyre are depicted for December 2002 (Fig. 2). By 17 December a transient polynya had formed within the melting ice pack northwest of Maud Rise (Fig. 2a), in a region, which has often been associated with ice melting events and polynyas (e.g. Martinson et al., 1981; Muench et al., 2001). On 24 December 2002, an ice-free
5
intrusion from the east had combined with the initial polynya. Seasonal ice coverage strongly impacts on the cycling of chemical species and biological processes. For example, chlorofluorocarbons (CFCs) and oxygen (O2) are strongly undersaturated, and CO2 is oversaturated in ice-covered Weddell Gyre surface waters relative to their
atmospheric contents (Gordon et al., 1984; Weiss et al., 1992; Bakker et al., 1997;
10
Klatt et al., 2002), indicating that ice caps the water column, thus hindering air-sea gas exchange.
The southeastern Weddell Gyre appears to be vital for exchange processes with the ACC and for preconditioning water masses for their course through the Weddell Gyre. It is a highly dynamical and variable region with many eddies resulting from
15
interactions of the ACC with topography (Gouretski and Danilov, 1993). Local deep-sea promontories, like Astrid Ridge and Maud Rise (Fig. 1), promote vertical mixing (Muench et al., 2001). Upward movement of the newly arriving CDW may well enhance vertical transport (Geibert et al., 2002). The relatively early break-up of the sea ice in the eastern Weddell Gyre (Fig. 2) may be related to the region’s dynamic hydrography.
20
With major interaction between surface waters and CDW, the eastern Weddell Gyre is likely to be important from a biogeochemical point of view, but little is known about it. In spring the partial pressure of CO2 (pCO2) in surface water varied strongly with both over- and undersaturation relative to atmospheric CO2 north of 60◦S (Bakker
et al., 1999), while in autumn surface water pCO2 was undersaturated (Hoppema et
25
al., 2000). Sparse chlorophyll and photosynthetic oxygen production data in December suggest low biological activity compared to adjacent regions (Odate et al., 2002). Satel-lite pigment data also point to low biological production (Sullivan et al., 1993; Moore and Abbott, 2000), while carbon export production is modelled to be among the lowest
BGD
5, 1205–1235, 2008From ice covered CO2-rich waters to a biological CO2 sink D. C. E. Bakker et al. Title Page Abstract Introduction Conclusions References Tables Figures ◭ ◮ ◭ ◮ Back Close
Full Screen / Esc
Printer-friendly Version Interactive Discussion of the Southern Ocean (Schlitzer, 2002). By contrast, modelled opal export production
is relatively high (Usbeck, 1999) and high densities of certain whales have been found in the eastern Weddell Gyre (Tynan, 1998). Further west around Maud Rise near 0◦W,
elevated densities of mammals, penguins and birds have been observed in mid-winter, which is thought to be related to wintering krill (Pl ¨otz et al., 1991).
5
It has been suggested that calcium carbonate (CaCO3) precipitates along brine
channels in sea ice (Jones and Coote, 1981; Rysgaard et al., 2007), thus reducing the alkalinity to DIC ratio and increasing fCO2in the brine. Any brine escaping from the
ice would transfer these CO2characteristics to the winter mixed layer. Hydrated CaCO3
crystals (ikaite, CaCO3.6H2O) have recently been detected in sea ice from the Weddell
10
Sea (Dieckmann et al., 2008). During and upon ice melt, the dissolving CaCO3could increase the alkalinity to DIC ratio and decrease fCO2 in surface water, at least if this
CaCO3were to dissolve in the melting ice or in the surface mixed layer.
Thus, a biogeochemical study of the eastern Weddell Gyre is appropriate. We visited the eastern and central Weddell Gyre, as the ice pack was opening up in late spring and
15
early summer, with the aim to assess the processes controlling surface layer carbon chemistry below the sea ice and upon the retreat of the sea ice. Our hypothesis is that both upwelling of WDW and ice cover exert a significant influence on the partial pressure of CO2 and the DIC concentration in surface waters. In addition, we test
whether the observations agree with the theory of the conversion of a pre-industrial
20
CO2source to a present-day annual CO2 sink in the Weddell Gyre (Hoppema, 2004).
Furthermore, we look for evidence supporting the hypothesis of reduced ventilation of CO2-rich, upwelled water by extensive sea ice coverage in the glacial Southern Ocean (Stephens and Keeling, 2000).
2 Methods
25
Inorganic carbon data were collected during cruise ANT XX/2 with the German ice breaker FS Polarstern starting and ending in Cape Town at 24 November 2002 and
BGD
5, 1205–1235, 2008From ice covered CO2-rich waters to a biological CO2 sink D. C. E. Bakker et al. Title Page Abstract Introduction Conclusions References Tables Figures ◭ ◮ ◭ ◮ Back Close
Full Screen / Esc
Printer-friendly Version Interactive Discussion 23 January 2003, respectively (F ¨utterer and Kattner, 2005). The ship made deep
sections with stations at 0.5◦ latitude spacing along the Prime Meridian, along a
northwest-southeast cross-transect and along 17◦E to 23◦E in the Weddell Gyre
(Figs. 1, 3). High resolution vertical profiles of potential temperature and salinity were obtained during the downcasts of the ship’s CTD (conductivity, temperature, depth)
5
(type Seabird 911+), while samples for DIC and other biogeochemical parameters were taken from the CTD rosette during the upward casts. Atmospheric pressure, sea surface temperature and salinity were measured by the ship’s sensors. While the ship was sailing, ice observations were made at almost hourly intervals from the bridge from 4 December 2002 to 3 January 2003, following the protocols by Worby et al. (1999).
10
The fugacity of CO2(fCO2) was determined from the sailing ship quasi-continuously in surface water and marine air. Water was drawn from about 10 m depth at the keel of the ship, while air was sampled from the crow’s nest. The fugacity of CO2is the partial
pressure of CO2 upon correction for non-ideal behaviour of CO2 gas. The measure-ments were performed with an automated sampling system designed after Wanninkhof
15
and Thoning (1993) based on a Li-COR 6262 infrared gas analyzer. Such a system has been used before during Polarstern cruises (e.g. Hoppema et al., 2000; Bellerby et al., 2004). Every three hours the measurements were calibrated by two out of three calibration gases, bracketing surface water fCO2. The calibration gases of 250.53,
374.36, and 453.65 µmol mol−1 had been calibrated to NOAA gas standards prior to
20
the cruise. Warming of the water between the seawater intake and the equilibrator ranged from 0.43◦C in subantarctic waters to 0.72◦C near the ice (standard deviation
of up to 0.2◦C for 60 000 data points).
The DIC concentration was determined by coulometry following the method of John-son et al. (1987). Samples were stored cold, were analysed within 24 h of collection
25
and were not poisoned. Certified reference material (CRM) of batch 53 (DOE, 1994) was used for each CTD cast and for each coulometric cell.
Surface water fCO2has been co-located to CTD casts by taking the average of fCO2
BGD
5, 1205–1235, 2008From ice covered CO2-rich waters to a biological CO2 sink D. C. E. Bakker et al. Title Page Abstract Introduction Conclusions References Tables Figures ◭ ◮ ◭ ◮ Back Close
Full Screen / Esc
Printer-friendly Version Interactive Discussion of the CTD returning to the surface. Alkalinity has been calculated from surface water
fCO2and DIC in the upper 25 m with the constants of Mehrbach et al. (1973), as revised
by Dickson and Millero (1987).
3 Results
3.1 Sea ice cover and surface water CO2parameters
5
The ship first reached the ice edge at 4 December 2002 on the Prime Meridian at 56.5◦
S, roughly on the northern boundary of the Weddell Gyre (Fig. 3a). Over the next month FS Polarstern sailed through fully ice covered waters, areas with melting sea ice and open water in the Weddell Gyre. Two maps of the satellite-derived ice fraction give a picture of the rapidly disappearing ice pack and of high spatial variability between
10
ice-covered waters and open water in December 2002 (Fig. 2). The ship finally left the ice pack in the eastern Weddell Gyre on 68.2◦S 18.1◦E on 3 January 2003 (Fig. 3a).
The fCO2difference between surface water and air, ∆fCO2(w–a), varied from strong
supersaturation to strong undersaturation along the cruise track in the Weddell Gyre (Fig. 3b). The distribution of DIC at 20 m depth showed a similar large spatial
vari-15
ability with a good correspondence between DIC and ∆fCO2(w–a) (Fig 3c). On the
Prime Meridian the ice coverage, ∆fCO2(w–a) and DIC were high in the northern
Wed-dell Gyre. Significantly lower ∆fCO2(w-a) and DIC were observed in a newly forming
polynya at 62◦
S to 65◦
S northwest of Maud Rise. A repeat visit to 61◦
S to 64◦
S along 0◦W highlights the reduction of surface water fCO
2 during sea ice melt over an 11
20
day period in this polynya (Fig. 4). On 8 to 10 December a significant fraction of the ice cover had disappeared, the remaining sea ice was melting rapidly, surface water fCO2was close to the atmospheric value and the sea surface temperature was –1.8 to
–1.7◦C. Eleven days later sea ice had disappeared along most of the section, surface
water fCO2 had been reduced by 10 to 25 µatm and the water had warmed by 0 to
25
0.8◦
BGD
5, 1205–1235, 2008From ice covered CO2-rich waters to a biological CO2 sink D. C. E. Bakker et al. Title Page Abstract Introduction Conclusions References Tables Figures ◭ ◮ ◭ ◮ Back Close
Full Screen / Esc
Printer-friendly Version Interactive Discussion or 1.0 to 3.4 µatm d−1 upon correction to a constant temperature. The highest rates
were found at 63◦S to 64◦S, where the ice melted first and a phytoplankton bloom
was developing. These maximum rates were only just below the fCO2 decrease of 3.8 µatm d−1
by phytoplankton growing at a maximum growth rate in an iron-fertilised algal bloom at 61◦S 139◦W (Bakker et al., 2001). This suggests that iron was abundant
5
and not limiting for phytoplankton growth in the Weddell surface layer during ice melt. South of the polynya ∆fCO2(w–a) and DIC were high in an area with thick ice cover
and melting sea ice (Figs. 2a, 3). Along the Antarctic coast ∆fCO2(w–a) values of below
–60 µatm were observed in a coastal polynya between 8◦W and 0◦W. In late December
the southeastern Weddell Gyre at 17◦
E to 23◦
E was in a rapid transition from ice cover
10
to open water (Fig. 2b), while fCO2varied from slight to strong supersaturation. All sea
ice had vanished, by the time the ship sailed northwards north of 68.2◦S 18.1◦E on
3 January 2003. Within ice-free waters we observed undersaturation of fCO2 and low
DIC in phytoplankton blooms between 58.5◦S and 62.5◦S along 23◦E.
3.2 The vertical distribution of temperature and DIC
15
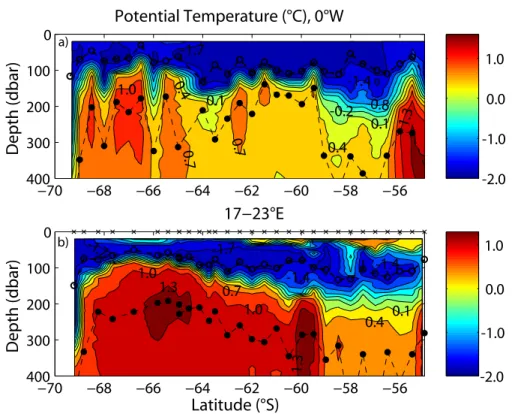
Contour plots of potential temperature in the upper 400 m along 0◦W and 17◦E to 23◦E
show the temperature maximum of the WDW, a temperature minimum above it and a shallow, relatively warm surface layer, where sea ice melting and subsequent warming had occurred (Fig. 5a, b). The stations closest to Antarctica are in the westward flowing Antarctic Coastal Current. The WDW had several local temperature maxima between
20
1.2◦C and 1.5◦C along both sections. Along 17◦E to 23◦E the core of WDW was
shallower in the south than further to the north (Fig. 5b), while this lateral variation was less pronounced along 0◦
W (Fig 5a). Effects due to the vicinity of Maud Rise are apparent in the temperature profiles along 0◦W between 63◦S and 66◦S (Fig. 5a). The
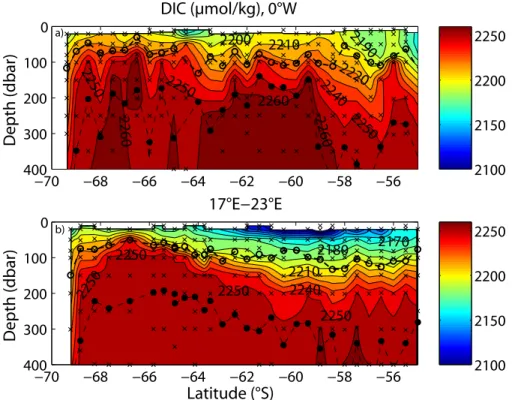
WDW is characterised by high DIC along both sections (Fig. 6a, b). The DIC maximum
25
at 300 m depth between 59.5◦S and 61.5◦S along 0◦W (Fig. 6a) is associated with
BGD
5, 1205–1235, 2008From ice covered CO2-rich waters to a biological CO2 sink D. C. E. Bakker et al. Title Page Abstract Introduction Conclusions References Tables Figures ◭ ◮ ◭ ◮ Back Close
Full Screen / Esc
Printer-friendly Version Interactive Discussion 1997).
A temperature minimum, a remnant of the winter mixed layer, was evident above the pycnocline (Fig. 5a, b). The depth of the winter mixed layer (WML) is defined here as the depth below the temperature minimum, where potential temperature exceeded the temperature minimum by 0.02◦C (Figs. 5, 7a, b). This 0.02◦
C increment has little effect
5
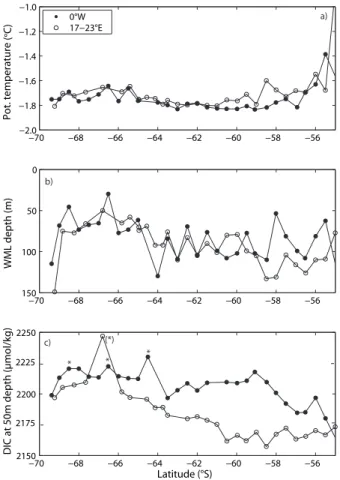
on the WML depth at most stations, but improves its selection at stations with a broad temperature minimum. The temperature of the temperature minimum was higher in the southern Weddell Gyre (–1.7◦C) than in the northern gyre (–1.8◦C) (Fig. 7a) and was
above the freezing temperature of seawater at –1.88◦C. This slight temperature excess
of the WML reflects the introduction of WDW heat into the mixed layer during winter
10
(Gordon et al., 1984). Winter mixed layers depths were 30 to 80 m in the southern gyre (64.5◦S to 69.0◦S) and 50 to 130 m in the northern gyre (57.5◦S to 64.0◦S) along both
sections (Fig. 7b). Stations at 66.8◦S 17.0◦E and 64.5◦S 0◦W had winter mixed layer
depths shallower than 50 m and high DIC at 50 m depth (Fig. 7b, c), possibly reflecting recent upward movement of WDW.
15
Samples for DIC were systematically taken at 50 and 100 m depth. Here DIC at 50 m depth is taken as a proxy for DIC in the winter mixed layer for stations with a WML depth exceeding 50 m (Fig. 7b, c). Spring-time processes may have influenced DIC at 50 m depth at a few stations. The DIC concentration at 50 m depth was higher by about 5 µmol kg−1 in the southern Weddell Gyre than further north along 0◦W, if the
20
station with a shallow winter mixed layer at 64.5◦
S is ignored (Fig. 7c). The northern Weddell Gyre along 23◦E had low DIC and salinity (not shown) in the upper 50 m.
This freshening cannot be explained by melting of sea ice alone and could reflect the presence of waters with an ACC origin, since surface waters in the ACC have lower salinity than in the Weddell Gyre.
25
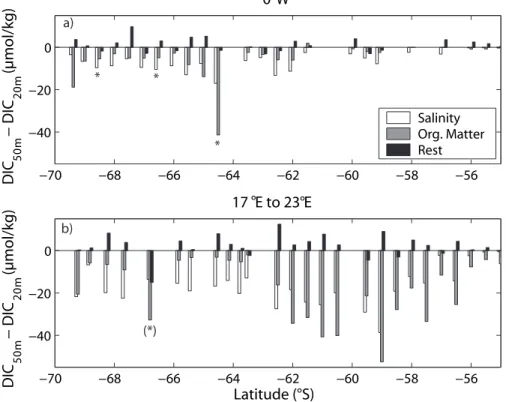
The DIC difference between 50 m and 20 m depth is a measure for changes in sur-face water DIC from winter to spring and summer (Fig. 8). The DIC change due to ice melting and other fresh water inputs was calculated by correcting DIC at 50 m depth to the salinity at 20 m depth. The DIC change resulting from organic matter production
BGD
5, 1205–1235, 2008From ice covered CO2-rich waters to a biological CO2 sink D. C. E. Bakker et al. Title Page Abstract Introduction Conclusions References Tables Figures ◭ ◮ ◭ ◮ Back Close
Full Screen / Esc
Printer-friendly Version Interactive Discussion was estimated from the change in nitrate from 50 m to 20 m, while assuming carbon to
nitrogen uptake in a ratio of 117 moles to 16 moles (Anderson and Sarmiento, 1994). Residual DIC changes included the effects of dissolution or precipitation of calcium carbonate and CO2air-sea exchange.
The mixed layer became shallower than 50 m, as the sea ice started melting, such
5
that absolute DIC changes between 50 m and 20 m increased along the cruise track from 0◦W to the eastern gyre (Fig. 8). The DIC changes were small north of 62◦S along
0◦W below heavy ice cover in early December. Ice melt and other freshwater inputs
locally reduced surface water DIC by 20 µmol kg−1 along 0◦W and by 40 µmol kg−1
along 17◦E to 23◦E. The inflow of surface water from the ACC may have contributed to
10
the large DIC reduction in the northeastern gyre. Organic matter production decreased DIC by 40–60 µmol kg−1 in phytoplankton blooms in a polynya at 64.5◦S 0◦W and in
open water in the northeastern Weddell Gyre. Residual DIC changes ranged from –15 to 12 µmol kg−1.
4 Discussion
15
The processes affecting CO2 chemistry in ice-covered waters and upon ice melt are
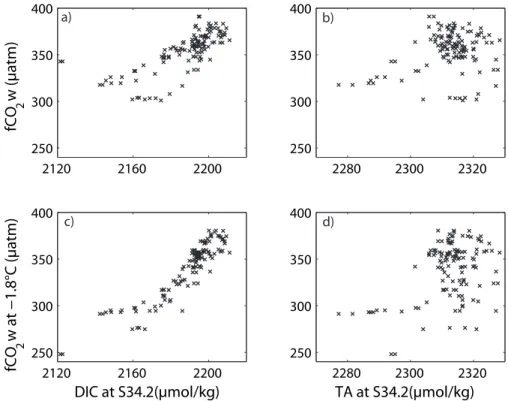
further studied by comparing the behaviour of fCO2, DIC and total alkalinity (TA) in surface water along the cruise track (Figs. 9, 10). The effect of ice melting on TA and DIC has been removed by normalisation to a salinity of 34.2. Freshening of surface water by ice melt barely affects fCO2as a result of compensating effects by lower DIC
20
and alkalinity.
Normalised DIC and fCO2 have a good correspondence (Fig. 9a), which is further
improved by correcting fCO2to a constant temperature of –1.8◦C (Fig. 9c). This
rela-tionship implies that processes affecting both parameters play a major role in the CO2
chemistry of Weddell Sea surface waters. The narrow range of normalised alkalinity of
25
2305 to 2330 µmol kg−1(Fig. 9b) reflects the conservative behaviour of alkalinity in the
BGD
5, 1205–1235, 2008From ice covered CO2-rich waters to a biological CO2 sink D. C. E. Bakker et al. Title Page Abstract Introduction Conclusions References Tables Figures ◭ ◮ ◭ ◮ Back Close
Full Screen / Esc
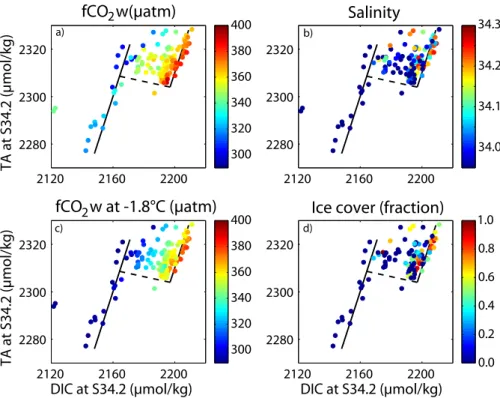
Printer-friendly Version Interactive Discussion Normalised DIC and TA cluster together with a ‘tail’ for data from the northeastern
Weddell Gyre (Fig. 10a). Lines with a slope of 2:1 delineate the cluster of points on the left and right. This ratio of 2:1 corresponds to changes in TA and DIC by calcifica-tion (negative changes) and CaCO3 dissolution (positive changes). For example, the right line corresponds to increases in normalised TA and DIC of 24 and 12 µmol kg−1
,
5
resulting in a decrease of surface water fCO2 by 27 µatm. Points closest to the right
line include the non-bloom stations along 0◦W, some data from the cross-section and
stations south of 64◦
S in the eastern gyre. Most stations with dense sea ice cover and high surface water salinity are close to the right line (red dots in Fig. 10b, d). If seasonal CaCO3-ice processes from one year dominated the observed changes in TA and DIC,
10
one would have expected these ‘ice’ stations to cluster together on the low end and nearby ice-free stations on the high end of the line, but this is not the case. Thus, the effect of CaCO3 processes in ice on fCO2 is consistent with our observations of high
fCO2below the winter ice and a decrease in fCO2during and upon ice melt. However,
we have failed to find any direct evidence for the CaCO3-ice hypothesis in our data,
15
other than the right line with a slope of 2:1 delineating the data.
Organic matter production would have changed DIC and TA in a ratio of –1 to +0.14 (Anderson and Sarmiento, 1994), as shown by the dashed line (Fig. 10c), which corresponds to a reduction in DIC and fCO2 by 33 µmol kg−1 and 90 µatm,
respec-tively, and an alkalinity increase of 4.6 µmol kg−1. The bloom stations at 0◦W appear
20
to the left of the right line with a 2:1 ratio, almost certainly reflecting organic matter production.
Data close to the left line (or “tail”) are from surface waters between 58.5◦S and
62.5◦
S along 23◦
E, which have low TA and DIC, a possible ACC origin and are home to an intense phytoplankton bloom. Along the tail surface water fCO2 increases by
25
38 µatm for decreases in TA and DIC of 46 and 23 µmol kg−1, respectively. The 2:1
slope of the line is an indication that the phytoplankton bloom at 23◦
E may have been dominated by calcifying phytoplankton, but we have no further evidence for this.
BGD
5, 1205–1235, 2008From ice covered CO2-rich waters to a biological CO2 sink D. C. E. Bakker et al. Title Page Abstract Introduction Conclusions References Tables Figures ◭ ◮ ◭ ◮ Back Close
Full Screen / Esc
Printer-friendly Version Interactive Discussion spring in the Weddell Gyre (Fig. 3). Upward movement and entrainment of DIC-rich
WDW into the winter mixed layer contributed strongly to these high values. Tempera-tures and DIC were higher at the temperature minimum, while winter mixed layers were shallower, in the southern than in the northern gyre (Fig. 7a–c). This suggests that the upward movement and entrainment of WDW into the winter mixed layer were stronger
5
in the southern gyre than further north, both along 17◦E to 23◦E and along 0◦W, as
was previously suggested for waters near 0◦W (Gordon and Huber, 1990). It is likely
that upward movement and entrainment of WDW into the mixed layer continued below the sea ice, at least while air temperatures were cold enough (e.g. below –10◦C) to
remove the heat from the WDW input (Gordon and Huber, 1990).
10
While the ice and leads in the ice would have allowed heat to escape from the winter mixed layer to the atmosphere, the ice cover would have prevented release of CO2and
other gases (Gordon et al., 1984; Klatt et al., 2002). Assuming that only insignificant gas exchange occurs through the ice itself (in contrast to some recent publications; e.g. Anderson et al., 2004), ice reduces the fetch of the wind and the gas transfer velocity
15
in leads in the ice. In non-ice covered waters dissolved CO2 takes many months to
reach equilibrium with the atmospheric CO2 content by air-sea gas exchange, as a consequence of the large carbonate buffer in seawater (Broecker and Peng, 1982). The bottom line is that we expect supersaturation of CO2 under the sea-ice pack due
to upwelling and entrainment of WDW into the winter mixed layer, in agreement with our
20
measurements and with earlier observations in the wintertime Weddell Gyre (Weiss et al., 1992).
Ice melting first occurred northwest of Maud Rise in the first half of December 2002, creating a transient polynya (Fig. 2). Relatively early ice melting at 60◦S to 61◦S
and 66◦S to 67◦S along 17◦E to 23◦E in mid-December coincided with the presence
25
of warm WDW cores below the winter mixed layer (Figs. 2, 5b). Ice melting itself reduced surface water DIC by up to 40 µmol kg−1
through dilution (Fig. 8), but did not significantly affect fCO2, as a result of compensating effects of lower DIC and alkalinity
BGD
5, 1205–1235, 2008From ice covered CO2-rich waters to a biological CO2 sink D. C. E. Bakker et al. Title Page Abstract Introduction Conclusions References Tables Figures ◭ ◮ ◭ ◮ Back Close
Full Screen / Esc
Printer-friendly Version Interactive Discussion and DIC by up to 100 µatm and 60 µmol kg−1, respectively (Figs. 3, 8), thus converting
a potential oceanic CO2 source into a sink for atmospheric CO2. This reduction of
fCO2 from supersaturation to undersaturation already started during ice melt, as is shown by fCO2 close to the atmospheric value on the repeat section along 0◦W on 8
to 10 December (Fig. 4). Zemmelink et al. (2008) have demonstrated that biological
5
activity occurs in leads in Weddell Sea ice in early spring.
Sea ice in regions with ice melt frequently had a brown layer of about 5 cm thick, indicative of ice algae, somewhat above the ice-water interface. It is probable that the ice algae had taken up DIC from the surrounding brine and that mixing in of this brine contributed to the rapid reduction of surface water fCO2and DIC during ice melt.
10
We have found no direct evidence of the effects of CaCO3 processes in sea ice on
CO2 chemistry in surface water other than an overall change in TA and DIC in a ratio of 2:1 (Fig. 10). Surface water fCO2 decreased at a rate of 1.0 to 2.5 µatm d−1 in a
phytoplankton bloom on the repeat section at 0◦W (Fig. 4). Since surface water fCO 2
was close to the atmospheric CO2 value during our first visit, biological CO2 uptake
15
for 11 days sufficed to create a small CO2 sink, by which time the ice had almost
completely disappeared.
Our observations of high wintertime CO2values below the ice with rapid transition to a biologically-mediated CO2sink during and upon ice melt fit well with other data from the region. Notably supersaturation of fCO2 by 0 to 40 µatm was determined in the
20
southeastern Weddell Gyre in June-November 1986 during ANT V/2 and V/3 (Weiss et al., 1992), while strong undersaturation of fCO2by 60 to 130 µatm, was found along the Prime Meridian in January to February 1984 during Ajax 2 (Weiss et al., 1992).
Past cruises along 0◦W hint at an opposite shift from fCO
2undersaturation to
super-saturation in autumn. In 1996 modest supersuper-saturation by 10 µatm and undersuper-saturation
25
by 15 µatm and were observed north and south of about 60◦S, respectively (Hoppema
et al., 2000). By contrast, in April to May 1998 surface water fCO2was supersaturated
by 20 to 30 µatm south of 64◦S, while mixed layers were significantly deeper and more
BGD
5, 1205–1235, 2008From ice covered CO2-rich waters to a biological CO2 sink D. C. E. Bakker et al. Title Page Abstract Introduction Conclusions References Tables Figures ◭ ◮ ◭ ◮ Back Close
Full Screen / Esc
Printer-friendly Version Interactive Discussion (more) entrainment of WDW into the mixed layer had occurred in 1998 than in 1996
(Bellerby et al., 2004). Further north fCO2was similar in autumn 1996 and 1998. High fCO2values in autumn before the formation of the sea ice pack would provide a short
window for CO2outgassing to the atmosphere.
Thus, high biological carbon uptake during and upon melting of the sea ice in late
5
spring and summer creates a seasonal and annual CO2 sink, as ice impedes
out-gassing of CO2from upwelled CO2-rich waters below the winter ice. It is possible that
dissolution of CaCO3during ice melt plays a role in the reduction of fCO2. These find-ings are in agreement with the Weddell Sea as a CO2sink (Hoppema et al., 1999; Stoll
et al., 1999). A similar mechanism has been proposed for the seasonally ice-covered
10
Northeast Water Polynya off Greenland (Yager et al., 1995), where waters below the winter ice are supersaturated in CO2due to strong remineralisation of organic matter,
but where rapid biological carbon uptake creates an annual CO2sink upon melting of
the sea ice.
The modern Weddell Gyre CO2 sink is thus pre-conditioned by upwelling of CO2
-15
charged WDW and rapid biological carbon uptake during and upon ice melt. In pre-industrial times the relative CO2 source from the upwelled water would have been stronger by about 100 µatm, thus creating an overall, annual CO2 source (Hoppema,
2004) with biologically mediated, summertime supersaturation of surface water fCO2
by 50 µatm, assuming that biological carbon uptake did not change much.
20
Gordon and Huber (1990) estimated the residence time of Weddell Sea surface wa-ter as 2.5 years, based on an average annual upwelling of WDW of 45 m close to the Prime Meridian with higher upwelling of 50 to 75 m in the southern gyre. Hoppema et al. (1995) derived an annual upwelling of 30 m for the western Weddell Gyre at 65◦S 40◦W. Surface water leaves the Weddell Gyre as surface water flowing into the
25
ACC along the northern boundary of the gyre or as AABW, which is formed along the southern and southwestern margins of the gyre. The above suggests that upwelled WDW in the southern Weddell Gyre, with its high upwelling rates and short ice free periods (5 months per year), has little opportunity for exchanging gases with the
atmo-BGD
5, 1205–1235, 2008From ice covered CO2-rich waters to a biological CO2 sink D. C. E. Bakker et al. Title Page Abstract Introduction Conclusions References Tables Figures ◭ ◮ ◭ ◮ Back Close
Full Screen / Esc
Printer-friendly Version Interactive Discussion sphere, before some of it becomes part of AABW. This fits well with observations of
low CFC concentrations in the surface water source of AABW (Klatt et al., 2002) and estimates of a low anthropogenic CO2 content in AABW (Poisson and Chen, 1987;
Hoppema et al., 2001).
The distribution of O2at 100 m depth shows a distinct minimum between 65◦S and
5
69◦S in the eastern and central Weddell Gyre (Olbers et al., 1992; this study), reflecting
the upwelling of O2-poor (and CO2-rich) WDW. The O2 minimum is particularly deep
at 10◦W to 10◦E in and extends into the western gyre (Olbers et al., 1992). The O 2
minimum is found in a discontinuous, circumpolar band around Antarctica, which sug-gests that upwelling of CDW at a short distance off Antarctica also occurs in the ACC,
10
rather than in the Weddell Gyre alone. It remains to be seen whether seasonal sea ice coverage and rapid summertime biological carbon uptake equally prevent ventilation of the CO2from this discontinuous ring of upwelled CDW around Antarctica.
Our observations of a rapid transition from ice-covered CO2-rich waters to a biologi-cally mediated CO2sink during and upon ice melt support the hypothesis by Stephens
15
and Keeling (2000) that more winter-time sea ice cover in glacial periods would have reduced wintertime ventilation of CO2in the Southern Ocean, thus contributing to the observed decrease in atmospheric CO2. Even if the Antarctic sea ice would have
melted back in glacial summer, rapid biological CO2 uptake during and upon ice melt
would have prevented outgassing of CO2.
20
5 Conclusions
The observations demonstrate high DIC in the winter mixed layer by upwelling and en-trainment of WDW in the eastern Weddell Gyre. Seasonal sea ice cover prevents out-gassing from these CO2-rich waters. Rapid biological CO2uptake during and upon ice
melt creates a summertime CO2sink. Despite the tendency of the surfacing of WDW to
25
cause CO2supersaturation, the Weddell Gyre may well be a CO2sink on an annual ba-sis due to this effective fCO2reduction mechanism, as suggested by Hoppema (2004).
BGD
5, 1205–1235, 2008From ice covered CO2-rich waters to a biological CO2 sink D. C. E. Bakker et al. Title Page Abstract Introduction Conclusions References Tables Figures ◭ ◮ ◭ ◮ Back Close
Full Screen / Esc
Printer-friendly Version Interactive Discussion The CO2source tendency deriving from the upward movement of ‘pre-industrial’ CDW
is currently declining, as atmospheric CO2levels continue to increase. Thus, the CO2
sink of the Weddell Gyre will continue to increase (provided the upward movement of WDW does not change much). Our observations seem to support the hypothesis that an increase in sea ice coverage contributed to the decrease of atmospheric CO2 in
5
glacial periods (Stephens and Keeling, 2000).
Acknowledgements. We are grateful to the captain and crew of FS Polarstern and chief
scien-tist F ¨utterer for a memorable cruise. O. Klatt (AWI) directed the shipboard ice observations, to which many scientists on board contributed. We want to thank E. Fahrbach (AWI) and Y. Bozec (formerly at the Royal Netherlands Institute for Sea Research) for providing pre-cruise support
10
and A. Wisotzki (AWI) for making the ice maps. J. Bendtsen (Natural Environmental Research Institute, Denmark) made us revisit CaCO3 processes in ice. The Royal Society (JEB/15221) and the CARBOOCEAN (GOCE-511176-1) and CASIX (Centre for Observations of Air-Sea In-teractions and Fluxes, NER/F14/G6/115) projects provided funding for the research. The Alfred Wegener Institute is gratefully acknowledged for hosting D. Bakker as a guest scientist.
15
References
Anderson, L. A. and Sarmiento, J. L.: Redfield ratios of remineralization determined by nutrient data analysis, Global Biogeochem. Cy., 8, 65–80, 1994.
Anderson, L. G., Falck, E., Jones, E. P., Jutterstr ¨om, S., and Swift, J. H.: Enhanced uptake of atmospheric CO2 during freezing of seawater: A field study in Storfjorden, Svalbard, J.
20
Geophys. Res., 109, C06004, doi:10.1029/2003JC002120, 2004.
Anderson, L. G., Holby, O., Lindegren, R., and Ohlson, M.: The transport of anthropogenic carbon dioxide into the Weddell Sea, J. Geophys. Res., 96, 16 679–16 687, 1991.
Bagriantsev, N. V., Gordon, A. L., and Huber, B. A.: Weddell Gyre: Temperature maximum stratum, J. Geophys. Res., 94, 8331–8334, 1989.
25
Bakker, D. C. E., De Baar, H. J. W., and Bathmann, U. V.: Changes of carbon dioxide in surface waters during spring in the Southern Ocean, Deep-Sea Res. II, 44, 91–127, 1997.
BGD
5, 1205–1235, 2008From ice covered CO2-rich waters to a biological CO2 sink D. C. E. Bakker et al. Title Page Abstract Introduction Conclusions References Tables Figures ◭ ◮ ◭ ◮ Back Close
Full Screen / Esc
Printer-friendly Version Interactive Discussion
salinity of dissolved inorganic carbon in East Atlantic surface waters, Mar. Chem., 65, 263– 280, 1999.
Bakker, D. C. E., Watson, A. J., and Law, C. S.: Southern Ocean iron enrichment promotes inorganic carbon drawdown, Deep-Sea Res. II, 48, 2483–2507, 2001.
Bellerby, R. G. J., Hoppema, M., Fahrbach, E., De Baar, H. J. W., and Stoll, M. H. C.:
Interan-5
nual controls on Weddell Sea surface water fCO2during the autumn-winter transition phase, Deep-Sea Res. I, 51, 793–808, 2004.
Broecker, W. S. and Peng, T.-H.: Tracers in the Sea, Eldigio Press, Palisades, NY, USA, 690 pp., 1982.
Carmack, E. C. and Foster, T. D.: On the flow of water out of the Weddell Sea, Deep-Sea Res.,
10
22, 711–724, 1975.
Comiso, J.: Bootstrap sea ice concentrations from NIMBUS-7 SMMR and DMSP SSM/I, Na-tional Snow and Ice Data Center, Boulder, Colorado, USA, 1999, updated 2007.
Deacon, G. E. R.: The Weddell Gyre, Deep-Sea Res., 26A, 981–995, 1979.
Dickson, A. G. and Millero, F. J.: A comparison of the equilibrium constants for the dissociation
15
of carbonic acid in seawater media, Deep-Sea Res., 34, 1733–1743, 1987.
Dieckmann, G. S., Nehrke, G., Papadimitriou, S., G ¨ottlicher, J., Steininger, R., Kennedy, H., Wolf-Gladrow, D., and Thomas, D. N.: Calcium carbonate as ikaite crystals in Antarctic sea ice, Geophys. Res. Abst., 10, EGU2008-A-04640, 2008.
DOE: Handbook of methods for the analysis of the various parameters of the carbon dioxide
20
system in sea water; version 2, edited by: Dickson, A. G. and Goyet, C., ORNL/CDIAC-74, 1994.
ETOPO 5: Digital relief of the surface of the earth, Data Announcement 88-MGG-02, NOAA, Natl. Geophys. Data Center, Boulder, Colorado, USA, 1988.
Foldvik, A., Gammelsrød, T., Østerhus, S., Fahrbach, E., Rohardt, G., Schr ¨oder, M., Nicholls, K.
25
W., Padman, L., and Woodgate, R. A.: Ice shelf water overflow and bottom water formation in the southern Weddell Sea, J. Geophys. Res., 109, C02015, doi:10.1029/2003JC002008, 2004.
F ¨utterer, D. K. and Kattner, G.: The Expedition ANTARKTIS-XX of RV “Polarstern” in 2002/2003, Berichte zur Polar- und Meeresforschung, 495, 1–106, 2005.
30
Geibert, W., Rutgers van der Loeff, M. M., Hanfland, C., and Dauelsberg, H.-J.: Actinium-227 as a deep-sea tracer: Sources, distribution and applications, Earth. Planet. Sc. Lett., 198, 147–165, 2002.
BGD
5, 1205–1235, 2008From ice covered CO2-rich waters to a biological CO2 sink D. C. E. Bakker et al. Title Page Abstract Introduction Conclusions References Tables Figures ◭ ◮ ◭ ◮ Back Close
Full Screen / Esc
Printer-friendly Version Interactive Discussion
Gordon, A. L. and Huber, B. A.: Southern Ocean winter mixed layer, J. Geophys. Res., 95, 11 655–11 672, 1990.
Gordon, A. L., Chen, C. T. A., and Metcalf, W. G.: Winter mixed layer entrainment of Weddell Deep Water, J. Geophys. Res., 89, 637–640, 1984.
Gordon, A. L., Huber, B. A., Hellmer, H. H., and Field, A.: Deep and bottom water of the Weddell
5
Sea’s western rim, Science, 262, 95–97, 1993.
Gordon, A. L., Martinson, D. G., and Taylor, H. W.: The wind-driven circulation in the Weddell-Enderby Basin, Deep-Sea Res., 28A, 151–163, 1981.
Gouretski, V. V. and Danilov, A. I.: Weddell Gyre: Structure of the eastern boundary, Deep-Sea Res. I, 40, 561–582, 1993.
10
Hoppema, M.: Weddell Sea turned from source to sink for atmospheric CO2 between pre-industrial time and present, Global Planet. Change, 40, 219–231, 2004.
Hoppema, M., Fahrbach, E., and Schr ¨oder, M.: On the total carbon dioxide and oxygen sig-nature of the Circumpolar Deep Water in the Weddell Gyre, Oceanol. Acta, 20, 783–798, 1997.
15
Hoppema, M., Fahrbach, E., Schr ¨oder, M., Wisotzki, A. and De Baar, H. J. W.: Winter-summer differences of carbon dioxide and oxygen in the Weddell Sea surface layer, Mar. Chem., 51, 177–192, 1995.
Hoppema, M., Fahrbach, E., Stoll, M. H. C., and De Baar, H. J. W.: Annual uptake of atmo-spheric CO2by the Weddell Sea derived from a surface layer balance, including estimations
20
of entrainment and new production, J. Mar. Systems, 19, 219–233, 1999.
Hoppema, M., Roether, W., Bellerby, R. G. J. and De Baar, H. J. W.: Direct measurements reveal insignificant storage of anthropogenic CO2 in the abyssal Weddell Sea, Geophys. Res. Lett., 28, 1747–1750, 2001.
Hoppema, M., Stoll, M. H. C., and De Baar, H. J. W.: CO2in the Weddell Gyre and Antarctic
25
Circumpolar Current: Austral autumn and early winter, Mar. Chem., 72, 203–220, 2000. Johnson, K. M., Sieburth, J. M., Williams, P. J. B., and Brandstr ¨om, L.: Coulometric total carbon
dioxide analysis for marine studies: Automation and calibration, Mar. Chem., 21, 117–133, 1987.
Jones, E. P. and Coote, A. R.: Oceanic CO2 produced by the precipitation of CaCO3 from
30
brines in sea ice, J. Geophys. Res., 86, 11 041–11 043, 1981.
Klatt, O., Roether, W., Hoppema, M., Bulsiewicz, K., Fleischmann, U., Rodehacke, C., Fahrbach, E., Weiss, R. F., and Bullister, J. L.: Repeated CFC sections at the Greenwich
BGD
5, 1205–1235, 2008From ice covered CO2-rich waters to a biological CO2 sink D. C. E. Bakker et al. Title Page Abstract Introduction Conclusions References Tables Figures ◭ ◮ ◭ ◮ Back Close
Full Screen / Esc
Printer-friendly Version Interactive Discussion
Meridian in the Weddell Sea, J. Geophys. Res., 107, 3030, doi:10.1029/2000JC000731, 2002.
Le Qu ´er ´e, C. L., R ¨odenbeck, C., Buitenhuis, E. T., Conway, T. J., Langenfelds, R., Gomez, A., Labuschagne, C., Ramonet, M., Nakazawa, T., Metzl, N., Gillett, N., and Heimann, M.: Saturation of the Southern Ocean CO2 sink due to recent climate change, Science, 316,
5
1735–1738, 2007.
Lenton, A. and Matear, R. J.: Role of the Southern Annular Mode (SAM) in Southern Ocean CO2uptake, Global Biogeochem. Cy., 21, GB2016, doi:10.1029/2006GB002714, 2007. Lovenduski, N. S., Gruber, N., Doney, S. C., and Lima, I. D.: Enhanced CO2outgassing in the
Southern Ocean from a positive phase of the Southern Annular Mode, Global Biogeochem.
10
Cy., 21, GB2026, doi:10.1029/2006GB002900, 2007.
Martinson, D. G., Killworth, P. D., and Gordon, A. L.: A convective model for the Weddell Polynya, J. Phys. Oceanogr., 11, 466–488, 1981.
McNeil, B. I., Metzl, N., Key, R. M., Matear, R. J., and Corbi `ere, A.: An empirical es-timate of the Southern Ocean air-sea CO2 flux, Global Biogeochem. Cy., 21, GB3011,
15
doi:10.1029/2007GB002991, 2007.
Mehrbach, C., Culberson, C. H., Hawley, J. E., and Pytkowicz, R. M.: Measurement of the ap-parent dissociation constants of carbonic acid in seawater at atmospheric pressure, Limnol. Oceanogr., 18, 897–907, 1973.
Moore, J. K. and Abbott, M. R.: Phytoplankton chlorophyll distributions and primary production
20
in the Southern Ocean, J. Geophys. Res., 105, 28 709–28 722, 2000.
Muench, R. D., Morison, J. H., Padman, L., Martinson, D., Schlosser, P., Huber, B., and Hohmann, R.: Maud Rise revisited, J. Geophys. Res., 106, 2423–2440, 2001.
Odate, T., Furuya, K., and Fukuchi, M.: Photosynthetic oxygen production and community respiration in the Indian sector of the Antarctic Ocean during austral summer, Polar Biol., 25,
25
859–864, 2002.
Olbers, D., Gouretski, V., Seiss, G., and Schr ¨oter, J.: Hydrographic Atlas of the Southern Ocean, Alfred Wegener Institute, Bremerhaven, 1992.
Orsi, A. H., Whitworth III, T., and Nowlin Jr., W. D.: On the meridional extent and fronts of the Antarctic Circumpolar Current, Deep-Sea Res. I, 42, 641–673, 1995.
30
Pl ¨otz, J., Weidel, H., and Bersch, M.: Winter aggregations of marine mammals and birds in the north-eastern Weddell Sea pack ice, Polar Biol., 11, 305–309, 1991.
BGD
5, 1205–1235, 2008From ice covered CO2-rich waters to a biological CO2 sink D. C. E. Bakker et al. Title Page Abstract Introduction Conclusions References Tables Figures ◭ ◮ ◭ ◮ Back Close
Full Screen / Esc
Printer-friendly Version Interactive Discussion
Water?, Deep-Sea Res., 34, 1255–1275, 1987.
Rysgaard, S., Glud, R. N., Sejr, M. K., Bendtsen, J., and Christensen, P. B.: Inorganic carbon transport during sea ice growth and decay: A carbon pump in polar seas, J. Geophys. Res. 112, C03016, doi:10.1029/2006JC003572, 2007.
Sabine, C. L., Feely, R. A., Gruber, N., Key, R. M., Lee, K., Bullister, J. L., Wanninkhof, R.,
5
Wong, C. S., Wallace, D. W. R., Tilbrook, B., Millero, F. J., Peng, T.-H., Kozyr, A., Ono, T., and Rios, A. F.: The oceanic sink for anthropogenic CO2, Science, 305, 367–371, 2004. Schlitzer, R.: Carbon export fluxes in the Southern Ocean: results from inverse modeling and
comparison with satellite-based estimates, Deep-Sea Res. II, 49, 1623–1644, 2002.
Schr ¨oder, M., and Fahrbach, E.: On the structure and the transport of the eastern Weddell
10
Gyre, Deep-Sea Res. II, 46, 501–527, 1999.
Smith, W. H. F., Sandwell, D. T.: Global sea floor topography from satellite altimetry and ship depth soundings, Science, 277, 1956–1962, 1997.
Stephens, B. B. and Keeling, R. F.: The influence of Antarctic sea ice on glacial-interglacial CO2variations, Nature, 404, 171–174, 2000.
15
Stoll, M. H. C., De Baar, H. J. W., Hoppema, M., and Fahrbach, E.: New early winter fCO2data reveal continuous uptake of CO2by the Weddell Sea, Tellus, 51B, 679–687, 1999.
Sullivan, C. W., Arrigo, K. R., McClain, C. R., Comiso, J. C., and Firestone, J.: Distributions of phytoplankton blooms in the Southern Ocean, Science, 262, 1832–1837, 1993.
Tynan, C. T.: Ecological importance of the Southern Boundary of the Antarctic Circumpolar
20
Current, Nature, 392, 708–710, 1998.
Usbeck, R.: Modeling of marine biogeochemical cycles with an emphasis on vertical particle fluxes, Ph.D. thesis, Alfred Wegener Institute, Bremerhaven, Berichte zur Polarforschung, 332, 1–105, 1999.
Wanninkhof, R. and Thoning, K.: Measurement of fugacity of CO2in surface water using
con-25
tinuous and discrete sampling methods, Mar. Chem., 44, 189–205, 1993.
Weiss, R. F., Van Woy, F. A., and Salameh, P. K.: Surface water and atmospheric carbon dioxide and nitrous oxide observations by shipboard automated gas chromatography: Results from expeditions between 1977 and 1990, Scripps Inst. of Oceanogr. Ref. 92-11, ORNL/CDIAC-59, NDP-044, Carbon Dioxide Information Analysis Center, 144 pp., 1992.
30
Whitworth III, T. and Nowlin Jr., W. D.: Water masses and currents of the Southern Ocean at the Greenwich Meridian, J. Geophys. Res., 92, 6462–6476, 1987.
BGD
5, 1205–1235, 2008From ice covered CO2-rich waters to a biological CO2 sink D. C. E. Bakker et al. Title Page Abstract Introduction Conclusions References Tables Figures ◭ ◮ ◭ ◮ Back Close
Full Screen / Esc
Printer-friendly Version Interactive Discussion
sea ice thickness and characteristics. Part I Observational technique and results, Part II User operating manual, Antarctic CRC, Res. rep. 14, 63 pp., 1999.
Yager, P. L., Wallace, D. W. R., Johnson, K. M., Smith Jr., W. O., Minnett, P. J., and Deming, J. W.: The Northeast water polynya as an atmospheric CO2 sink: A seasonal rectification hypothesis, J. Geophys. Res., 100, 4389–4398, 1995.
5
Zemmelink, H. J., Houghton, L., Dacey, J. W. H., Stefels, J., Koch, B. P., Schr ¨oder, M., Wisotzki, A., Scheltz, A., Thomas, D. N., Papadimitriou, S., Kennedy, H., Kuosa, H., and Dittmar, T.: Stratification and the distribution of phytoplankton, nutrients, inorganic carbon and sulfur in the surface waters of Weddell Sea leads, Deep-Sea Res. II, 55, doi:10.1016/j.dsr2.2007.12011, in press, 2008.
10
Zickfeld, K., Fyfe, J. C., Saenko, O. A., Eby, M., and Weaver, A. J.: Response of the global carbon cycle to human-induced changes in Southern Hemisphere winds, Geophys. Res. Letters, 34, L12712, doi:10.1029/2006GL028797, 2007.
BGD
5, 1205–1235, 2008From ice covered CO2-rich waters to a biological CO2 sink D. C. E. Bakker et al. Title Page Abstract Introduction Conclusions References Tables Figures ◭ ◮ ◭ ◮ Back Close
Full Screen / Esc
Printer-friendly Version Interactive Discussion Bouvet Astrid Ridge Gunnerus Ridge Antarctic Peninsula AFRICA ANTARCTICA SOUTH AMERICA 20
Argentine Basin Cape Basin
Agulhas Basin Weddell Sea Rönne Iceshelf Filchner Iceshelf Scotia Sea Southwest Indian Ridge South Georgia Maud Rise
Fig. 1. Map of the Weddell Sea with schematically the deep inflow of Circumpolar Deep
Wa-ter (CDW) (red) at 25◦E to 30◦E, the Antarctic Coastal Current (purple), and the formation
and outflow of Weddell Sea Bottom Water and Antarctic Bottom Water (blue). The Antarctic Circumpolar Current (ACC) is in green. The research area is within the dashed frame.
BGD
5, 1205–1235, 2008From ice covered CO2-rich waters to a biological CO2 sink D. C. E. Bakker et al. Title Page Abstract Introduction Conclusions References Tables Figures ◭ ◮ ◭ ◮ Back Close
Full Screen / Esc
Printer-friendly Version Interactive Discussion
Fig. 2. Maps of the distribution of sea ice (%) in the central and eastern Weddell Gyre for (a)
BGD
5, 1205–1235, 2008From ice covered CO2-rich waters to a biological CO2 sink D. C. E. Bakker et al. Title Page Abstract Introduction Conclusions References Tables Figures ◭ ◮ ◭ ◮ Back Close
Full Screen / Esc
Printer-friendly Version Interactive Discussion
Fig. 3. (a) Sea ice concentration (fraction), (b) the difference of fCO2 between surface water
and marine air, ∆fCO2(w–a), and (c) DIC at 20 m depth with the timing of the sampling along
the cruise track in December 2002 and January 2003. The Antarctic coast line (ETOPO 5, 1988) and depth contours at 2000 m and 4000 m (Smith and Sandwell, 1997, version 8.2) have been indicated. The average position of the ACC-Weddell Boundary (AWB) is given (thick black line) (Orsi et al., 1995). Topographic features are Maud Rise (MR), Astrid Ridge (AR), the Mid-Atlantic Ridge (MAR), and the Southwest Indian Ridge (SWIR).
BGD
5, 1205–1235, 2008From ice covered CO2-rich waters to a biological CO2 sink D. C. E. Bakker et al. Title Page Abstract Introduction Conclusions References Tables Figures ◭ ◮ ◭ ◮ Back Close
Full Screen / Esc
Printer-friendly Version Interactive Discussion −64 −63 −62 −61 0.0 0.5 1.0 Icefraction 0°W,repeat −64 −63 −62 −61 −40 −20 0 20 dfCO 2 (µatm) 0°W,repeat −64 −63 −62 −61 -2.0 -1.5 -1.0 SST(°C) Latitude(°S) −64 −63 −62 −61 −40 −20 0 20 dfCO 2 at−1.8 ° C(µatm) Latitude(°S) a) d) b) c)
Fig. 4. (a) Sea ice cover (fraction), (b) the difference of fCO2 across the sea surface,
∆fCO2(w–a), (c) sea surface temperature, and (d) ∆fCO2(w–a) for fCO2w corrected to –1.8◦C,
BGD
5, 1205–1235, 2008From ice covered CO2-rich waters to a biological CO2 sink D. C. E. Bakker et al. Title Page Abstract Introduction Conclusions References Tables Figures ◭ ◮ ◭ ◮ Back Close
Full Screen / Esc
Printer-friendly Version Interactive Discussion −70 −68 −66 −64 −62 −60 −58 −56 0 100 200 300 400 Depth(dbar) PotentialTemperature(°C),0°W 1.0 0.7 0.7 -0.8 0.4 1.3 -2.0 -1.0 0.0 1.0 −70 −68 −66 −64 −62 −60 −58 −56 0 100 200 300 400 Latitude(°S) Depth(dbar) 17−23°E 1.3 -1.4 -1.7 -1.7 -2.0 -1.0 0.0 1.0 0.4 0.1 -1.7 -1.4 1.0 1.0 0.7 1.3 -1.4 0.1 0.4 0.1 -0.2 a) b)
Fig. 5. Potential temperature in the upper 400 m (a) along 0◦W, and (b) 17◦E to 23◦E with
in-dication of the temperature minimum plus 0.02◦C (open circles) and the temperature maximum
BGD
5, 1205–1235, 2008From ice covered CO2-rich waters to a biological CO2 sink D. C. E. Bakker et al. Title Page Abstract Introduction Conclusions References Tables Figures ◭ ◮ ◭ ◮ Back Close
Full Screen / Esc
Printer-friendly Version Interactive Discussion −70 −68 −66 −64 −62 −60 −58 −56 0 100 200 300 400 Depth(dbar) DIC(µmol/kg),0°W 2250 2250 2260 2220 2190 2250 2260 2100 2150 2200 2250 −70 −68 −66 −64 −62 −60 −58 −56 0 100 200 300 400 Latitude(°S) Depth(dbar) 17°E−23°E 2250 2180 2170 2100 2150 2200 2250 2260 2210 2200 2240 2240 2250 2250 2210 2250 a) b)
Fig. 6. The distribution of dissolved inorganic carbon (DIC) in upper 400 m (a) along 0◦W and
(b) 17◦E to 23◦E with indication of the temperature minimum plus 0.02◦C (open circles) and
the temperature maximum (closed circles). Contours are at 10 µmol kg−1 intervals. Crosses
BGD
5, 1205–1235, 2008From ice covered CO2-rich waters to a biological CO2 sink D. C. E. Bakker et al. Title Page Abstract Introduction Conclusions References Tables Figures ◭ ◮ ◭ ◮ Back Close
Full Screen / Esc
Printer-friendly Version Interactive Discussion −70 −68 −66 −64 −62 −60 −58 −56 −2.0 −1.8 −1.6 −1.4 −1.2 −1.0 Pot.temperature (° C) 0°W 17−23°E −70 −68 −66 −64 −62 −60 −58 −56 0 50 100 150 WMLdepth(m) −70 −68 −66 −64 −62 −60 −58 −56 2150 2200 2250 DICat50mdepth(µmol/kg) Latitude(°S) b) c) a) 2225 2175 (*) * * *
Fig. 7. (a) The potential temperature and (b) the depth of the temperature minimum plus
0.02◦C, as well as (c) the DIC concentration at 50 m depth along 0◦W and 17◦E to 23◦E. (b)
The winter mixed layer (WML) depth is taken as the depth of the temperature minimum plus 0.02◦C. (c) Star symbols indicate stations with a temperature minimum at or above 50 m depth.
BGD
5, 1205–1235, 2008From ice covered CO2-rich waters to a biological CO2 sink D. C. E. Bakker et al. Title Page Abstract Introduction Conclusions References Tables Figures ◭ ◮ ◭ ◮ Back Close
Full Screen / Esc
Printer-friendly Version Interactive Discussion −70 −68 −66 −64 −62 −60 −58 −56 −40 −20 0 DIC 5 0 m −DIC 2 0 m (µmol/kg) 0°W Salinity Org.Matter Rest −70 −68 −66 −64 −62 −60 −58 −56 −40 −20 0 DIC 5 0 m −DIC 2 0 m (µmol/kg) Latitude(°S) 17Eto23°E a) b) * * * (*) °
Fig. 8. The difference in the DIC concentration from 50 m to 20 m depth (a) for 0◦W and
(b) 17◦E to 23◦E. The changes are ascribed to freshwater input, biological carbon uptake for
organic matter production and further processes, including CO2air-sea exchange and CaCO3 precipitation or dissolution. Star symbols indicate stations with a temperature minimum at or above 50 m depth. The effect of biological carbon uptake has been calculated for a ratio of 117 moles of carbon to 16 moles of nitrate (Anderson and Sarmiento, 1994).
BGD
5, 1205–1235, 2008From ice covered CO2-rich waters to a biological CO2 sink D. C. E. Bakker et al. Title Page Abstract Introduction Conclusions References Tables Figures ◭ ◮ ◭ ◮ Back Close
Full Screen / Esc
Printer-friendly Version Interactive Discussion 2120 2160 2200 250 300 350 400 fCO 2 w(µatm) 2280 2300 2320 250 300 350 400 2120 2160 2200 250 300 350 400 DICatS34.2(µmol/kg) fCO 2 wat−1.8°C(µatm) 2280 2300 2320 250 300 350 400 TAatS34.2(µmol/kg) a) b) c) d)
Fig. 9. Surface water fCO2 and fCO2 corrected to –1.8◦C (a, c) for DIC from 20 m depth
normalized to a salinity of 34.2, and (b, d) for alkalinity normalized to a salinity of 34.2. Total alkalinity has been calculated from surface water fCO2and DIC at 20 m depth.
BGD
5, 1205–1235, 2008From ice covered CO2-rich waters to a biological CO2 sink D. C. E. Bakker et al. Title Page Abstract Introduction Conclusions References Tables Figures ◭ ◮ ◭ ◮ Back Close
Full Screen / Esc
Printer-friendly Version Interactive Discussion 2120 2160 2200 2280 2300 2320 TAatS34.2(µmol/kg) 2 fCOw(µatm) 300 320 340 360 380 400 2120 2160 2200 2280 2300 2320 Salinity 34.0 34.1 34.2 2120 2160 2200 2280 2300 2320 DICatS34.2(µmol/kg) TAatS34.2(µmol/kg) 2 fCOwat-1.8°C(µatm) 300 320 340 360 380 400 2120 2160 2200 2280 2300 2320 DICatS34.2(µmol/kg) Icecover(fraction) 0.0 0.2 0.4 0.6 0.8 1.0 34.3 a) b) c) d)
Fig. 10. Alkalinity and DIC normalized to a salinity of 34.2 (a) for surface water fCO2, (b)
salinity, (c) fCO2corrected to –1.8◦C, and (d) the shipboard observations of the sea ice fraction
interpolated to the timing of the CTD casts. The continuous lines correspond to theoretical changes in TA and DIC in a ratio of 2:1 by precipitation and dissolution of CaCO3, while the dashed line indicates the effect of organic matter production and remineralisation at a ratio for TA to DIC of –0.14:1 (Anderson and Sarmiento, 1994).