HAL Id: insu-00442614
https://hal-insu.archives-ouvertes.fr/insu-00442614
Submitted on 22 Dec 2009HAL is a multi-disciplinary open access archive for the deposit and dissemination of sci-entific research documents, whether they are pub-lished or not. The documents may come from teaching and research institutions in France or abroad, or from public or private research centers.
L’archive ouverte pluridisciplinaire HAL, est destinée au dépôt et à la diffusion de documents scientifiques de niveau recherche, publiés ou non, émanant des établissements d’enseignement et de recherche français ou étrangers, des laboratoires publics ou privés.
Time-dependent changes of the electrical conductivity of
basaltic melts with redox state
Anne Pommier, Fabrice Gaillard, Michel Pichavant
To cite this version:
Anne Pommier, Fabrice Gaillard, Michel Pichavant. Time-dependent changes of the electrical con-ductivity of basaltic melts with redox state. Geochimica et Cosmochimica Acta, Elsevier, 2010, 74 (5), pp.1653-1671. �10.1016/j.gca.2009.12.005�. �insu-00442614�
1 2 3 4 5 6 7 8
TIME-DEPENDENT CHANGES OF THE ELECTRICAL
9CONDUCTIVITY OF BASALTIC MELTS
10WITH REDOX STATE
1112 13
POMMIER A.
1, GAILLARD F.
1AND PICHAVANT M.
114 15 16 17 18 19 20 21 22 23 24 25 26 1
CNRS/INSU, Université d’Orléans, Université François Rabelais-Tours,
27Institut des Sciences de la Terre d’Orléans (ISTO), UMR 6113,
28Campus Géosciences, 1A rue de la Férollerie,
2945071 Orléans cedex 2, France
3031 32 33 34
Abstract 300 better) 35
36
The electrical conductivity of basaltic melts has been measured in real-time after fO2 step-37
changes in order to investigate redox kinetics. Experimental investigations were performed at 1 38
atm in a vertical furnace between 1200°C and 1400°C using air, pure CO2 or CO/CO2 gas 39
mixtures to buffer oxygen fugacity in the range 10-8 to 0.2 bars. Ferric/ferrous ratios were 40
determined by wet chemical titrations. A small but detectable effect of fO2 on the electrical 41
conductivity is observed. The more reduced the melt, the higher the conductivity. A modified 42
Arrhenian equation accounts for both T and fO2 effects on the electrical conductivity. We show 43
that time-dependent changes in electrical conductivity following fO2 step-changes monitor the 44
rate of Fe2+/Fe3+ changes. The conductivity change with time corresponds to a diffusion-limited 45
process in the case of reduction in CO-CO2 gas mixtures and oxidation in air. However, a 46
reaction at the gas-melt interface probably rate limits oxidation of the melt under pure CO2. 47
Reduction and oxidation rates are similar and both increase with temperature. Those rates range 48
from 10-9 to 10-8m²/s for the temperature interval 1200-1400°C and show activation energy of 49
about 200kJ/mol. The redox mechanism that best explains our results involves a cooperative 50
motion of cations and oxygen, allowing such fast oxidation-reduction rates. 51 52 53 54 1. INTRODUCTION 55 56
Several studies have revealed the important controls of redox potential, usually quantified 57
as oxygen fugacity (fO2), on metal/silicate melt, crystal/melt and gas/melt equilibria (Carmichael 58
and Ghiorso, 1990; Righter and Drake, 1996; Moretti and Papale, 2004; Gaillard and Scaillet, 59
2009). This makes redox condition of basaltic melts one of the most critical parameter 60
influencing many planetary processes, involving core formation, mantle melting and 61
metasomatism, crystallization of magmas and magma degassing (Righter and Drake, 1996; Herd, 62
2008; Frost and McCammon, 2008). Several multivalent elements determine the fO2 of basaltic 63
melts (Fe, C, H, O, S), but the ferric/ferrous ratio of the melt is commonly used to monitor redox 64
changes in magmatic processes (Kress and Carmichael, 1991; Behrens and Gaillard, 2006). The 65
oxygen fugacity of a basalt is generally defined relatively to the one of a solid buffer, such as, 66
from the more reducing to the more oxidizing, Iron-Wustite (IW), Quartz-Fayalite-Magnetite 67
(QFM), Nickel-Nickel Oxide (NNO) (Herd, 2008). 68
Present-day basaltic lavas on Earth display a range in oxygen fugacity from 3 log-units 69
below NNO to 4 log-units above NNO, corresponding to ferric/total iron ratios ranging from less 70
than 10 to ~70% (Botcharnikov et al., 2005; Carmichael, 1991). Martian basalts record more 71
reduced oxygen fugacities, ranging from 0.5 log-units to 3.5 log-units below NNO (Herd et al., 72
2002). Such variations in planetary basalts oxygen fugacity might reflect fundamental 73
heterogeneities in the redox state of their source region but fO2 can be also modified during 74
melting, crystallization and degassing processes. Since such modifications can be kinetically 75
controlled, a correct interpretation of fO2 variabilities requires the understanding of the 76
mechanisms and rate of changes in the redox potential in basalts. In this paper, we use electrical 77
conductivity measurements to further document mechanisms and kinetics of redox changes in 78 basaltic melts. 79 80 2. PREVIOUS WORKS 81 82
Mechanisms of oxidation/reduction of silicate melts have been actively investigated (e.g. 83
Schreiber et al., 1986 and references therein). In H-bearing and H-free basaltic systems, 84
reduction/oxidation reactions are commonly associated with the development of redox reaction 85
fronts and are diffusion-limited (Wendlandt, 1991; Cooper et al., 1996a, b; Everman and Cooper, 86
2003; Gaillard et al., 2003a). For H-bearing systems, Gaillard et al. (2003b) calculated that H2 87
mobility should rate-limit redox changes in basalts. In H-free systems, different rate-limiting 88
species have been proposed. Oxidation-reduction reactions have been initially associated to the 89
diffusion of oxygen (self-diffusion of oxygen; Wendlandt, 1991). However, self-diffusion 90
experiments do not involve gain or loss of oxygen (16O-18O substitutions are involved) whereas 91
redox experiments implicitly require a change in the oxygen/cations ratio. Variable-valence ions 92
have been found to enhance oxygen fluxes (Beerkens and de Waal, 1990). Redox experiments 93
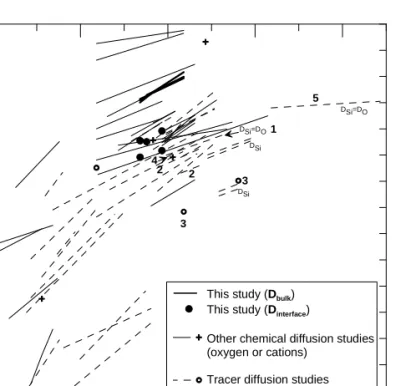
are usually related to oxygen (O2) chemical diffusion experiments (Schreiber et al., 1986). For 94
glasses or melts of similar composition, oxygen tracer diffusivity (D*) is commonly several 95
orders of magnitude slower than oxygen chemical diffusivity (D, Schreiber et al., 1986; Cook et 96
al., 1990; Wendlandt, 1991) (Appendix 1). Such discrepancies between O diffusion coefficients 97
have been interpreted in terms of different transport mechanisms, oxygen self- or tracer diffusion 98
involving mobility of discrete cation-oxygen species within the melt while oxygen chemical 99
diffusion is dominated by the migration of cationic species. Cooper et al. (1996b) have 100
demonstrated that the diffusion of an oxygen species is not required during redox reactions in 101
melts and that the change in the oxygen/cations ratio is best accommodated by cations rather than 102
oxygen diffusivity due to their greater mobility. 103
Oxygen self and chemical diffusion studies performed on synthetic (Sasabe and Goto, 104
1974; Dunn, 1982; Schreiber et al., 1986; Cook et al., 1990; Cook and Cooper, 2000; Reid et al., 105
2001) and natural silicate melts (Dunn, 1983; Canil and Muehlenbachs, 1990; Wendlandt, 1991; 106
Cooper et al., 1996a) have demonstrated the dependence of both kind of diffusion mechanisms 107
on the melt structure. This was also confirmed by other studies of iron redox reactions (e.g. 108
Magnien et al., 2008). All that tends to underline that the Network Formers (Si, Al) lower the 109
oxygen diffusivity (D) whereas the Network Modifiers (divalent cations and alkali) have the 110
opposite effect. In basaltic melts, oxygen self-diffusion data were found to be comparable to 111
divalent cations diffusivities. For example, in a basaltic melt at 1300°C, Muehlenbachs and 112
Kushiro (1974) and Lesher et al. (1996) measured oxygen diffusivities (D*) of ~4.10-12 m²/s and 113
6.10-12 m²/s, respectively. This result questions the assumption of Cooper et al. (1996a, b) that 114
cO2-DO2- (and cO2DO2) < cmodifier cationsDmodifier cations, cx being the concentration of x. 115
The electrical conductivity, σ, reveals the mobility of the charge carriers in presence of a 116
gradient in electrical potential and is an efficient probe of mass transfer processes within silicate 117
melts and magmas. Previous studies have shown that it is extremely sensitive to many 118
parameters, including temperature (T), pressure (P), melt composition (Tyburczy and Waff, 119
1983, 1985; Gaillard, 2004; Gaillard and Iacono Marziano, 2005; Pommier et al., 2008). 120
However, the dependence of electrical conductivity of silicate melts to redox conditions has 121
remained poorly documented. The only study on the subject (Waff and Weill, 1975) found no 122
significant variation in σ with fO2 and suggested to neglect the influence of fO2 on the electrical 123
properties of silicate melts. 124
We have undertaken a systematic investigation of the influence of fO2 on the electrical 125
response of two different basaltic melts at 0.1MPa and different temperatures. The study was 126
motivated by (1) the need to reexamine the conclusions of Waff and Weill (1975) in the light of 127
recent methodological advances in the field of electrical measurements and (2) the need to 128
understand redox kinetics and mechanisms in natural silicate melts, the electrical conductivity 129
being here used as a probe for investigating mass transfer properties. Modern techniques of 130
measurements of electrical conductivity such as impedance spectroscopy (Huebner and 131
Dillenburg, 1995) allows the electrical response to be separated in terms of an imaginary and a 132
real part, the latter corresponding unambiguously to the electrical resistance of the sample. In the 133
case of oxidation/reduction reactions, the real time electrical response of the melts was not 134
monitored in previous studies (Waff and Weill, 1975) and is therefore unknown. In our study, the 135
electrical conductivity was continuously measured from step changes in fO2 until the attainment 136
of redox equilibrium. In turn, this allows conductivity changes to be interpreted in terms of 137
kinetics and mechanisms of redox changes in the melt. Equilibrium conductivities were extracted 138
from the evolution of σ-time plots and used to establish the dependence of the electrical 139
conductivity with fO2 for the two basaltic melts and different temperatures investigated. The 140
conductivity measurements were complemented by major element and FeO analyses of 141
experimental glasses in order to relate the electrical and redox state of the studied melts. For most 142
experiments, the kinetics of the electrical response can be satisfactorily fitted by a diffusion 143
formalism, suggesting that both oxidation and reduction reactions are kinetically limited by 144
diffusion. The high values of the calculated diffusion coefficients (~10-9m2/s for our investigated 145
T range) can be explained by redox mechanisms involving both oxygen and cations fluxes. 146 147 3. EXPERIMENTS 148 149 3.1. Starting products 150 151
The starting materials are two different basalts: one collected from the active vent of 152
Pu’u’ ‘O’o volcano (Kilauea, Hawaii) in 2007 and a tephrite (VES9) coming from a 8th century 153
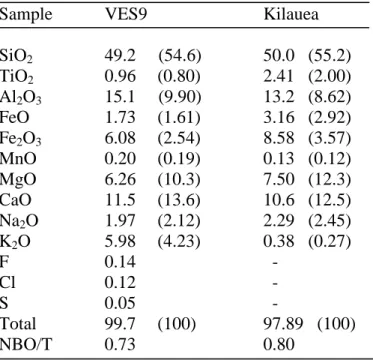
eruption of Mt. Vesuvius (Italy). Chemical analyses of the starting glasses are given in Table 1. 154
Each rock was finely crushed in an agate mortar. The powder was dried and then melted in air at 155
1400°C during ~1h. Therefore, all starting glass samples were prepared under strongly oxidizing 156
conditions (log fO2=-0.69). Quenching resulted in bubble-free glasses that were drilled to 157
cylinders (6 mm OD, 6.5-10 mm length), and directly loaded in the electrical conductivity cell. 158
NBO/T ratios (number of non-bridging oxygens divided by number of tetrahedral cations) of the 159
two glasses, calculated considering Fe as both FeO and Fe2O3 and neglecting the presence of Ti 160
(Mysen and Richet, 2005), are 0.56 for the Kilauea basalt and 0.55 for the Mt. Vesuvius tephrite. 161
This underlines a similar polymerization of the tephrite and the basalt. 162
163
3.2. Experimental setup 164
165
All experiments were performed in a one atmosphere vertical furnace. Experimental 166
temperatures ranged from 1200 to 1400°C. Temperature, monitored with a Eurotherm controller, 167
was measured by a type-S thermocouple, placed adjacent to the conductivity cell, and is known 168
to within +/- 2°C. The sample and the thermocouple were both located in the 3 cm hot spot of the 169
furnace. Experimental redox conditions were controlled by the gaseous atmosphere present in the 170
furnace. Three types of gaseous atmospheres were employed: air, pure CO2 and CO-CO2 171
mixtures. Note that experiments using only CO2 are never performed under pure CO2, since a 172
small quantity of CO is always present in the gas bottle. This small amount of CO (in general < a 173
few tens of ppm) allows the gas atmosphere to act as a buffer. 174
For air, the tube furnace was left open to the ambient atmosphere. In contrast, for both 175
CO2 and CO-CO2 mixtures, gases were flown through the furnace (typical flow rates were 176
200cc/min). For CO-CO2 mixtures, three different gas proportions (39.7% CO2/1.6% CO; 38.8% 177
CO2/5.9% CO; 36.5% CO2/17.5% CO) were imposed using electronic flowmeters. Redox 178
conditions (fO2) were calculated from Deines et al. (1974) and directly measured using a zirconia 179
electrolyte cell. These are referenced against the Ni-NiO equilibrium at 0.1MPa (Pownceby and 180
O’Neill, 1994). For pure CO2 gas, ∆NNO values range from 3.45 to 4.00 (Table 2 and 3); for 181
CO-CO2 gas mixtures, ∆NNO values divide into three groups (0.75-1.40; -0.35-0.45; -1, Table 2 182
and 3), depending on the specific gas mixture imposed. 183
Conductivity measurements were performed using a two-electrode configuration on 184
cylindrical samples (Gaillard, 2004; Pommier et al., 2008, Figure 1a). Glass samples of 6mm OD 185
and 8-9mm length were typically used. The inner electrode of the conductivity cell is a 1mm Pt 186
wire inserted in the center of the glass sample and the external electrode is a Pt tube surrounding 187
the sample. The drilled alumina ceramic part located at the bottom of the conductivity cell 188
prevents the two electrodes from being in contact (Figure 1a). This configuration ensures the 189
stability of the cell during the experiment. We assume that no convection occurs in the samples 190
since the Rayleigh number is very small (<200, Jaupart and Tait, 1995), due to the small 191
dimensions of the samples. Thermodiffusion (Soret effect) requires the presence of a thermal 192
gradient, which is not the case in our experiments (thermal gradient <1-2°C). At the end of the 193
experiment, the conductivity cell and the sample were removed from the furnace and allowed to 194
cool down under room conditions. Quenched glasses from selected conductivity charges were 195
collected and prepared for FeO titration and electron microprobe analyses. 196
197
3.3. Experimental strategy 198
199
For each experiment at a given temperature, two fO2 steps were performed. Electrical 200
measurements were recorded continuously until the attainment of the different equilibrium redox 201
states. Reduction experiments consisted in an initial relatively oxidizing step followed by a final 202
step under more reducing conditions. Oxidation experiments were the reverse of reduction 203
experiments: an initial relatively reducing step was followed by a more oxidizing step. In 204
practice, fO2 changes were obtained by switching either from air or pure CO2 to CO-CO2 205
mixtures (reductions), or from CO-CO2 mixtures to air or pure CO2 (oxidations). On the basis of 206
voltage measurements using the zirconia probe, changing fO2 from CO-CO2 to pure CO2 or air 207
and reciprocally takes approximately a few minutes. Electrical measurements during this 208
transition period were discarded. For oxidations in air, the conductivity cell was taken out of the 209
furnace during the evacuation of the CO-CO2 gas mixture and then replaced in the furnace at T. 210
Durations for each fO2 steps ranged between 90 and 1900min (Table 2). 211
In parallel to electrical conductivity experiments, experiments were performed in order to 212
determine Fe2+/Fe3+ and other chemical changes associated with the real-time evolution of the 213
oxygen fugacity. These experiments (designated below as analytical experiments, Table 3) used 214
the same sample configuration and dimensions as the conductivity experiments (Figure 1b). 215
Similarly, only one end of the glass cylinder was in contact with the furnace atmosphere. T and 216
fO2 conditions were selected to match those in conductivity experiments. Samples have been 217
rapidly quenched before redox equilibrium, as monitored from the electrical measurements, was 218
attained. Experimental glasses were analyzed for FeO titration and electron microprobe analyses. 219
220
3.4. Acquisition and reduction of the electrical data 221
222
In this study, electrical conductivities were derived from complex impedance 223
spectroscopy (Roberts and Tyburczy, 1994). Electrical impedances of samples were determined 224
at variable frequencies using a Solartron 1260 Impedance Gain Phase Analyzer, (Schlumberger 225
Co.), equipped with Zview software package (Huebner and Dillenburg, 1995; Gaillard, 2004; 226
Maumus et al., 2005). Each measurement consisted in a scan in frequency from 1 Hz to 106 Hz, 227
lasting typically about 1min. For each frequency, the complex impedance was recorded. The 228
experimental procedure, including details on the calibration process, is detailed in Pommier et al. 229
(2009, in press). The reproducibility of the data has been demonstrated in Pommier et al. (2008). 230
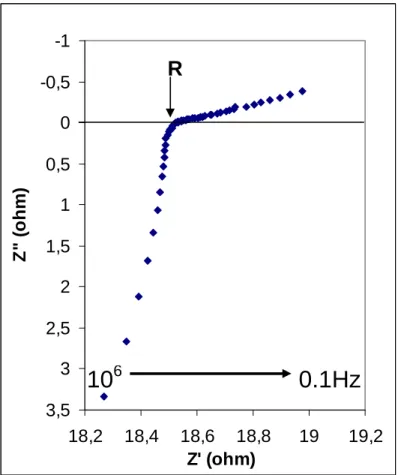
The complex impedance, Z, can be written as the sum Z’+jZ”, with Z’ the real part and 231
Z” the imaginary part of Z (and j²=-1). The electrical response of the sample to a scan in 232
frequency is directly observed in the Nyquist plane (Z’, Z”) (Figure 2), from which the value of 233
the electrical resistance R is deduced (e.g. Huebner and Dillenburg, 1995). The non semi-circle 234
shape of the impedance spectra is due to the fact that the samples are very conductive on the 235
investigated T range, implying their electrical resistance to be smaller than the inductive effects 236
(Z”<0). The corresponding electrical conductivity value σ is then deduced using the geometric 237
factor G (Gaillard, 2004; Pommier et al., 2008): 238
σ= (G.R)-1 (1)
239
The geometric factor varies from 0.022 to 0.037 m. The uncertainty on σ due to error 240
propagation of typical uncertainties on R (R is known to +/- 0.5 ohm in the investigated T range), 241
L, dext and dint (uncertainties on the length and the two diameters are 0.1mm) is in the range of 242
4.7-9% for both our Kilauea and Mt.Vesuvius samples. 243
For fixed T and fO2 conditions and for each starting glass composition, time series 244
measurements were conducted. They consisted in the successive acquisition of electrical 245
measurements (each comprising a scan in frequency from 1 Hz to 106 Hz) until a stable value of 246
R (and, thus, of σ) was reached (plateau values). The time interval between two electrical 247
measurements ranged from 30 s to 1 hr depending on the evolution of the electrical response with 248
time: at the beginning of the experiment, small time intervals were required since the electrical 249
response changed rapidly; on the contrary, at the end of the experiment, the small changes in the 250
electrical response (plateau values) allowed the use of longer time spans. 251
252
3.5. Analytical techniques 253
254
Experimental glasses were observed optically under a microscope, in order to check for 255
the presence of crystals and bubbles. Crystals were found to be present in some oxidation 256
experiments performed at 1200°C in air for the Kilauea basalt. Results from these experiments 257
were discarded and are not presented. 258
A Camebax SX-50 electron microprobe (BRGM-CNRS-Université d’Orléans) was used 259
to analyze both the starting and the experimental glasses. Analyses were conducted at 15kV, 260
6nA, 10s on peak and 5s on background. Both spot analyses and traverses were performed. 261
Traverses served to evaluate the degree of iron loss from the melt to the Pt electrodes and the 262
extent of Al3+ incorporation and diffusion from the ceramic part of the conductivity cell into the 263
melt (Figure 1b). In the analytical charges, EMPA traverses at the gas/melt interface were used to 264
determine the type and importance of major elements fluxes to redox changes (see Figure 1). 265
The FeO concentration of the starting and experimental glasses was determined by 266
colorimetric redox titration (Gaillard et al., 2003b). With this method, the sample is dissolved in 267
HF+H2SO4 solution and the titration is then performed using a potassium dichromate solution. 268
The equivalence volume provides the value of the concentration of FeO. At least 25mg of 269
sample powder were used for the titration in order to ensure accuracy and reproducibility. The 270
Fe2O3 concentration is then calculated from: 271
Fe2O3=1.1113.(FeOtot-FeO), (2) 272
where Fe2O3 is the concentration in ferric iron (wt%), FeOtot is the total iron concentration (wt%) 273
measured by electron microprobe and FeO is the concentration of ferrous iron (wt%) determined 274
as above. FeO and Fe2O3 concentrations are then used to calculate the at. Fe2+/Fe3+ ratio. 275
276
4. RESULTS 277
278
4.1. Melt-conductivity cell interactions 279
280
Spot electron microprobe analyses performed in the center of the glass cylinders in most 281
cases showed no significant changes in major element oxides in comparison with starting glass 282
compositions. Exceptions were experiments performed at the lowest temperatures (1200°C) for 283
the Kilauea glass and at log fO2 = -3.74 and -0.69 (fO2 in bar) (see Table 2). For those samples, 284
the variations in major elements concentration can be explained by the crystallization of Fe-Ti-285
Mg oxides observed in the experimental glasses. These observations indicate that no noticeable 286
alkali volatilization occurred during these redox experiments. 287
The glass-Pt interface shows no significant variations in oxide concentrations, except for 288
FeO, as already observed by Pommier et al. (2008). On average, iron depletions range between 2 289
and 7% relative. A maximum depletion of 15% FeO relative affecting the melt on a distance 290
<500microns was found only for the longest experiments, for which the experimental duration 291
exceeded the average run duration by several hours. For instance, in experiment #5 (one of the 292
longest experiments (Table 2), thus particularly exposed to Fe losses), the iron content close to 293
the electrode is ~4.3% mol oxide against 4.6% mol oxide in the starting glass, corresponding to a 294
decrease of 6.5% compared to the FeO content. Iron depletions affect a distance in the Pt 295
electrode <100microns (Figure 3a), thus insignificantly modifying the iron content in the glass 296
(Figure 3b). As a result, the bulk data (electrical conductivity and wet chemistry) will not be 297
significantly affected by Fe losses to Pt electrodes. 298
The glass-alumina interface presents on most samples a nearly continuous 10-30 µm thick 299
layer comprising Al-Mg-Fe spinel and some scattered plagioclase crystals. The contribution of 300
these crystals to the measured electrical conductivity was evaluated according to the method 301
exposed in Pommier et al. (2008). Calculations show that the contribution of the crystals is less 302
than 1% of the measured conductivity. 303
304
4.2. Effect of oxygen fugacity and temperature on the electrical conductivity 305
306
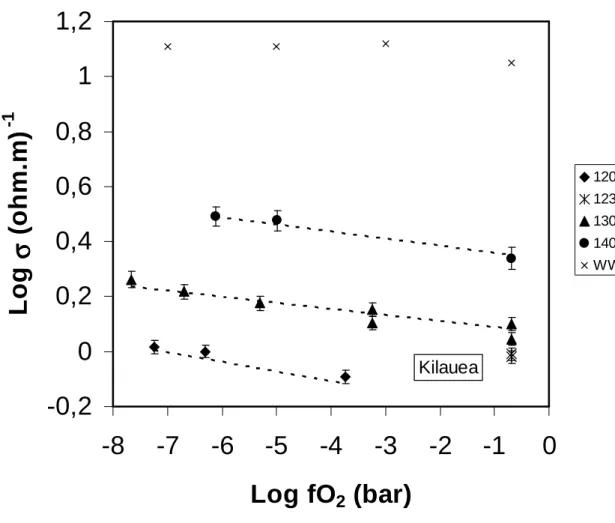
Electrical conductivities of the Kilauea sample measured at temperatures ranging from 307
1200 to 1400°C and covering a range of oxygen fugacities of 10-7.7 to 0.2 bar are shown in Figure 308
4. These are steady-state values of electrical conductivity associated with chemical equilibrium at 309
the set fO2.A small but clearly detectable effect of oxygen fugacity on the electrical conductivity 310
is demonstrated for each isotherm. The more reduced the melt, the higher the electrical 311
conductivity. For comparison, no effect of fO2 on the electrical conductivity was observed in the 312
study of Waff and Weill (1975). For both Kilauea and Vesuvius samples, the change in electrical 313
resistance following a change in redox conditions is about a few ohms, largely exceeding the 314
sensitivity of our measurements (better than 0.1%) at given T and fO2. A small effect of 315
composition is observed, the VES9 sample being less conductive than the Kilauea sample at 316
1200 and 1300°C (σeq values in Table 2). 317
At 1300°C, for the Kilauea sample, a change in fO2 of 8 log-units modifies the electrical 318
conductivity of ~0.2 log-unit (Figure 4). A similar effect is observed at the other investigated 319
temperatures. For a given fO2, the electrical conductivity increases with temperature (Figure 4). 320
The influence of temperature (increase of ~1.2 log units from 1200 to 1400°C) appears to be 321
similar at low and high fO2. This temperature dependency of the conductivity can be fitted by an 322 Arrhenius equation: 323 − = RT Eaσ
σ
σ
0.exp (3) 324with σ the electrical conductivity (ohm.m)-1, σ0 the pre-exponential factor (ohm.m)-1, Eaσ the 325
activation energy (J/mol), R the universal gas constant (J.K-1.mol-1) and T the temperature (K). 326
Depending on the gas atmosphere, linear least-squares regression analysis of electrical data 327
yields different activation energies that are presented in Table 4. Since a small effect of fO2 on σ 328
was detected in our experiments, we have introduced in the Arrhenian formalism the fO2 329
parameter. Depending on both T and the redox conditions, the electrical conductivity of both 330
Kilauea and Mt. Vesuvius melts can be expressed as 331 03 . 0 2 3 ) .( 117074 exp ). 10 . 4 . 9 ( − − = fO RT σ (4) 332
Eq.4 reproduces measured conductivity values for all the experiments with a correlation 333
coefficient of 0.93 and an average error of 11.6% relative. 334
4.3. Time-dependent changes in electrical conductivity during redox reaction 336
337
At a given temperature, the time necessary to reach a stable value of the conductivity (teq) 338
following a change in redox state is approximately the same for a reduction under CO-CO2 and 339
an oxidation in air, while longer time spans are needed for oxidations under CO2 (Table 2). At 340
1200°C, for both reduction and oxidation experiments, a stable (plateau) value of the 341
conductivity is reached in more than 15hours, while less than 2hours are needed at 1400°C. 342
Results of typical reduction and oxidation (in air) experiments are presented in Figure 5a 343
and 5b (experiments #6 and #15, respectively, Table 2). For both types of experiments, the 344
exponential shape of the electrical response with time underlines similar reaction mechanisms 345
and kinetics. For the experiment with pure CO2 (Figure 5c), the electrical response is more linear 346
with time, which contrasts with the curves obtained either for oxidation in air or for reductions in 347
CO-CO2. Changing the CO2 flow rate in the furnace does not significantly change the shape of 348
the electrical response with time (Figure 5c). The negligible effect of the gas flow rate on the 349
kinetics of oxidation is in agreement with the observations made by Schreiber et al. (1986) using 350
different air flow rates. 351
352
4.4. Variations in major element chemical concentrations 353
354
Electron microprobe traverses were performed in quenched samples from the analytical 355
experiments to detect possible variations in major elements concentrations (Si, Al, Fe, Mg, Ca, 356
Na, K) associated with redox changes. Traverses were performed in the longitudinal section of 357
the samples, from the interface with gas to at least 4mm inside the glass sample (Figure 1b). The 358
spatial resolution of the probe analyses is +/-5 microns. 359
Examples of microprobe traverses are presented in Figure 6 (traverses A and B: 360
reductions; traverse C: oxidation). For clarity, we state here the presence of three parts in our 361
samples (these parts will be interpreted Part 5 in terms of redox fronts): (1) The interface zone 362
between gas and glass (<1mm depth), from the gas/sample interface to ξ’, is characterized by 363
important variations in the concentration of network forming and network modifying cations in 364
the quenched glass samples. ξ’ is defined graphically and corresponds to the point at which the 365
concentration of major elements presents an inflexion. For example, in experiment #6-QR 366
(traverse A), this zone presents a relative increase of 5-8% in SiO2 and Na2O and 30% in K2O 367
and a decrease of 5-8% in MgO and CaO to 22% in FeO. (2) An inner zone begins at a depth 368
>1mm (ξ’) and extends as far as > 5 mm depending on experimental duration. It presents slight 369
fluctuations in alkali and Mg and Ca concentrations. In experiment #14-QO (traverse C), this 370
zone presents an increase of 4% relative in CaO and MgO and a decrease of 8.8% relative in 371
Na2O. (3) A third zone, located near the bottom of the capsule, can be detected on some profiles 372
(traverse B). This part of the sample is identified as the unreacted melt, the compositions in this 373
zone corresponding to the starting glass compositions. Traverses performed on samples from 374
conductivity experiments with duration exceeding teq have flat profiles for all major elements 375
(traverse D). 376
377
4.5. FeO concentrations and evolution of glass Fe2+/Fe3+ 378
379
Wet chemistry was used to determine the bulk value of Fe2+/Fe3+ in glasses before and 380
after most experiments (Tables 2 and 3). Analyses showed that the range of oxygen fugacities we 381
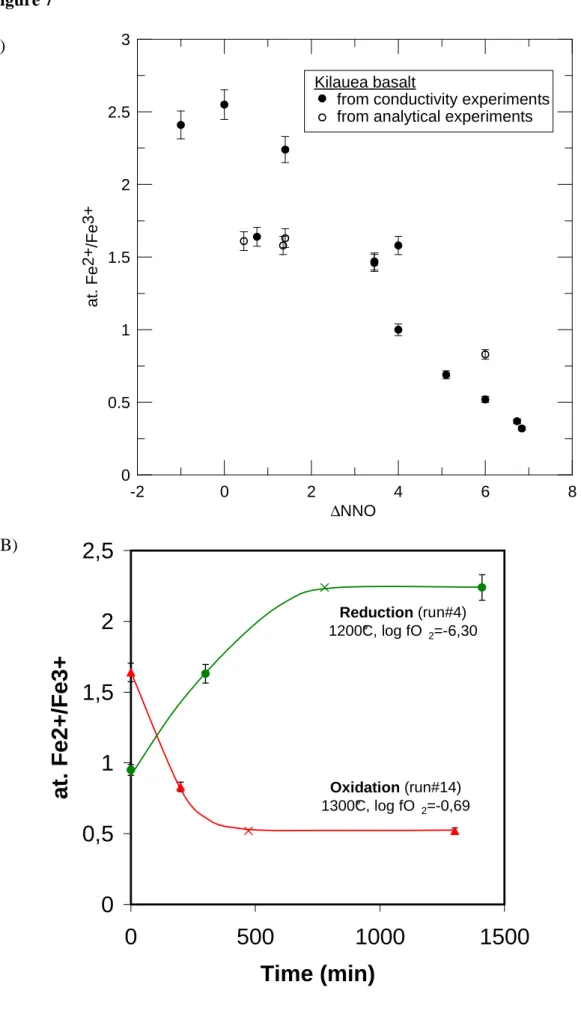
investigated results in a range of at.Fe2+/Fe3+ of approximately 0.32 to 2.55 (Figure 7a). 382
The rate of change of Fe2+/Fe3+ with time was documented in both reduction and 383
oxidation experiments. Fe2+/Fe3+ were measured at different time intervals following either a 384
reduction (experiment #4, values at t=0, 300 and 1410min; #5, values at t=0, 45 and 1860min; 385
#6, values at t=0, 45 and 430min) or an oxidation (experiment #12, values at t=0, 330 and 386
1380min; #14, values at t=0, 200 and 1300min) (Tables 2 and 3). For both reduction and 387
oxidation, the rate of change of Fe2+/Fe3+ is clearly nonlinear with time (Figure 7b). For example, 388
oxidation in air of the Kilauea sample (experiment #14) shows a decrease in at. Fe2+/Fe3+ from 389
1.64 (t=0) to 0.52 at equilibrium (teq=1300min, Figure 7b). The intermediate value at t=200min 390
(0.83, Table 3) represents a change of ~80% toward the equilibrium value. 391
392
5. DISCUSSION 393
394
5.1. Ferrous / ferric ratio and electrical conductivity 395
396
5.1.1. Why does the ferrous/ferric ratio change the electrical conductivity ?
397 398
Sodium has been identified in several studies of electrical conductivity of natural melts as 399
the main charge carrier (Tyburczy and Waff, 1983, 1985; Gaillard, 2004; Pommier et al., 2008). 400
The contribution of the different ionic species (Na+, K+, Ca2+, Mg2+, Si4+, Al3+, O2-) can be 401
discriminated using the Nernst-Einstein equation (cf Gaillard, 2004, Pommier et al., 2008): 402
Hr T k N q D B i i i i . . . . 2 = σ =
∑
i i measuredσ
σ
403where Di is the coefficient of diffusion of an ion i (m²/s), qi its charge (C), Ni the concentration of
404
i (m-3), kB is the Boltzmann constant, T is the absolute temperature (K) and Hr the Haven ratio.
405
Di values are taken from Chakraborty (1995), calculated at 1300°C. For the Kilauea basalt, at
406
1300°C, this equation underlines that the contribution of sodium to the bulk conductivity is 407
~80%, and the contribution of potassium is only 11%. This is coherent with the fact that the 408
potassium cation is larger than Na and, thus, is supposed to diffuse in the melt with a slower rate 409
than sodium. (usually, DNa~10.DK, Chakraborty, 1995). The contributions of calcium and oxygen
410
are 3% and 4% respectively. The contributions of Mg, Si and Al are <1%. These calculations 411
underline, in particular, that the contribution of divalent cations to the measured conductivity is 412
negligible in an alkali-rich melt. The identification of sodium as the main charge carrier in our 413
melts implies that the changes observed in the electrical response of the samples during a redox 414
reaction (i.e. an increase in σ during a reduction, a decrease in σ during an oxidation) can be 415
related to the modifications affecting the mobility of sodium. 416
Other mobile species that do not control the measured electrical conductivity of the melt 417
(such as electrons or electron holes) are not supposed to significantly affect the shape of the 418
impedance spectra. Thus, their possible contribution to the redox mechanisms can not be 419
observed directly using the interpretation of spectra. 420
Structural studies have well established that alkali charge-compensate tetrahedrally 421
coordinated cations such as ferric iron (e.g. Thornber et al., 1980; Dickenson and Hess, 1981; 422
Mysen, 1983; Kress and Carmichael, 1988; 1991; Lange and Carmichael, 1989; Tangeman et al., 423
2001; Mysen and Richet, 2005). The charge-compensation reaction can be written in a structural 424
way (Mysen and Richet, 2005) as follows: 425 5 . 2 2 2 2 2 1 SiO O Fe O Na O NaFe SiO + III ↔ + II + (5) 426
where ferric iron is charge-compensated by sodium on the left hand-side of the equation. This 427
equilibrium enlightens the double role of sodium, being either a charge compensator (left hand-428
side of the equation) or a network modifier (NM) (right hand-side). During an oxidation, the 429
observed decrease in electrical conductivity most likely reflects a restricted mobility of sodium, 430
since it is structurally associated to tetrahedrally coordinated units with ferric iron. On the 431
contrary, under more reduced conditions, less of such units are present within the melt. Thus, 432
sodium mobility is enhanced, consistent with the observed increase in electrical conductivity. It 433
is important to note that Eq. 5 considers only part of ferric iron as NF and part of ferrous iron as 434
NM in the melt. Previous studies have shown that the presence of sodium in silicate melts 435
promotes the formation of ferric iron (e.g. Kress and Carmichael, 1988). 436
437
5.1.2. Time evolution of the electrical conductivity and ferrous/ferric ratio
438 439
In our experiments, the temporal changes of both the electrical conductivity and the 440
ferrous/ferric ratio have been monitored. To analyze these temporal evolutions, it is convenient to 441
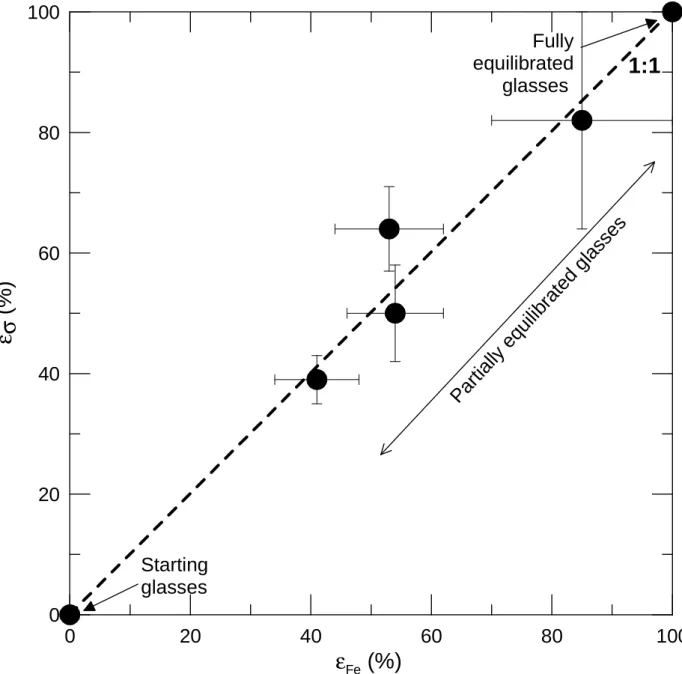
use the progress variable ε defined as (Crank, 1975; Wendlandt, 1991): 442
ε(X)= (X(t)-X0)/(Xeq-X0) (6)
443
with X being either σ or Fe2+/Fe3+, X(t) the value of X at t, X0 its initial value and Xeq its
444
equilibrium value (plateau value). Both ε(σ) and ε(Fe2+/Fe3+) are compared in Figure 8 for 445
experiments #4 (values at t=0, 300 and 1410min), #5 (t=0, 45 and 1860min), #6 (t=0, 45 and 446
430min) and #14 (t=0, 200 and 1300min) (Tables 2 and 3). The data fall on the straight line 1:1. 447
This single trend underlines that, during a redox reaction, the electrical conductivity and the 448
ferric/ferrous ratio increase or decrease with the same rate. Thus, the evolution of the electrical 449
conductivity with time is identical to that of the redox ratio of the melt. It follows that the time-450
dependence of the electrical response of the sample can be directly related to redox changes 451
within the melt. 452
453
5.2. Determination of a bulk diffusion coefficient and transport properties 454
455
The experimental arrangement used in this study (Figure 1) is compatible with the 456
mathematical model of the diffusion process applied to a plane sheet (Schreiber et al., 1986). In 457
this model, diffusion occurs in a medium bounded by two parallel planes, with a constant flux on 458
the upper boundary. Uniform initial distribution is considered. If diffusion-limited, the evolution 459
of the electrical conductivity in response to a change in oxygen fugacity can be described by the 460
following solution to the equation of one-dimensional diffusion: 461
∑
∞ = − + + − = − − 0 4 ² ² )² 1 2 ( exp . ² )² 1 2 ( 8 1 ) ( n initial m equilibriu initial L t n D n tπ
π
σ
σ
σ
σ
(7) 462with σ(t) the electrical conductivity (ohm.m)-1 at time t (s), σinitial the electrical conductivity
463
(ohm.m)-1 at t=0, σequilibrium the electrical conductivity (ohm.m)-1 at t=teq, D the bulk diffusion
464
coefficient (m²/s), and L the length of the sample (m) (Crank, 1975, p.48). Eq.7 assumes a 465
constant D as a function of time at a given temperature. The corresponding bulk redox front 466
delimits the unreacted melt and is represented by ξ” on Figure 6. 467
Experimental data on the changes of conductivity with time (Figures 5a; b) were fitted 468
using Eq. 7 and bulk diffusivity values (D) were determined. This approach proved successful for 469
the reduction experiments performed with CO-CO2 and the oxidation experiments in air (Figure
470
5a; b), suggesting that both redox reactions are diffusion-limited processes. Calculated values of 471
D are similar within uncertainties when determined at the same temperature, underlining that 472
reduction and oxidation kinetics operate at the same rates (Figure 9a). In contrast, oxidation 473
performed under CO2 is not compatible with Eq.7 and, therefore, in this case the redox evolution
474
is not rate-limited by diffusion (Figure 5c). In general, redox studies have been performed 475
assuming that the processes studied are diffusion-limited. Our approach, consisting in following 476
redox processes in real-time and with high accuracy, suggests that the nature of the gaseous 477
oxygen carrier influences the redox kinetics and that, the redox processes under CO2 are probably
478
not diffusion-limited. A linear evolution of the electrical conductivity with time is clearly 479
observed, independently of the gas flux. A few previous studies have reported non-diffusion-480
limited processes during redox experiments under pure CO2 (Goldman, 1983; Goldman and
481
Gupta, 1983; Schreiber et al., 1986; Roskosz et al., 2008). Most likely, the linear changes shown 482
in Figure 5c reveal a specific rate-limiting process at the gas/melt interface (e.g. surface 483
diffusion, chemical reaction). 484
The temperature dependence of the calculated D values follows an Arrhenian dependence 485 (Figure 9a): 486 − = RT Ea D D D exp . 0 (8) 487
with EaD the activation energy (kJ/mol) and D0 the pre-exponential factor (m²/s). Our diffusivity
488
values range from 10-9 to 10-8m²/s for the T range 1200-1400°C. These diffusion rates are 489
comparable to typical alkali self-diffusion coefficients in basaltic melts from literature 490
(Henderson, 1985; Chakraborty, 1995). Comparable diffusivity values are also calculated using 491
the Nernst-Einstein equation (Eq. 5) and assuming that sodium is the unique charge carrier in the 492
melt (i.e. σequilibrium=σNa+). These two points underline the importance of the role of sodium in the
493
investigated redox processes. However, the high values of activation energy (EaD≥200kJ/mol,
494
Figure 9a, b) calculated from Eq.8 are similar to activation energy for alkali-Earth elements 495
(LaTourrette et al., 1996; Chakraborty, 1995) and oxygen self-diffusion (Lesher et al., 1996; 496
Tinker et al., 2003) in silicate melts and is higher than the one expected for alkali self-diffusion 497
(~100kJ/mol, Chakraborty, 1995) (see also Appendix 2). 498
Activation energy and pre-exponential term for redox kinetics in melts obtained in this 499
study and previous ones (Lawless and Wedding, 1970; Sasabe and Goto, 1974; Doremus, 1960; 500
Dunn, 1983; Semkow and Haskin, 1985; Schreiber et al., 1986; Cook et al., 1990; Wendlandt, 501
1991; Cooper et al., 1996; Cook and Cooper, 2000; Everman and Cooper, 2003) are plotted in a 502
compensation plot (Figure 9b). The compensation law for natural melts (r²>0.91) is: 503
EaD= 11.84.LnD0+293.5 (9)
504
The single trend stresses that the kinetics of redox changes in our study is essentially similar to 505
that found in other studies. 506
Figure 9c presents the calculated oxidation-reduction rates as a function of oxygen 507
fugacity variations. Variations of fO2 (initial fO2 – final fO2) are directly correlated to variations
508
of the driving potential (or driving force, ∆µ) of the redox reaction occurring in the melt: 509
∆µ= ∆ (R.T.Ln fO2) (10)
510
No clear evidence of such a dependence of D values is observed for our experiments, even for 511
the experiments at 1300°C that involve the largest |∆log fO2| (from 2 to 7). Figure 9c suggests
512
that a possible dependence of D to variations of fO2 is too weak to be discriminated and that the
513
high D values calculated in our redox experiments can not be explained by variations of the 514 driving potential. 515 516 5.3. Redox dynamics 517 518
Redox mechanisms are proposed on the basis of conductivity measurements, chemical 519
titrations, mass balance calculations, EMPA profiles and previous redox studies. EMPA profiles 520
(Figure 6) show complex pattern of chemical zonation, which are however difficult to interpret in 521
terms of cation fluxes, since a change in cation content can be caused by the dilution effect of 522
other mobile species. Microprobe traverses were nevertheless used to detect an internal reaction 523
front, ξ’, whose location is presented in Figure 6. ξ’ corresponds to an inflexion point in the 524
chemical profiles. 525
ξ’ is different from the bulk reaction frontξ” provided by bulk diffusion coefficients 526
(Eq.7). The identification of these two fronts stresses out two different steps of one reaction or 527
two different reactions that are all part of the redox mechanisms. Position ofξ’ at t corresponds 528
to diffusivities in the melt of ~10-11m²/s for both reductions and oxidations, using the following 529
equation: 530
D=L²/t (11)
531
D the diffusion coefficient (m²/s), L defining the distance between ξ’ and the gas/melt interface 532
(m), t the time of quenching (s). These values are much lower than bulk diffusivities deduced 533
from conductivity measurements using Eq.7 (10-9-10-8 m2/s). The progression rate of ξ’ 534
compares well with self-diffusivities of O and Si in basaltic liquid (Canil and Muehlenbachs, 535
1990; Lesher et al., 1996) and with the rate laws derived by Cooper and coworkers using similar 536
methodologies (identification of a migration front of cations). Another argument for O and Si 537
mobility in the interface zone is that our EaD values are comparable with Ea values from
538
viscosity measurements (Giordano et al., 2008), which are based on the Si-O bounds (and oxygen 539
mobility). The mobility of Si as Si-O has been previously suggested by Terai and Oishi, 1977. 540
This suggests that Si-O mobility defines the progression of ξ’, which is not considered in the 541
model of Cooper et al. (1996b). Si-O species are less mobile than sodium and they are not 542
charged species. Thus, they do not directly influence the observed changes in conductivity. 543
However, their migration could influence the charge carrier mobility. The effect of Si-O on σ 544
would thus be indirect and part of the cations mobility can be interpreted as a consequence of Si-545
O migrations. 546
The progression rate of ξ’, graphically deduced from EMPA profiles, is slower than the 547
progression rate of ξ’’, determined using electrical measurements and corresponding to the rate 548
of the evolution of the redox ratio. This implies that apparent divalent cation migration and 549
Fe2+/Fe3+ changes are kinetically decoupled. This was not observed in previous studies that 550
proposed redox mechanisms controlled by divalent cations mobility, since the time-evolution of 551
the Fe2+/Fe3+ ratio was not monitored in these studies (e.g., Cooper et al., 1996b). The rate laws 552
of the evolution of ξ’’ observed in our study are comparable to the kinetics of iron redox 553
reactions in silicate melts (e.g. Magnien et al., 2008). 554
A schematic drawing of reduction and oxidation dynamics at the scale of the sample are 555
proposed in Figure 10. The model considers the main fluxes of mobile species and, in particular, 556
the rate-limiting ionic fluxes that probably hide other minor processes occurring at the same time. 557
This implies that metastable structures that are probably formed during the initial stages of the 558
redox reaction are not represented. We assume that the influence of these structures on the 559
calculations of diffusion coefficients of mobile species during the redox reaction can be 560
neglected. The model used to represent the evolution of a redox reaction is based on a Fickian 561
formalism. This simple approach can be used as a first approximation which allows us to explain 562
the D values in terms of major cation fluxes. The fluxes of cations (ji) between the free surface
563
(ξ0) and the bulk reaction front ξ” have been analyzed using the Fick-Einstein equation applied
564
to ionic materials (Cooper et al., 1996a): 565
∆ = =" 2 0 2 ln . . . . ξ ξ
ξ
λ
O O i i i i f f Vm D x j (12) 566with xi the molar fraction of the cation i (Na+, K+, Ca2+, Mg2+, Fe2+), Di its diffusion coefficient
567
(m²/s), λi the stoechiometric coefficient, Vm the molar volume of the reduced or oxidized melt
568
(m3/mol), ∆ξ the distance between the free surface and the bulk reaction front (m), and fO2 the
569
oxygen fugacity (Pa) (with the superscript indicating location). The fO2 ratio expresses the
570
difference in oxygen chemical potential between reacted and unreacted melt (i.e. between ξ0 and
571
ξ”). D values for cations come from the literature (Henderson et al., 1985; Chakraborty, 1995; 572
Lesher et al., 1996) and are assumed to be constant during the redox reaction. λi values
573
correspond to the number of mol of cation in the oxidized form (molecular form) that is produced 574
when one mole of O2 reacts with cation i. Details on the calculations of λi are presented in
575
Appendix 3. ∆ξ is calculated using Eq. 10 with D=Dbulk (from Eq.7) and t=tquench (Table3).
576
In the case of redox mechanisms driven by a single kind of ionic species (e.g. divalents 577
cations, Cooper et al., 1996), the motion of the redox front into the melt with time can be written 578 as follows: 579 ∆ = = ∆ + + + + " 2 2 0 2 2 2 2 .ln . . . ξ ξ
ξ
λ
ξ
O O M M M M f f D x Vm j dt d (13) 580M2+ being a divalent cation. These mechanisms were observed for experimental timescales of a 581
few seconds or minutes (Cooper et al., 1996b; Everman and Cooper, 2003) or in the glass region 582
(Cooper et al., 1996a; Cook and Cooper, 2000). As discussed before, at the timescale of our 583
experiments (i.e. several hours), redox dynamics in the basaltic melts probably not come down to 584
the only divalent cation fluxes. Our study suggests that oxygen, and alkalis also probably 585
contribute significantly to the advancement of the bulk redox front ξ”. The time-evolution of the 586
redox front becomes: 587 Vm j j j j dt d M h h O O A A A M M . . . . . 2 . . 2 2 2 2 + + + = ∆
∑
∑
+ − − + + + + +λ
λ
λ
λ
ξ
(14) 588with M2+= Ca2+, Mg2+, Fe2+, A+= Na+, K+ and h. the electron holes. λM2+=λA+=2, λO2-=2, λh.=4
589
(Appendix 3). 590
Si4+ and Al3+ ions are not considered in the present redox model. No evidence of free Si4+ 591
ions has been found in previous studies (Bockris et al., 1952; Semkow and Haskin, 1985). The 592
very high bond energy of Si-O (~373kJ/mol, Bockris et al., 1952) strengthens the low probability 593
for Si4+ ions to exist in a free state capable of migration within the melt. A significant role of 594
aluminium in redox mechanisms has never been observed, to our knowledge. 595
The fluxes of considered cations are calculated using Eq.12 and the flux of oxygen can be 596 expressed by: 597 ∆ = − − = − " 2 0 2 ln . . . 2 . 2 2 2 ξ ξ
ξ
O O O O O f f Vm D x j (15) 598 where total oxygen O n nx 2− = . noxygen corresponds to the total oxygen content of the melt. ntotal corresponds
599
to the amount of oxygen and cations. Both noxygen and ntotal are determined by mass balance
600
calculations. As in Cooper et al. (1996a), the flux of electron holes (jh.) was calculated using the
601
charge neutrality condition: 602 0 2 . . − 2 + . = =
∑
−∑
O h cations cations cations i i i j z j j j z (16) 603where zcations corresponds to the valence of the cations. Calculation of dξ/dt using Eq. 14 for the
604
quenched experiments yields similar values for oxidation and reduction at the same temperature. 605
For instance, dξ/dt =2.2.10-7m/s and 8.10-8m/s for experiments #12-QO and #4-QR, respectively 606
(Table 3). 607
As shown in Figure 10, the incorporation (oxidation) or release (reduction) of oxygen 608
leads to competitive mechanisms between the different ionic species. At the internal front ξ’, 609
variations of Na+ mobility are related to the reduction or oxidation of ferric or ferrous iron, 610
respectively. In oxidation and reduction experiments, the reacted melt (delimited by front ξ”) is 611
characterized by opposite fluxes of oxygen and cations. The smaller amounts of network-612
modifier cations compared to oxygen anions imply electron holes to charge-balance O2-fluxes. 613
According to Eq. 12 and 14, the evolution of the redox front as a function of time can be 614 written as follows: 615
∑
= ∆ ∆ i dt Ai d . . ξ ξ with j Vm f f D x Ai i i O O i i. .ln " . . 2 2 0λ
ξ ξ = = (17) 616Integration of Eq. 17 leads to the following parabolic kinetic law: 617
∑
∫
∑
∫
∆ ∆ = ⇒ = = = i t t i Ai t dt Ai d . "² 2. . 0 " 0 0 0 ξ ξ ξ ξ ξ (18) 618 The term t "² ξ(in m²/s) corresponds to a bulk diffusion coefficient associated to the redox 619
reaction and, thus, should be compared to the values of the redox front diffusion coefficient Dbulk
620
calculated using Eq. 7. Numerical calculations yield values of
t
"²
ξ
similar to the measured Dbulk
621
(Eq.7 and Figure 9a): between ~1.8.10-9m²/s at 1200°C and ~4.5.10-9m²/s at 1300°C. This implies 622
that the evolution of the redox front with time can be explained by a mechanism involving co-623
operative fluxes of cations, oxygen and electron holes. The contribution of cations and oxygen to 624
the redox mechanisms are in agreement with the high activation energy values calculated using 625
Eq.8 (>200kJ/mol). The calculated fluxes of cation (Eq. 12) needed to match the global redox 626
kinetics are however small (10-11-10-13 mol.m-2.s-1). This is consistent with the absence of 627
noticeable cations variations in the inner part of the quenched samples using EMPA profiles 628
(distance>ξ’, see Figure 6). Highest values of fluxes correspond to oxygen and sodium (~10-11 629
mol.m-2.s-1, whereas fluxes of potassium and divalent cations are ~10-12-10-13 mol.m-2.s-1), 630
implying that these two species are the main contributors to the redox dynamics. 631
The mechanism that occurs to finally provide a uniform chemistry (e.g. from profile C to 632
D in Figure 6) probably consists in a reequilibration of electrochemical potential. This 633
reequilibration would correspond, in the case of our samples, to a coupled exchange of moving 634
back alkali and divalent cations. 635
636 637
6. CONCLUSION AND REDOX EXCHANGES IN NATURE 638
639
Electrical measurements have been used to investigate in real-time redox kinetics in 640
basaltic liquids after fO2-step changes. Data were recorded between 1200 and 1400°C, on the fO2
641
range 10-8-0.2 bars. Electrical conductivity was found to increase slightly with decreasing fO2. A
642
modified Arrhenius law expressing the dependence of the electrical conductivity to both fO2 and
643
T has been proposed. The evolution of electrical conductivity, based on sodium mobility, 644
reproduces the evolution of the ferric/ferrous ratio of the melt. Reduction under CO-CO2 and
645
oxidation in air are diffusion-limited processes, whereas a gas-melt interface reaction probably 646
rate-limit oxidation under pure CO2. The high diffusion rates (10-9-10-8m²/s) and activation
energies (>200 kJ/mol) calculated on the investigated T range in basaltic melts can be explained 648
by redox mechanisms involving co-operative alkali, divalent cations and oxygen fluxes. 649
According to Gaillard et al. (2003a), attainment of redox equilibrium in hydrogen-bearing 650
melts was found to be rate-controlled by H2 fluxes in the melt at a reaction front corresponding
651 to: 652
H2 + 2 FeO1.5 = 2 FeO + H2O (18)
653
This statement was particularly supported by the fact that H2 migration in the melt is
654
much faster than divalent cations migration calculated after Cooper and coworkers. For example, 655
at 1300°C, at fH2=1 and 100bar, Gaillard et al. (2003a) calculated reaction rates of iron redox
656
changes in hydrous magmas of ~2.5.10-12 and 10-9 m²/s, respectively, while extrapolation of D 657
values of Cooper et al. (1996a) at the same T in basaltic melts provides a reaction rate of ~4.10-13 658
m²/s. Our results, however, indicate reaction rates of 10-9-10-8m²/s at 1300°C, which exceed well 659
the rates extrapolated from Cooper et al (1996a). The hydrogen-dominated mechanisms exposed 660
in Gaillard et al. (2003a) will therefore not necessarily operate in basaltic systems because 661
cooperative motions of oxygen and cations revealed in our study can be faster than exchanges 662
rate-limited by H2 fluxes. Only for fH2 values exceeding 50 bars, reaction rates are nearly
663
equivalent, implying that the mechanisms of Gaillard et al. might affect basalts under specific 664
conditions such as in moderately oxidized mantle wedge (water-rich at NNO). However, in most 665
conditions experienced by basaltic liquids (i.e. moderately hydrated), the mechanism we revealed 666
in our study should dominate the kinetics of redox potential re-equilibration. 667 668 669 670 Acknowledgements 671 672
This paper is part of the PhD of A. Pommier. The authors are grateful to T. Orr for 673
providing Kilauea sample and R. Cioni for Mt Vesuvius sample. R.F. Cooper, M. Roskosz and 674
an anonymous reviewer are warmly thanked for helpful comments and fruitful discussions. P. 675
Ulmer is acknowledged for his careful editorial work. This study has been supported by the 676
French national agency for research, ANR JC05-42707 (Electrovolc) attributed to F. Gaillard. 677
678 679
References 680
Beerkens, R.G.C., and H. de Waal (1990), Mechanism of oxygen diffusion in glassmelts 681
containing variable-valence ions, J. Am. Cearm. Soc., 73 (7), 1857-1861. 682
Behrens, H., and F. Gaillard (2006), Geochemical aspects of melts: volatiles and redox 683
behavior, Elements, 2 (5), 275-280. 684
Bockris, J. O’M., J.A. Kitchener, S. Ignatowitcz, and J. W. Tomlinson (1952), Electric 685
conductance in liquid silicates, Trans. Farad. Soc., 48 (6), 536-548. 686
Botcharnikov, R. E., J. Koepke, F. Holtz, C. McCammon, and M. Wilke (2005), The 687
effect of water activity on the oxidation and structural state of Fe in a ferro-basaltic melt, 688
Geochim. Cosmochim. Acta, 69 (21), 5071-5085.
689
Canil, D. and K. Muehlenbachs (1990), Oxygen diffusion in an Fe-rich basalt melt, 690
Geochim. Cosmochim. Acta, 54, 2947-2951.
691
Carmichael, I. S. E. (1991), The redox states of basic and silicic magmas-a reflection of 692
their source region, Contrib. Mineral. Petrol., 106 (2), 129-141. 693
Carmichael, I. S. E. and M. S. Ghiorso (1990), The effect of oxygen fugacity on the redox 694
state of natural liquids and their crystallizing phases, Modern source of igneous petrology: 695
understanding magmatic processes, vol. 24, 191-212.
696
Chakraborty, S., (1995), Diffusion in silicate melts, in Structure, dynamics and properties 697
of silicate melts, Reviews in Mineralogy, vol. 32, 411-503. 698
Cook, G. B., R. F. Cooper and T. Wu (1990), Chemical diffusion and crystalline 699
nucleation during oxidation of ferrous iron-bearing magnesium aluminosilicate glass, J. Non-700
Cryst. Solids, 120, 207-222.
701
Cook, G. B., and R. F. Cooper (2000), Iron concentration and the physical processes of 702
dynamic oxidation in an alkaline earth aluminosilicate glass, Am. Mineralogist, 85, 397-406. 703
Cooper, R. F., J. B. Fanselow, and D. B. Poker (1996a), The mechanism of oxidation of a 704
basaltic glass: chemical diffusion of network-modifying cations, Geochim. Cosmochim. Acta, 705
60(17), 3253-3265. 706
Cooper, R. F., J. B. Fanselow, J. K. R. Weber, D. R. Merkley, and D. B. Poker (1996b), 707
Dynamics of oxidation of a Fe2+-bearing aluminosilicate (basaltic) melt, Science, 274, 1173-708
1176. 709
Crank, J. (1975), The Mathematics of Diffusion, 2nd ed., 440 pp., Claredon, Oxford, U.K. 710
Deines, P., R. H. Nafziger, G. C. Ulmer, and E. Woermann (1974), Temperature-oxygen 711
fugacity tables for selected gas mixtures in the system C-H-O at one atmosphere total pressure, 712
Bull. Earth and Mineral Sciences, Experiment Station, 88, 130pp., University Park,
713
Pennsylvania, USA. 714
Dickenson, M.P., and P.C. Hess (1981), Redox equilibria and the structural role of iron in 715
alumino-silicate melts, Contrib. Mineral. Petrol., 78, 352-357. 716
Doremus, R. H. (1960), Diffusion of oxygen from contracting bubbles in molten glass, J. 717
Amer. Ceram. Soc., 43(12), 655-661.
718
Dunn, T. (1982), Oxygen diffusion in three silicate melts along the join diopside-719
anorthite, Geochim. Cosmochim. Acta, 46, 2293-2299. 720
Dunn, T. (1983), Oxygen chemical diffusion in three basaltic liquids at elevated 721
temperatures and pressures, Geochim. Cosmochim. Acta, 47, 1923-1930. 722
Dunn, T. and C. M. Scarfe (1986), Variation of the chemical diffusivity of oxygen and 723
viscosity of an andesite melt with pressure at constant temperature, Chem. Geology, 54, 203-215. 724
Everman, R. L. A. and R. F. Cooper (2003), Internal reduction of an iron-doped 725
magnesium aluminosilicate melt, J. Amer. Ceram. Soc., 86(3), 487-494. 726
Frost, D. J., and C. A. McCammon (2008), The redox state of the Earth’s mantle, Annual 727
Rev. Earth and Planet. Sciences, 36, 389-420.
728
Gaillard, F., B. Scaillet and M. Pichavant (2002), Kinetics of iron oxidation-reduction in 729
hydrous silicic melts, Am. Mineralogist, 87(7), 829-837. 730
Gaillard, F., B. Schmidt, S. Mackwell and C. McCammon (2003a), Rate of hydrogen-iron 731
redox exchange in silicate melts and glasses, Geochim. Cosmochim. Acta, 67 (13), 2427-2441. 732
Gaillard, F., M. Pichavant, and B. Scaillet (2003b), Experimental determination of 733
activities of FeO and Fe2O3 components in hydrous silicic melts under oxidizing conditions, 734
Geochim. Cosmochim. Acta, 67 (22), 4389-4409.
735
Gaillard, F. (2004), Laboratory measurements of electrical conductivity of hydrous and 736
dry silicic melts under pressure, Earth Planet. Sci. Lett., 218(1–2), 215–228, doi:10.1016/S0012-737
821X(03)00639-3. 738
Gaillard, F., and G. Iacono-Marziano (2005), Electrical conductivity of magma in the 739
course of crystallization controlled by their residual liquid composition, J. Geophys. Res., 110, 740
B06204, doi:10.1029/ 2004JB003282. 741
Gaillard, F., and B. Scaillet (2009), The sulfur content of volcanic gases on Mars, Earth 742
Planet. Sci. Lett., 279, 34-43.
743
Giordano, D., J. K. Russell, and D. B. Dingwell (2008), Viscosity of magmatic liquids: A 744
model, Earth Planet. Sci. Lett., 271(1-4), 123-134. 745
Goldman, D. S. (1983), Oxidation equilibrium of iron in borosilicate glass, J. Amer. 746
Ceram. Soc., 66(3), 205-209.
747
Goldman, D. S. and P. K. Gupta (1983), Diffusion-controlled redox kinetics in a 748
glassmelt, J. Amer. Ceram. Soc., 66(3), 188-190. 749
Henderson, P., J. Nolan, G. C. Cunningham, and R. K. Lowry (1985), Structural control 750
and mechanisms of diffusion in natural silicate melts, Contrib. Mineral. Petrol., 89(2 – 3), 263 – 751
272, doi:10.1007/BF00379459. 752
Herd, C. D. K., L. E. Borg, J. H. Jones, and J. J. Papike (2002), Oxygen fugacity and 753
geochemical variations in the martian basalts: implications for martian basalt petrogenesis and 754
the oxidation state of the upper mantle of Mars, Geochim. Cosmochim. Acta, 66(11), 2025-2036. 755
Herd, C. D. K. (2008), Basalts as probes of planetary interior redox state, Reviews in 756
Mineralogy and Geochemistry, 68, 527-553.
757
Huebner, J. S., and R. G. Dillenburg (1995), Impedance spectra of hot, dry silicate 758
minerals and rock: Qualitative interpretation of spectra, Am. Mineral., 80(1– 2), 46–64. 759
Jaupart, C., and Tait, S. (1995), Dynamics of differentiation in magma reservoirs, , J. 760
Geophys. Res., 100, B9: 17615-17656.
761
Kress, V. C., and I. S. E. Carmichael (1988), Stoichiometry of the iron oxidation, Am. 762
Mineral., 73(11-12), 1267-1274.
763
Kress, V. C., and I. S. E. Carmichael (1991), The compressibility of silicate liquids 764
containing Fe2O3 and the effect of composition, temperature, oxygen fugacity and pressure on 765
their redox states, Contrib. Mineral. Petrol., 108(1-2), 82-92. 766
Lange, R. A. and I. S. E. Carmichael (1989), Ferric-ferrous equilibria in Na2O-FeO-767
Fe2O3-SiO2 melts – effects of analytical techniques on derived partial molar volumes, Geochim. 768
Cosmochim. Acta, 53(9), 2195-2204.
769
La Tourrette, T., G.J. Wasserburg and A.J. Fahey (1996), Self diffusion of Mg, Ca, Ba, 770
Nd, Yb, Ti, Zr, and U in haplobasaltic melt, Geochim. Cosmochim. Acta, 60(8), 1329-1340. 771
Lawless, W. N., and B. Wedding (1970), Photometric study of the oxygen diffusivity in 772
aluminosilicate glass, J. Appl. Phys., 41, 1926-1929. 773
Lesher, C.E., R.L. Hervig and D. Tinker (1996), Self diffusion of network formers 774
(silicon and oxygen) in naturraly occurring basaltic liquid, Geochim. Cosmochim. Acta, 60(3), 775
405-413. 776
Magnien, V., D. R. Neuville, L. Cormier, J. Roux, J.-L. Hazemann, D. de Ligny, S. 777
Pascarelli, I. Vickridge, O. Pinet, and P. Richet (2008), Kinetics and mechanisms of iron redox 778
reactions in silicate melts: the effects of temperature and alkali cations, Geochim. Cosmochim. 779
Acta, 72(8), 2157-2168 .