HAL Id: hal-00318247
https://hal.archives-ouvertes.fr/hal-00318247
Submitted on 21 Dec 2006
HAL is a multi-disciplinary open access
archive for the deposit and dissemination of
sci-entific research documents, whether they are
pub-lished or not. The documents may come from
teaching and research institutions in France or
abroad, or from public or private research centers.
L’archive ouverte pluridisciplinaire HAL, est
destinée au dépôt et à la diffusion de documents
scientifiques de niveau recherche, publiés ou non,
émanant des établissements d’enseignement et de
recherche français ou étrangers, des laboratoires
publics ou privés.
transition described in terms of fractal dynamics
G. Balasis, I. A. Daglis, P. Kapiris, M. Mandea, D. Vassiliadis, K. Eftaxias
To cite this version:
G. Balasis, I. A. Daglis, P. Kapiris, M. Mandea, D. Vassiliadis, et al.. From pre-storm activity to
magnetic storms: a transition described in terms of fractal dynamics. Annales Geophysicae, European
Geosciences Union, 2006, 24 (12), pp.3557-3567. �hal-00318247�
© European Geosciences Union 2006
Geophysicae
From pre-storm activity to magnetic storms: a transition described
in terms of fractal dynamics
G. Balasis1,2, I. A. Daglis1, P. Kapiris1,3, M. Mandea2, D. Vassiliadis4, and K. Eftaxias3
1Institute for Space Applications and Remote Sensing, National Observatory of Athens, Metaxa and Vas. Pavlou St., Penteli, 15236 Athens, Greece
2GeoForschungsZentrum Potsdam, Telegrafenberg, 14473 Potsdam, Germany
3Solid State Section, Physics Department, University of Athens, Panepistimiopolis, Zografos, 15784 Athens, Greece 4NASA Goddard Space Flight Center, Greenbelt, Maryland 20771, USA
Received: 18 December 2005 – Revised: 21 November 2006 – Accepted: 24 November 2006 – Published: 21 December 2006
Abstract. We show that distinct changes in scaling
parame-ters of the Dstindex time series occur as an intense magnetic
storm approaches, revealing a gradual reduction in complex-ity. The remarkable acceleration of energy release – mani-fested in the increase in susceptibility – couples to the tran-sition from anti-persistent (negative feedback) to persistent (positive feedback) behavior and indicates that the occurence of an intense magnetic storm is imminent. The main driver of the Dst index, the V BSouthelectric field component, does not reveal a similar transition to persistency prior to the storm. This indicates that while the magnetosphere is mostly driven by the solar wind the critical feature of persistency in the magnetosphere is the result of a combination of solar wind and internal magnetospheric activity rather than solar wind variations alone. Our results suggest that the development of an intense magnetic storm can be studied in terms of “inter-mittent criticality” that is of a more general character than the classical self-organized criticality phenomena, implying the predictability of the magnetosphere.
Keywords. Magnetospheric physics (Magnetospheric
con-figuration and dynamics; Solar wind-magnetosphere interac-tions; Storms and substorms)
1 Introduction
Magnetic storms (MSs) occur when the accumulated input power from the solar wind exceeds a certain threshold. MSs are a main element of space weather: they have severe im-pacts on both space-borne and ground-based technological systems (Daglis et al., 2001). MS intensity is usually repre-sented by an average of the geomagnetic perturbations mea-sured at four mid-latitude magnetic observatories, known as the Dstindex (http://swdcwww.kugi.kyoto-u.ac.jp/). Intense
Correspondence to: G. Balasis
MSs are relatively rare events; as in the case of tropospheric storms, earthquakes, solar flares, etc., the occurrence of geo-magnetic storms rapidly decreases as their magnitude grows. The present study is initially focused on one year of Dstdata
(2001), characterized by two important events, in the first and last trimesters of the considered interval.
The complex system of the Earth’s magnetosphere, which corresponds to an open spatially extended nonequilibrium (input – output) system, manifests itself in linkages be-tween space and time, producing characteristic fractal struc-tures (Freeman and Watkins, 2002). In this paper, the frac-tal spectral properties of the Dst data are examined using
wavelet analysis methods developed by Torrence and Compo (1998), Balasis et al. (2005) and Mandea and Balasis (2006). We point out that the same wavelet tools have been ap-plied by Mandea and Balasis (2006) to satellite magnetic data for an astrophysical application, thus showing remark-able applicability to the delineation of fine electromagnetic structures contained within geophysical signals (http://www. sciencemag.org/content/vol314/issue5798/twil.dtl). Here, it is shown that distinct changes in associated scaling parame-ters emerge as large magnetospheric disturbances approach (e.g. 31 March 2001 and 6 November 2001 with minimums
Dst −387 nT and −292 nT, respectively).
Since the magnetospheric activity is determined to a large extent by variations in the interplanetary medium, it is impor-tant to differentiate between scalings produced by the vari-ability of the interplanetary magnetic field and those due to internal processes. Therefore, we have applied similar tools of analysis to corresponding time series of the solar wind driver variables, V BSouth. Our findings suggest that the tran-sition in the Dst scaling represents the effects of internal
magnetospheric processes rather than interplanetary varia-tions. Our conclusions are supported with results from an-other solar cycle maximum (1989).
2 Fractal spectral analysis of the Dst time series
Observations suggest that under the influence of the solar wind, the magnetosphere can be channelled into a glob-ally non-equilibrium critical state (Chang, 1999; Consolini and Chang, 2001, 2002). A common hallmark of out-of-equilibrium phenomena is their extraordinary complexity. Complex systems self-organize their internal structure and their dynamics, showing novel and surprising macroscopic properties, including coherent large-scale collective behav-iors. A universal footprint seen in many complex systems near criticality is the self-affinity for energy release from the system that signals a fractal topology, namely a multi-scale process with no preferred spatial and temporal scales. The fractional power-law relationship is a standard definition of a self-affine structure.
A basic reason for our interest in complexity is the strik-ing similarity in behavior near the critical point among sys-tems that are otherwise quite different in nature (Stanley, 1999, 2000; Viczek, 2001, 2002; Sornette, 2004). Lots of work on complexity focuses on power-law distributions which describe the scaling properties of fractal processes and structures (e.g. Malamud et al., 1998). Recent studies have demonstrated that a large variety of complex processes, in-cluding earthquakes (Bak, 1996), forest fires (Malamud et al., 1998), heartbeats (Peng et al., 1995), human coordina-tion (Gilden et al., 1995), neuronal dynamics (Worrell et al., 2002) and financial markets (Mandelbrot, 2005; Kiyono et al., 2006) exhibit statistical similarities, most commonly power-law scaling behaviors of a particular observable.
Although self-organized criticality (SOC) can exist, strictly speaking, only in the limit of infinitely slow external input, where a complete separation of time scales is achieved (Gedalin et al., 2005), it has also been applied to presum-ably strong driving avalanching systems. A good example of such systems is space plasma and, in particular, the plasma in the Earth’s magnetotail under magnetic substorm conditions (Chang et al., 2006). Additionally, Jun and Wu (2005) have recently found a large-scale intermittency in a system which is strongly driven in turbulence by an external source.
If a time series is a temporal fractal, then a power-law of the form
S(f ) ∝ f−β (1)
is obeyed, with S(f ) the power spectral density and f the frequency. The spectral scaling exponent β is a measure of the strength of time correlations. The suitability of the fit of a time series to the power-law is represented by the linear correlation coefficient, r, of this representation.
A way to examine transient phenomena is to divide the measurements into time windows and analyze these win-dows. If this analysis yields different results for some pre-cursory time intervals, then a transient behavior can be ex-tracted. Thus, we first examine whether the underlying com-plexity manifests itself in linkages between space and time,
generally producing fractal patterns, as the extreme event is approached. In particular, our attention is directed to whether distinct alterations in the associated scaling param-eters emerge when an intense MS approaches. For this pur-pose, we applied the wavelet analysis technique (Balasis et al., 2005; Mandea and Balasis, 2006) to the Dst time
vari-ations, in order to derive the coefficients of its power spec-trum.
The wavelet transform provides a representation of the signal in both the time and frequency domains (Kumar and Foufoula-Georgiou, 1997). In contrast to the Fourier trans-form, which provides the description of the overall regular-ity of signals, the wavelet transform identifies the tempo-ral evolution of various frequencies (i.e. as a time-frequency plane that indicates the frequency content of a signal at every time). This feature of the wavelet transform is useful for the
Dst time series because it is non-stationary and has a
time-varying frequency content. The decomposition pattern of the time-frequency plane is predetermined by the choice of the basis function. In the present study, we used the continuous wavelet transform with the Morlet wavelet as the basis func-tion. The results were checked for consistency using the Paul and DOG mother functions (Torrence and Compo, 1998).
The non-stationary character of the Dst index requires
methods that can appropriately treat such non-stationarities. In practice, the condition of stationarity for non-stationary signals can be satisfied by dividing the signal into blocks of short, pseudo-stationary segments (Akay, 1997). On the other hand, recent studies show that the wavelet transform can remove effects due to non-stationarities present in the time series (Amaral et al., 1998). For the 1-year period con-sidered here (year 2001), applying the wavelet transform to the hourly Dst values leads to a matrix with 65× (365×24)
elements, where 65 is the number of frequencies. Then, power spectral densities were estimated in the frequency range from 2 to 128 h, using a moving window of 256 sam-ples. The number of samples by which the moving window sections overlap is 255. Finally, the spectral parameters r and
β were calculated for each window.
In Fig. 1, the Dst time series and its wavelet power
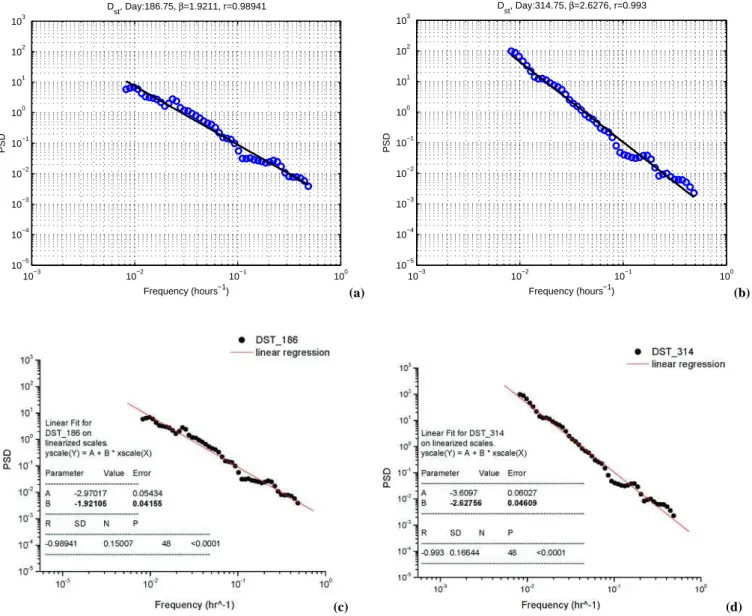
spec-trum are shown (upper panels), while in Fig. 2, the tempo-ral evolution of its specttempo-ral parameters r and β are plotted (upper panels). In Figs. 3a–3b, we show examples of the fitting of equation (1) in individual time windows; each of these windows has a duration of 256 h. In Figs. 3c–3d the error estimates which correspond to the spectra presented in Figs. 3a–3b are shown.
2.1 Fractal properties
The temporal evolution of r (see rDstplot in Fig. 2) indicates
that the fit to the power-law is excellent (r is always above 0.94). This means that the fractal character of the underlying processes and structures is compact: the activity could be as-cribed to a multi-time-scale cooperative activity of numerous
31/3 6/11 −400 −300 −200 −100 0 Dst (nT) 0 30 60 120 150 180 210 240 270 330 360 −400 −300 −200 −100 0 log 2 (Period) (hours) 0 30 60 31/3 120 150 180 210 240 270 6/11 330 360 2 4 6 8 4 6 8 31/3 6/11 0 10 20 30 VB south (mV/m) 0 30 60 120 150 180 210 240 270 330 360 0 10 20 30 Time (days) in 2001 log 2 (Period) (hours) 0 30 60 31/3 120 150 180 210 240 270 6/11 330 360 2 4 6 8 4 6 8
Fig. 1. From top to bottom: Dst time series and its wavelet power
spectrum (upper panels); V BSouthtime series and its wavelet power spectrum (lower panels). The 31 March and 6 November 2001 MSs are marked with red in the time series plots.
activated units, in which an individual unit behavior is dom-inated by its neighbors, so that all units simultaneously alter their behavior to a common large-scale fractal pattern. In the cases of the 31 March and 6 November 2001 MSs, we ob-serve a further increase in r as the main phase approaches: a region with r>0.99 is observed during the last stage of pre-cursory activity. The high r-values indicate that the cluster-ing of activated events in more compact fractal structures is strengthened during this period. Such elementary activated events could, in the case of MSs, be successive stages of acceleration and earthward transport of ions – for example due to substorm-induced impulsive electric fields (Daglis et al., 2004). Substorms, as well as regular convection result in multiple ring currents with a distribution of growth/decay times (Liemohn and Kozyra, 2003).
2.2 The transition from anti-persistent to persistent proper-ties
Two classes of signal have been widely used to model stochastic fractal time series (Heneghan and McDarby, 2000): fractional Gaussian noise (fGn) and fractional Brow-nian motion (fBm). These are, respectively, generalizations of white Gaussian noise and Brownian motion. A formal mathematical definition of continuous fBm was first offered by Mandelbrot and Ness (1968). For the case of the fGn model the scaling exponent β lies between −1 and 1, while the regime of fBm is indicated by β values from 1 to 3.
For our study, the β values (see βDstplot in Fig. 2) are
dis-tributed in a region defined from 1 to 3. This means that the time profile of the Dst time series is qualitatively analogous
to fBm, possessing long-range temporal correlations. More precisely, the observed fractal-law (S(f ) ∝ f−β) indicates the existence of long-term memory. This means that the cur-rent value of the geomagnetic signal is correlated not only
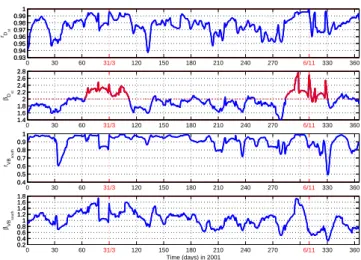
31/3 6/11 0.93 0.94 0.95 0.96 0.97 0.98 0.99 1 rDst 0 30 60 120 150 180 210 240 270 330 360 0.93 0.94 0.95 0.96 0.97 0.98 0.99 1 31/3 6/11 1.4 1.6 1.8 2 2.2 2.4 2.6 2.8 βDst 0 30 60 120 150 180 210 240 270 330 360 1.4 1.6 1.8 2 2.2 2.4 2.6 2.8 31/3 6/11 0.4 0.5 0.6 0.7 0.8 0.9 1 rVB south 0 30 60 120 150 180 210 240 270 330 360 0.4 0.5 0.6 0.7 0.8 0.9 1 31/3 6/11 0.2 0.4 0.6 0.81 1.2 1.4 1.6 1.8 βVB south 0 30 60 120 150 180 210 240 270 330 360 0.2 0.4 0.6 0.81 1.2 1.4 1.6 1.8 Time (days) in 2001
Fig. 2. From top to bottom: Dstlinear correlation coefficients r and
spectral exponents β (upper panels), and corresponding V BSouthr and β values (lower panels). The spectral parameters were esti-mated from the wavelet power spectra of Fig. 1 using a 256-hour moving window with an overlap of 255 samples. The red dashed line in βDst plot marks the transition between anti-persistent and
persistent behavior.
with its most recent values but also with its long-term his-tory in a scale-invariant, fractal manner. In other words, the system refers to its history in order to determine its future.
The distribution of the β exponent is also shifted to higher values as the intense MSs approach. This shift reveals sev-eral features of the underlying mechanism. As β increases, the spatial correlation in the time series also increases (Tur-cotte, 1997). This behavior indicates a gradual increase of the memory, and thus a gradual reduction in complexity in the underlying dynamics. This suggests that the occurence of an intense MS may represent a gradual transition from a less orderly state to a more orderly state (see also Sitnov et al., 2001).
The colour type of the power spectrum density (β>0) in-dicates that the spectrum manifests more power at low fre-quencies than at high frefre-quencies. The spectral exponent β is increasing with time, indicating the gradual enhancement of lower frequency fluctuations. This observation is consis-tent with the following physical picture: the activated partial ring currents coalesce to form larger fractal structures, i.e. the events are initiated at the lowest level of the hierarchy, with the smallest elements merging in turn to form larger and larger ones. This sign may be considered as a precursor of the forthcoming magnetic storm.
The β exponent is related to the Hurst exponent, H :
β = 2H + 1 (2)
with 0<H <1 (1<β<3) for the fBm random field model (Heneghan and McDarby, 2000). The exponent H
10−3 10−2 10−1 100 10−5 10−4 10−3 10−2 10−1 100 101 102 103 Frequency (hours−1) PSD Dst, Day:186.75, β=1.9211, r=0.98941 (a) 10−3 10−2 10−1 100 10−5 10−4 10−3 10−2 10−1 100 101 102 103 Frequency (hours−1) PSD Dst, Day:314.75, β=2.6276, r=0.993 (b) (c) (d)
Fig. 3. (a)–(b) The power spectral density functions of the Dst index for days starting on the values indicated on the top of each diagram
and lasting 256 h. The black line gives a fitted power-law of the form S(f ) ∝ f−βto periods 2–128 h. (c)–(d) Error estimates of the linear coefficients r and spectral exponents β for the spectra shown in (a) and (b), respectively.
characterizes the persistent/anti-persistent properties of the signal (Kapiris et al., 2003, 2004a, b).
The range 0<H <0.5 (1<β<2) indicates anti-persistency, which means that if the fluctuations increase in a period, it is likely to decrease in the interval immediately following and vice versa. Physically, this implies that fluctuations tend to induce stability within the system (negative feedback mecha-nism). Figure 2 reveals that the Dst time series exhibits
anti-persistent properties during the quiet period (i.e. well before and after 31 March and 6 November 2001 MSs).
We draw attention to the fact that Dst exhibits
persis-tent properties, 0.5<H <1 (2<β<3), around 31 March and 6 November 2001 MSs (c.f. Fig. 2: parts of βDstplot, marked
in red). This means that if the amplitude of the fluctuations
increases in a time interval, it is likely to continue increasing in the immediately next interval. In other words, the under-lying dynamics is governed by a positive feedback mecha-nism. A close up of the Dst time series from days 60 to 120
and 280 to 340, as well as the corresponding wavelet power spectra and spectral parameters r and β, are given in Figs. 4a and 4b, respectively.
The value H =0.5 (β=2) suggests that there is no corre-lation between the repeated increments. Consequently, this particular value takes on a special physical meaning: it marks the transition between anti-persistent and persistent behav-ior in the time series. To conclude, one can recognize two different regimes. The first refers to quiet epochs of mag-netospheric activity. The associated Dst time series follows
31/3 −400 −300 −200 −100 0 Dst (nT) 60 65 70 75 80 85 95 100 105 110 115 120 −400 −300 −200 −100 0 log 2 (Period) (hours) 60 65 70 75 80 85 31/3 95 100 105 110 115 120 2 4 6 8 4 6 8 31/3 0.96 0.97 0.98 0.99 1 rDst 60 65 70 75 80 85 95 100 105 110 115 120 0.96 0.97 0.98 0.99 1 31/3 1.6 1.8 2 2.2 2.4 2.6 βDst 60 65 70 75 80 85 95 100 105 110 115 120 1.6 1.8 2 2.2 2.4 2.6 Time (days) in 2001 6/11 −300 −200 −100 0 Dst (nT) 280 285 290 295 300 305 315 320 325 330 335 340 −300 −200 −100 0 log 2 (Period) (hours) 280 285 290 295 300 305 6/11 315 320 325 330 335 340 2 4 6 8 4 6 8 6/11 0.95 0.96 0.97 0.98 0.99 1 rDst 280 285 290 295 300 305 315 320 325 330 335 340 0.95 0.96 0.97 0.98 0.99 1 6/11 1.4 1.6 1.8 2 2.2 2.4 2.6 2.8 βDst 280 285 290 295 300 305 315 320 325 330 335 340 1.4 1.6 1.8 2 2.2 2.4 2.6 2.8 Time (days) in 2001 (a) (b) 31/3 0 20 40 VB south (mV/m) 60 65 70 75 80 85 95 100 105 110 115 120 0 10 20 30 40 log 2 (Period) (hours) 60 65 70 75 80 85 31/3 95 100 105 110 115 120 2 4 6 8 4 6 8 31/3 0.8 0.84 0.88 0.92 0.96 1 rVB south 60 65 70 75 80 85 95 100 105 110 115 120 0.8 0.84 0.88 0.92 0.96 1 31/3 0.8 1 1.2 1.4 1.6 1.8 βVB south 60 65 70 75 80 85 95 100 105 110 115 120 0.8 1 1.2 1.4 1.6 1.8 Time (days) in 2001 6/11 0 5 10 15 VB south (mV/m) 280 285 290 295 300 305 315 320 325 330 335 340 0 5 10 15 log 2 (Period) (hours) 280 285 290 295 300 305 6/11 315 320 325 330 335 340 2 4 6 8 4 6 8 6/11 0.4 0.6 0.8 1 rVB south 280 285 290 295 300 305 315 320 325 330 335 340 0.4 0.5 0.6 0.7 0.8 0.9 1 6/11 0.2 0.4 0.6 0.8 1 1.2 1.4 1.6 1.8 βVB south 280 285 290 295 300 305 315 320 325 330 335 340 0.2 0.4 0.6 0.8 1 1.2 1.4 1.6 1.8 Time (days) in 2001 (c) (d)
Fig. 4. (a)–(d) A close-up on days 60 to 120 and 280 to 340 of Figs. 1–2. At each subfigure: Dst or V BSouthtime series and its wavelet
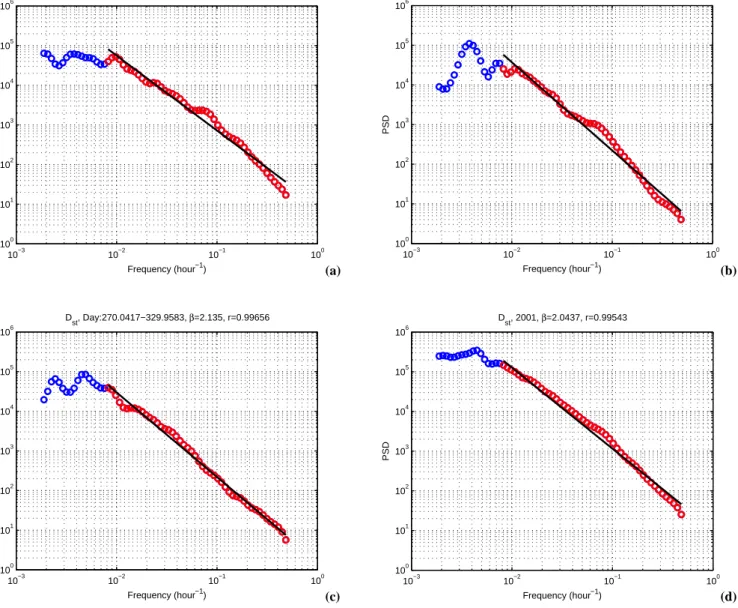
power spectrum (upper panels), corresponding linear correlation coefficients r and spectral exponents β (lower panels). the fBm model with anti-persistent properties. Figure 5a
shows the function logS(f ) versus f for such a quiet period (days 150–240). The anti-persistent behavior is verified. The second regime refers to the epoch including an intense MS. The Dst time series also obeys the fBm model; it, however,
shows persistent behavior. Figures 5b–5c show the function
logS(f ) versus f for two such epochs associated with the
two intense MSs emerged during the 2001. The plot verifies their persistent behavior. Based on the results of Figs. 5a–5c, Fig. 2 shows the consecutive transitions from one regime to another.
Remark: Figure 5d shows the power spectrum of Dst
in-dex for the year 2001. The slope of the spectral line is ap-proximately 2. This fractal feature suggests that the dynam-ics of the whole time series is similar to that of a Brownian motion. This result is in harmony with the recent analysis performed by Wei et al. (2004). The average of the power spectral density functions of the Dst index for many years
reveals that its power spectrum exhibits some periodicities at
frequencies of about 1/(6T), 1/(8T), (1/12T), (1/24T), where
T =1 h, which has also been previously detected by Takalo et
al. (1995).
3 Is the transition in the Dstsolely imposed by the solar
wind?
Since the magnetospheric activity is determined to a large ex-tent by variations in the interplanetary medium, it is impor-tant to differentiate between scalings produced by the vari-ability of the interplanetary magnetic field and those due to internal processes. Magnetospheric convection, which leads to ring current intensification and an increase in ground ge-omagnetic disturbances (represented by Dst), is primarily
driven by the solar wind electric field v×B, and in partic-ular its negative part, V BSouth. In Fig. 1, the V BSouthtime series data and its wavelet power spectrum are also shown (lower panels). The correlation coefficient r (see rV BSouth
10−3 10−2 10−1 100 100 101 102 103 104 105 106 Frequency (hour−1) PSD Dst, Day:150.0417−239.9583, β=1.891, r=0.98972 (a) 10−3 10−2 10−1 100 100 101 102 103 104 105 106 Frequency (hour−1) PSD Dst, Day:60.0417−119.9583, β=2.226, r=0.98974 (b) 10−3 10−2 10−1 100 100 101 102 103 104 105 106 Frequency (hour−1) PSD Dst, Day:270.0417−329.9583, β=2.135, r=0.99656 (c) 10−3 10−2 10−1 100 100 101 102 103 104 105 106 Frequency (hour−1) PSD Dst, 2001, β=2.0437, r=0.99543 (d)
Fig. 5. The power spectral density functions of the Dst index for days 150–240 (a), 60–120 (b), 270–330 (c) and for all days in year 2001
(d). The red points correspond to periods 2–128 h. The black line gives a fitted power-law of the form S(f )∝f−βto these periods.
unity in some cases. On 31 March 2001 r becomes almost 1, whereas on 6 November 2001 it drops close to 0.8. We also found that the V BSouthpower spectrum either implies fGn behavior (epochs with 0<β<1), or signifies an activity com-patible with the fBm model possessing anti-persistent prop-erties (epochs with 1<β<2). Indeed, the exponent increases with activity, but never reaches the persistent regime like Dst
does (c.f. βV BSouth plot in Fig. 2). Thus, the transition in the Dstscaling, i.e. the transition from the anti-persistent to
per-sistent regime, also reflects the effects of internal magneto-spheric processes rather than interplanetary variations alone. This is consistent with studies showing that interplanetary driving through southward-oriented magnetic fields is not al-ways by itself sufficient to drive intense MSs, because it is
subject to modulation by internal magnetospheric conditions (Daglis et al., 2003).
A close up of the V BSouth time series from days 60 to 120 and 280 to 340, as well as the corresponding wavelet power spectra and spectral parameters r and β are given in Figs. 4c–4d, respectively. Note that the wavelet spectra of
Dst and V BSouth are remarkably similar around 31 March 2001 (Figs. 4a and 4c). Since the wavelet spectrum is essen-tially a power spectrum in the wavelet basis, the Dst scaling
transition is due to the phase spectrum and its evolution in the course of the storm. For the other event (around 6 Novem-ber 2001), the wavelet spectra are different for the two vari-ables (Figs. 4b and 4d). These differences enhance our point of view that some of the magnetospheric variability has
inter-nal origin and it is not solely due to the solar wind conditions. In Figs. 6a–6b Dst and V BSouthvariations, as well as
cor-responding r and β parameters from another year (1989), are shown. This year represents the previous solar cycle maximum. 1989 includes the largest magnetic storm ever recorded (−589 nT, 14 March 1989) and a group of 3 intense magnetic storms which occurred within a time interval of 3 months (−255 nT, 19 September 1989; −268 nT, 21 October 1989; −266 nT, 17 November 1989). Note that the β val-ues for Dst are well above 2 (β > 2.2) for a time interval
of approximately one month in the first case and for almost 3 months in the second case, respectively (see red color in Fig. 6a), while β never exceeds 1.5 for the V BSouthvalues (Fig. 6b).
4 A possible scenario for the development of intense
MSs
Maslov et al. (1994) have formally established the relation-ship between spatial fractal behavior and long-range tempo-ral correlations for a broad range of critical phenomena. By studying the time correlations in the local activity, they show that the temporal and spatial activity can be described as dif-ferent cuts in the same underlying fractal. In a geometrical sense, β specifies the strength of the signal irregularity as well. The fractal dimension D is calculated from the relation
D = (5 − β)/2 (3)
for the fBm random field model (Heneghan and McDarby, 2000), which, after considering the shift of β to higher val-ues, leads to a decrease in the fractal dimension as the mag-netic storm approaches. This may reflect that the action of anisotropy inherent to the system leads to the appearance of a clear preferred direction of elementary activities (ion accel-eration and earthward transport) just before the main event of the system’s evolution, which is the massive and continuous earthward injection of accelerated ions. Theoretical and ex-perimental evidence support the former hypothesis: through-out the entire main phase and during the early recovery phase of intense MSs the geometry of the energy flow produces a highly asymmetric ring current configuration (Daglis and Kozyra, 2002; Daglis et al., 2003; Balasis et al., 2004; Bal-asis and Egbert, 2006). The emergence of strong anisotropy rationalizes a further reduction in complexity with time.
By monitoring the temporal evolution of the fractal spec-tral characteristics in Dstwe found that distinct alterations in
the associated scaling parameters indicate a transition from the low-activity state to an abnormal/high-activity state (in-tense MS) as follows: (i) emergence of long-range corre-lations, i.e. appearance of memory effects. This implies a multi-time-scale cooperative activity of numerous activated units. (ii) Increase in the spatial correlation in the time se-ries with time. This indicates a gradual transition from a less orderly state to a more orderly state. (iii) Decrease in the
−600 −500 −400 −300 −200 −100 0 100 Dst (nT) 1.2 1.4 1.6 1.8 2 2.2 2.4 2.6 2.8 βDst 0 30 60 90 120 150 180 210 240 270 300 330 360 0.93 0.94 0.95 0.96 0.97 0.98 0.99 1 Time (days) in 1989 rDst (a) 0 2 4 6 8 10 12 VB south (mV/m) 0 0.5 1 1.5 βVB south 0 30 60 90 120 150 180 210 240 270 300 330 360 0.4 0.6 0.8 1 Time (days) in 1989 rVB south (b)
Fig. 6. (a–b)Dst or V BSouthtime series, corresponding linear
cor-relation coefficients r and spectral exponents β. The red dashed line in βDst plot (b) marks the transition between anti-persistent and persistent behavior.
fractal dimension of the variations with time, i.e. appearance of strong anisotropy in elementary activities. (iv) Existence of strong anti-persistent behavior in the pre-main phase in-terval, i.e. prior to the intense MS. (v) Decrease in the anti-persistent behavior with time. (vi) Emergence of anti-persistent properties in the tail of the time series. (vii) Predominance of large magnetospheric events with time. (viii) Significant ac-celeration of the energy release as the main event approaches, i.e. increase in the susceptibility of the system. (ix) Grad-ual appearance of higher frequencies in the spectrum with a simultaneous increase in the amplitudes at each emission rate as the MS peak approaches, mainly characterizing lower emission rates.
The aforementioned signatures (including temporal changes in scaling parameters) distinguish the dynamics of a complex system close to its instability. They may
indicate the following scenario for the development of an intense MS. During the pre-storm period, the system is in a sub-critical anti-persistent state, with a restricted and systematically fluctuating correlation length. Long-range correlations gradually build up through local interactions until instabilities extend throughout the entire system. Such instabilities can channel the magnetosphere into a globally stable non-equilibrium super-critical state. Substorms may be the agents by which longer correlations are estab-lished. A population of substorms, as a result of the solar wind-magnetosphere coupling, will advance the correlation length by an amount depending on the coupling magnitude and duration and on the magnetosphere state, triggering intense MSs only if the condition is right: in a sub-critical anti-persistent regime, a population of small solar wind energy inputs leads to a quickly decaying activity, namely substorms or weak storms which do not lead to massive ring current build-up. In the super-critical persistent state this process is just able to continue indefinitely. This explains in a natural way the following: when the magnetosphere is not close to criticality it can only exhibit a small response to a small external perturbation, whereas when the mag-netosphere is close to criticality its response may become explosive to the same small external perturbation due to the high susceptibility of its system. An intense MS destroys long correlations, creating a new low-activity period during which the process repeats under the influence of the solar wind by rebuilding correlation lengths toward criticality and the next large event. Thus, a large shock of the system may act as a sort of critical point (Chang, 1992), dividing the geomagnetic cycle into a period of growing correlations before the great event and a relatively uncorrelated phase thereafter.
In terms of criticality the acceleration of activity is the consequence of the growth of the spatial correlation length. Thus, a large MS which is not immediately preceded by a period of accelerating activity may represent a system which had previously reached a critical state but has not yet had an MS large enough to perturb the system away from the critical state. On the other hand, an accelerating geomagnetic activ-ity which is not followed by a large MS may mirror a system which has achieved criticality but in which a large event has not nucleated.
5 Self-organized or intermittent criticality?
The analogies with the dynamics of the SOC model for mag-netospheric substorms have been discussed by numerous au-thors (Sitnov et al., 2001; Uritsky et al., 2002 and refer-ences therein). Pure SOC models imply a system perpetually near instability, hence reducing the degree of predictability of individual events. Our analysis suggests that the magne-tosphere may not be in a state of continuous SOC. On the contrary, the aforementioned evolution incorporates a time
dynamics with memory effects, which may be characterized overall as “intermittent criticality” (Bowman et al., 1998; Sammis and Sornette, 2002). Intermittent criticality pre-dicts a time-dependent variation in the activity as the “critical point” is approached, implying, in contrast to SOC, a degree of predictability. The central prediction of this hypothesis is that large events occur when the system is near a critical state that is characterized by both extreme susceptibility to external factors and strong correlations between different ac-tivated parts of the systems (Bowman et al., 1998; Sammis and Sornette, 2002).
The present study suggests that it is important to distin-guish between SOC and intermittent criticality in the study of the MS cycle. A proper recognition and understanding of tuning parameters may lead to improved magnetospheric models having higher performance reliability. One of the main features in the complexity is the role that the topologi-cal disorder plays in such systems. The range of size stopologi-cales characterizing heterogeneities of the thresholds might act as a tuning parameter of the underlying final MS dynamics.
A question that arises is whether the evolution toward an instability of the system is inevitable after the appearance of distinct symptoms in the geomagnetic variations. The emer-gence of persistent behavior, the significant acceleration of the energy release, i.e. the increase in the susceptibility of the system, the appearance of fluctuations at all scales with a simultaneous predominance of large geomagnetic events, the emergence of strong anisotropy, namely the appearance of preferential direction, indicate that the generation of an intense MS becomes, indeed, unavoidable.
6 On the transition from the anti-persistent to
persis-tent regime
We focus on the observed interesting transition from the anti-persistent to the anti-persistent regime. The anti-anti-persistent behav-ior characterizes the magnetosphere during substorms, while the catastrophic events are in reasonable agreement with per-sistent models. Recent studies have also underlined the exis-tence of two different regimes in agreement with our pro-posal. We note that Sitnov et al. (2001) have suggested that while substorm activity resembles second-order phase transitions, the largest substorm avalanches (occurring dur-ing intense MSs) are shown to reveal features of first-order non-equilibrium transitions. Although there is no evidence of energy storage or turbulence in the magnetic topology of the inner magnetosphere the corresponding pictures in each regime (anti-persistent/second-order phase transitions — persistent/first order non-equilibrium transitions) are not in contradiction.
The point of view that the substorm activity resembles the nonequilibrium (first and/or second order) phase transi-tion (Sitnov et al., 2001) is also consistent with the “mag-netic topological complexity” emerging from Chang’s model
(Chang, 1999, 2001a). In the frame of this approach, if we consider a physical system with a given disorder magnetic field structure, the minimum free energy is a function of the topological complexity of the magnetic field. In such a system, any non-ideal process which modifies the over-all topology may be associated with a sort of a dynamical transition between two different local minima in the config-uration space during which a certain amount of free energy is relaxed. The emerging dynamical framework is that of a random walk in a complex free energy landscape. If the system evolves near criticality, this random walk in the free energy space will be characterized by a time correlation in the jumps. In this framework, magnetic substorms are better described in terms of noise-induced topological transitions in an extended out-of-equilibrium system. In other words, the magnetic substorm is the set of phenomena during which a reduction in topological complexity takes place (Chang, 2001a, 2001b; Consolini and Chang, 2001, 2002; Consolini and De Michelis, 2002). The role of the solar wind driver would be to enhance the internal noise (i.e. the internal fluc-tuations) which could induce a topological transition among metastable complex topologies. In such a case, the evolution of the magnetospheric system will be the result of the com-bined effects of local couplings of the magnetic and plasmas structures, and of the noise intensity through the nonlineari-ties of the system. The aforementioned evolutionary scenario is one of strong dynamics, and involves the evolution among first-order and second-order transitions of topological com-plexity (Consolini and Chang, 2001). Furthermore, Chang et al. (2003, 2004) described a theory of intermittent turbulence in space plasmas which agrees with the idea of intermittent criticality discussed in the previous section.
7 Conclusions
The fractal spectral analysis applied here indicates that in-tense MSs are not clear SOC phenomena. SOC implies a system perpetually near global failure. This suggests large correlations would be maintained in the system, hence re-ducing the degree of predictability of individual intense MSs. However, several results of the present analysis have been in-terpreted in the frame of the intermittent criticality approach (Bowman et al., 1998; Sammis and Sornette, 2002), implying instead a magnetosphere maintained predominantly in a sub-critical state, with fluctuations during the intense MS repre-senting super-critical state. The preparation of an intense MS in the frame of the intermittent criticality, that is of a more general character than the classical SOC phenomena (Bak et al., 1987), implies a degree of predictability in the popula-tion dynamics (Sornette, 2004). Our results are consistent with the emergence of intermittent criticality.
Our analysis suggests as a main result that a spectral sig-nature related to the emergence of persistency of the Dsttime
series precedes an intense MS. The spectral signature is
inter-preted as a critical increase in the susceptibility of the system, an effect typical for a system in the super-critical state, where any small instabilities can provoke large-scale reactions ac-companied by essential energy release.
Recently, Chang et al. (2006) have noted the following:
“turbulence in space plasmas generally encompass fluctua-tions of all varieties and sizes, which interact and propagate throughout the plasma medium: multitudes of different sizes of large scale (i.e. sizes much larger than the original par-ticle sizes of the plasma medium) ‘coherent structures’ are formed. When coherent magnetic flux tubes with the same polarity migrate toward each other, strong local magnetic shears are created. It has been demonstrated that existing sporadic nonpropagating fluctuations will generally migrate toward the strong local magnetic shear region. Eventually the mean local energies of the coherent structures will be dissipated into these concentrated fluctuations in the coarse-grained sense and, thereby reconfigure the topologies of the coherent structures of the same polarity into a combined lower local energetic state, eventually allowing the coherent structures to merge locally. And, this merging or ‘magnetic reconfiguration’ process may repeat over and over again among the coherent structures. The fluctuations that are in-duced by such processes are sporadic and localized. Because the coherent structures are numerous and outsized, we ex-pect that the fluctuations within the interaction regions of these structures (resonance overlap regions) are generally large and can occur relatively often compared to those that would have been expected from a medium of uniformly sized plasma particles. Such statistical characteristic of ‘extreme events’ exemplifies the phenomenon of intermittent turbu-lence in space plasmas”. The whole description, perhaps
not surprisingly, seems to fit to our magnetospheric evolu-tion scenario presented in Sect. 4: the creaevolu-tion of the strong local magnetic shears agrees with the appearance of a clear preferred direction of elementary activities; the magnetic re-configuration process may be repeated over and over again among the coherent structures, as in the persistent state the local interactions are just able to continue indefinitely etc.
Two lines of evidence support one of the main results of our analysis: while the magnetosphere is mostly driven by the solar wind the critical feature of persistency in the mag-netosphere is the result of a combination of solar wind and internal magnetospheric activity rather than solar wind vari-ations alone. First, a search for a spectral signature in the main interplanetary driver of Dst, the V BSouthelectric field component, does not reveal a similar transition to persistency prior to or around the storm. Second, the wavelet spec-tra of Dst and V BSouth are remarkably similar around 31 March 2001 but quite different, around 6 November 2001, with the Dst spectrum possessing more power. These
differ-ences enhance our point of view that some of the magneto-spheric variability has internal origin and is not solely due to the solar wind conditions. This proposal is in agreement with the suggestion that the system may evolve toward a sort
of dynamical critical state, where a hierarchy of scale-free coherent structures can be generated from the macroscopic fluctuations of the system itself (Consolini and Chang, 2001). Other studies also indicate the existence of two differ-ent regimes in the dynamics of magnetosphere. Sitnov et al. (2001) suggest that the substorm dynamics resembles second-order phase transitions, while MSs, are shown to re-veal the features of first-order non-equilibrium transitions. The anti-persistency/persistency meet well the second or-der/first order phase transition correspondingly. Metastabil-ity and topological complexMetastabil-ity of the magnetic field, emerg-ing from Chang’s model (1999), also justify the transition un-der study. Results from the analysis of data from another year (1989) support the findings reported in the previous para-graph.
As it is noticed, a basic reason for our interest in complex-ity is the striking similarcomplex-ity in behavior near critical point among systems that are otherwise quite different in nature (Stanley, 1999, 2000; Viczek, 2001, 2002; Sornette, 2004). The above-mentioned picture of magnetospheric dynamics in response to solar wind is quite similar to what is observed in a different framework (Consolini and Chang, 2002): the ori-gin of the biological function in biochemistry (Careri, 1982, 1998). Enzymatic activity is indeed due to strong correla-tions among the various spontaneous fluctuacorrela-tions. We un-derline that the herein found distinct alterations as an intense MS approaches (e.g. transition from anti-persistency to per-sistency) were previously observed in the cases of seismic shocks and epileptic seizures (Kapiris et al., 2005), and thus imply a degree of universality in the behavior of these ex-treme events around their final stage.
For some years now there has been a mild controversy (Li et al., 2003) simmering between those who emphasize that the magnetosphere is mostly driven by the solar wind and thus its variability is due to the variability of the solar wind, and those who emphasize that some of its variability is inter-nally generated. Recently, Temerin and Li (2002) suggested that global magnetospheric features are driven by the solar wind and are predictable in a rather deterministic sense. For such features, chaotic behavior within the magnetosphere has little influence on the global outcome (Li et al., 2003). How-ever, as Li et al. (2003) noted, the degree to which the mag-netotail may exhibit turbulent behavior independent of the solar wind and thus influence the exact timing of substorms, recurrent smaller-scale enhancements in magnetic activity, is not yet known and highly controversial. The results of the present study suggest that all of these concepts remain to be investigated further. As for future work, it would also be in-teresting for a comparison with the present results to extend our analysis to 1-minute SYM-H data.
Acknowledgements. G. Balasis acknowledges support from the Greek General Secretariat for Research and Technology under re-search grant ENTER 04ER/35.
The Editor-in-Chief W. Kofman thanks two referees for their help in evaluating this paper.
References
Akay, M.: Time Frequency and Wavelets in Biomedical Signal Pro-cessing Engineering, Wiley-IEEE Press, pp. 768, 1997. Amaral, L., Goldberger, A., Ivanov, P., and Stanley, H.:
Scale-Independent Measures and Pathologic Cardiac Dynamics, Phys. Rev. Lett., 81, 2388–2391, 1998.
Bak, P.: How nature works, Springer, New York, 212 pp., 1996. Bak, P., Tang, C., and Wiesenfeld, K.: Self-organized criticality: an
explanation of 1/f noise, Phys. Rev. Lett., 59, 381–383, 1987. Balasis, G., Egbert, G. D., and Maus, S.: Local time effects in
satel-lite estimates of electromagnetic induction transfer functions, Geophys. Res. Lett., 31, doi:10.1029/2004GL020147, 2004. Balasis, G., Maus, S., L¨uhr, H., and Rother, M.: Wavelet analysis
of CHAMP flux gate magnetometer data, in: Earth Observation with CHAMP, edited by: Reigber, C., L¨uhr, H., Schwintzer, P., and Wickert, J., Springer, New York, 347–352, 2005.
Balasis, G. and Egbert, G. D.: Empirical orthogonal function analysis of magnetic observatory data: Further evidence for non-axisymmetric magnetospheric sources for satellite induction studies, Geophys. Res. Lett., 33, doi:10.1029/2006GL025721, 2006.
Bowman, D. D., Ouillon, G., Sammis, C. G., Sornette, A., and Sor-nette, D.: An observational test of the critical earthquake con-cept, J. Geophys. Res., 103, 24359–24372, 1998.
Careri, G.: Ordine e disordine nella materia, Laterza, Roma, 1982. Careri, G.: Cooperative charge fluctuations by migrating protons in
globular proteins, Progress in Biophysics and Molecular Biology, 70, 223–249, 1998.
Chang, T.: Low-dimensional behavior and symmetry-breaking of stochastic systems near criticality – can these effects be observed in space and in the laboratory?, IEEE Trans. Plasma Sci., 20, 6, 691–694, 1992.
Chang, T.: Self-organized criticality, multi-fractal spectra, sporadic localized reconnections and intermittent turbulence in magneto-tail, Phys. Plasmas, 6, 4137–4145, 1999.
Chang, T.: An example of resonances, coherent structures and topo-logical phase transition – the origin of the low frequency broad-band spectrum in the auroral zone, Nonlinear Proc. Geophys., 8, 175–180, 2001a.
Chang, T.: Colloid-like behavior and topological phase transitions in space plasmas: intermittent low frequency turbulence in the auroral zone, Phys. Scripta, T89, 80–83, 2001b.
Chang, T., Tam, S. W. Y., Wu, C. C., and Consolini G.: Complexity, Forced and/or Self-Organized Criticality, and Topological Phase Transitions in Space Plasmas, Space Science Reviews, 107, 425– 445, 2003.
Chang, T., Tam, S. W. Y., and Wu, C. C.: Complexity Induced Anisotropic Bimodal Intermittent Turbulence in Space Plasmas, Physics of Plasmas, 11, 1287–1299, 2004.
Chang, T., Tam, S. W. Y., and Wu, C. C.: Complexity in Space Plasmas – A Brief Review, Space Science Reviews, 122, 281-291, doi:10.1007/s11214-006-5957-4, 2006.
Consolini, G., and Chang, T.: Magnetic field topology and criti-cality in geotail dynamics: relevance to substorm phenomena, Space Sci. Rev., 95, 309–321, 2001.
Consolini. G. and De Michelis P.: Fractal time statistics of AE-index burst waiting times: evidence of metastability, Nonlinear Process. in Geophys., 9, 419–423, 2002.
Consolini, G. and Chang, T.: Complexity, magnetic field topology, criticality, and metastability in magnetotail dynamics, J. Atmos. Sol. Terr. Phys., 64, 541–549, 2002.
Daglis, I. A., Baker, D. N, Galperin, Y., Kappenman, J. G., and Lanzerotti, L. J.: Technological impacts of space storms: Outstanding issues, Eos Trans. AGU, 82, 585, doi:10.1029/01EO00340, 2001.
Daglis, I. A. and Kozyra, J. U.: Outstanding issues of ring current dynamics, J. Atmos. Solar-Terr. Phys., 64, 253–264, 2002. Daglis, I. A., Kozyra, J. U., Kamide, Y., Vassiliadis, D., Sharma,
A. S., Liemohn, M. W., Gonzalez, W. D., Tsurutani, B. T., and Lu, G.: Intense space storms: Critical issues and open disputes, J. Geophys. Res., 108, 1208, doi:10.1029/2002JA009722, 2003. Daglis, I. A., Delcourt, D., Metallinou, F.-A., and Kamide, Y.: Par-ticle acceleration in the frame of the storm-substorm relation, IEEE Trans. Plasma Science, 32, 1449–1454, 2004.
Freeman, M. P. and Watkins, N. W.: The Heavens in a Pile of Sand, Science, 298, 979–980, 2002.
Gedalin, M., Balikhin, M., Coca, D., Consolini, G., and Treumann R. A.: Kinetic description of avalanching systems, Phys. Rev. E, 72, doi:10.1103/PhysRevE.72.037103, 2005.
Gilden, D., Thornton, T., and Mallon, M.: 1/f noise in human cog-nition, Science, 267, 1837–1839, 1995.
Heneghan, C. and McDarby, G.: Establishing the relation between detrended fluctuation analysis and power spectral density analy-sis for stochastic processes, Phys. Rev. E., 62, 6103–6110, 2000. Jun, Y. and Wu, X. L.: Large-scale intermittency in two-dimensional driven turbulence, Phys. Rev. E, 72, doi:10.1103/PhysRevE.72.035302, 2005.
Kapiris, P., Eftaxias, K., Nomikos, K., Polygiannakis, J., Dologlou, E., Balasis, G., Bogris, N., Peratzakis, A., and Hadjikontis, V.: Evolving towards a critical point: A possible electromagnetic way in which the critical regime is reached as the rupture ap-proaches, Nonl. Proc. Geophys., 10, 511–524, 2003.
Kapiris, P., Balasis, G., Kopanas, J., Antonopoulos, G., Peratzakis, A., and Eftaxias, K.: Scaling similarities of multiple fracturing in solid materials, Nonl. Proc. Geophys., 11, 137–151, 2004a. Kapiris, P., Eftaxias, K., and Chelidze, T.: Electromagnetic
Sig-nature of Prefracture Criticality in Heterogeneous Media, Phys. Rev. Lett., 92, doi:10.1103/PhysRevLett.92.065702, 2004b. Kapiris, P., Polygiannakis, J., Li, X., Yao, X., and Eftaxias, K.:
Similarities in precursory features in seismic shocks and epileptic seizures, Europhys. Lett., 69, 657–663, 2005.
Kiyono, K., Struzik, Z. R., and Yamamoto, Y.: Criticality and Phase Transition in Stock-Price Fluctuations, Phys. Rev. Lett., 96, doi:10.1103/PhysRevLett.96.068701, 2006.
Kumar, P., and Foufoula-Georgiou, E.: Wavelet analysis for geo-physical applications, Rev. Geophys., 35, 385–412, 1997. Li, X., Temerin, M., Baker, D. N., Reeves, G. D.,
Lar-son, D., and Kanekal, S. G.: The Predictability of the Magnetosphere and Space Weather, EOS Transactions, 84, doi:10.1029/2003EO370002, 2003.
Liemohn, M. and Kozyra, J. U.: Lognormal form of the ring-current energy content, J. Atm. Sol.-Terr. Phys., 65, 871–886, 2003. Malamud, B., Morein, G., and Turcotte, D.: Forest fires: an
exam-ple of self-oganized critical behavior, Science, 281, 1840–1842, 1998.
Mandea, M. and Balasis, G.: The SGR 1806-20 magnetar signature on the Earth’s magnetic field, doi:10.1111/j.1365-246X.2006.03125.x, 2006.
Mandelbrot, B. and Ness, J., Fractional Brownian motions, frac-tional noises and applications, SIAM Rev., 10, 422–437, 1968. Mandelbrot, B.: Fractals and Scaling in Finance, Springer, New
York, 551 pp., 2005.
Maslov, S., Paczuski, M., and Bak, P.: Avalanches and 1/f Noise in Evolution and Growth Models, Phys. Rev. Lett., 73, 2162–2165, 1994.
Peng, C., Havlin S., Stanley, H., and Goldberger, A.: Quantification of scaling exponents and crossover phenomena in nonstationary heartbeat time series, Chaos, 5, 82–87, 1995.
Sammis, C. G., and Sornette, D.: Positive feedback, memory, and the predictability of earthquakes, Proc. Nat. Acad. Sci., 99, 2501–2508, 2002.
Sitnov, M. I., Sharma, A. S., Papadopoulos, K., and Vas-siliadis, D.: Modeling substorm dynamics of the magne-tosphere: From self-organization and self-organized critical-ity to nonequilibrium phase transitions, Phys. Rev. E, 65, doi:10.1103/PhysRevE.65.016116, 2001.
Sornette, D.: Critical Phenomena in Natural Sciences, Springer, Heidelberg, 528 pp., 2004.
Stanley, H. E.: Scaling, universality, and renormalization: Three pillars of modern critical phenomena, Rev. Mod. Phys., 71, S358–S366, 1999.
Stanley, H.: Exotic statistical physics: Applications to biology, medicine, and economics, Physica A, 285, 1–17, 2000.
Takalo, J., Lohikosiki, R., and Timonen, J.: Structure function as a tool in AE and Dst time series analysis, Geophys. Res. Lett., 22, 635–638, 1995.
Temerin, M. and Li, X.: A new model for the prediction of Dst on the basis of the solar wind, J. Geophys. Res., 107, A12, 1472, doi:10.1029/2001JA007532, 2002.
Torrence, C. and Compo, G. P.: A Practical Guide to Wavelet Anal-ysis, Bull. Am. Meteor. Soc., 79, 61–78, 1998.
Turcotte, D. L.: Fractals and Chaos in Geology and Geophysics, Cambridge Univ. Press, 398 pp., 1997.
Uritsky, V. M., Klimas, A. J., Vassiliadis, D., Chua, D., and Parks, G.: Scale-free statistics of spatiotemporal auroral emis-sions as depicted by POLAR UVI images: Dynamic magneto-sphere is an avalanching system, J. Geophys. Res., 107, (A12), doi:10.1029/2001JA000281, 2002.
Vicsek, T.: A question of scale, Nature, 411, 421, 2001. Vicsek, T.: The bigger picture, Nature, 418, 131, 2002.
Wei, H. L., Billings, S. A., and Balikhin, M.: Analysis of the ge-omagnetic activity of the Dst index and self affine fractals using wavelet transforms, Nonlinear Process. in Geophys., 11, 303– 312, 2004.
Worrell, G., Cranstoun, S., Litt, B., and Echauz, J.: Evidence for self-organized criticality in human epileptic hippocampus, Neu-rophysiology, Basic and Clinical, 13(16), 2017–2021, 2002.