HAL Id: hal-00301642
https://hal.archives-ouvertes.fr/hal-00301642
Submitted on 15 Mar 2006
HAL is a multi-disciplinary open access
archive for the deposit and dissemination of
sci-entific research documents, whether they are
pub-lished or not. The documents may come from
teaching and research institutions in France or
abroad, or from public or private research centers.
L’archive ouverte pluridisciplinaire HAL, est
destinée au dépôt et à la diffusion de documents
scientifiques de niveau recherche, publiés ou non,
émanant des établissements d’enseignement et de
recherche français ou étrangers, des laboratoires
publics ou privés.
Geomorphological mapping and geophysical profiling for
the evaluation of natural hazards in an alpine catchment
A. C. Seijmonsbergen, L. W. S. de Graaff
To cite this version:
A. C. Seijmonsbergen, L. W. S. de Graaff. Geomorphological mapping and geophysical profiling for
the evaluation of natural hazards in an alpine catchment. Natural Hazards and Earth System Science,
Copernicus Publications on behalf of the European Geosciences Union, 2006, 6 (2), pp.185-193.
�hal-00301642�
© Author(s) 2006. This work is licensed under a Creative Commons License.
and Earth
System Sciences
Geomorphological mapping and geophysical profiling for the
evaluation of natural hazards in an alpine catchment
A. C. Seijmonsbergen1and L. W. S. de Graaff2
1Institute of Biodiversity and Ecosystem Dynamics (IBED), University of Amsterdam, Nieuwe Achtergracht 166, 1018WV
Amsterdam, The Netherlands
2Research Foundation for Alpine and Subalpine Environments, Stern 6, 1721 DS, Broek op Langedijk, The Netherlands
Received: 18 October 2005 – Revised: 11 January 2006 – Accepted: 16 January 2006 – Published: 15 March 2006
Abstract. Liechtenstein has faced an increasing number of
natural hazards over recent decades: debris flows, slides, snow avalanches and floods repeatedly endanger the local infrastructure. Geomorphological field mapping and geo-electrical profiling was used to assess hazards near Malbun, a village potentially endangered by landslides, and especially debris flows. The area is located on the tectonic contacts of four different nappe slices. The bedrock consists of anhydrite and gypsum, dolomite, shale, marl, and limestone. The spa-tial distribution and occurrence of debris flows and slides is evaluated through a combination of geomorphological expert knowledge, and detailed visualization in a geographical in-formation system. In a geo-database a symbol-based 1:3000 scale geomorphological map has been digitized and recti-fied into polygons. The polygons include information on the main geomorphological environment, the Quaternary mate-rial distribution and of geomorphological processes, which are stored in attribute tables. The spatial distribution of these attributes is then combined with geophysical information and displacement rates interpolated from benchmark measure-ments. On one of the landslides two geo-electrical profiles show that the distance to a potential failure plane varies be-tween 10–20 m and that the topography of the failure plane is influenced by subterranean gypsum karst features. The displacement measurements show that this landslide actively disintegrates into minor slides and is not, therefore, a risk to the village of Malbun. The hazard zonation indicates that de-bris flows can pose a risk if no countermeasures are taken. Gypsum karst may locally accelerate the landslide activity. In contrast, the impact of debris flows is diminished because collapse dolines may act as sediment traps for the debris flow materials. This research illustrates how geomorphological expert knowledge can be integrated in a GIS for the evalua-tion of natural hazards on a detailed scale.
Correspondence to: A. C. Seijmonsbergen
1 Introduction
Population growth, expanding tourism and recent land use changes are some of the reasons that many mountain re-gions are confronted with an increasing number of natural hazards and damage to infrastructure (Rickli and Banzer, 1996). Malbun is a village located in the south-eastern part of Liechtenstein, a small alpine country between Switzerland and Austria (Fig. 1). Historical records reflect that debris flows reached some houses over the last 100 years (Wen-zel, 1985). Over the last decade there is a growing con-cern that debris flows, slides and avalanches might damage the infrastructure of Malbun village. Therefore, a joint re-search project of the Institute for Biodiversity and Ecosystem Dynamics (IBED) and the “Landesamt f¨ur Wald, Natur und Landschaft” (Forest, Nature and Landscape Department) in
Vaduz, Liechtenstein (de Graaff and Seijmonsbergen, 20001)
was started. The major goal was mapping and evaluation of a gypsum underlain landslide, and especially the debris flows that occurred in the Schlucher catchment, which is located directly east of Malbun (Fig. 1, photo). Many types of land-slides occur in the 51 ha large catchment of the Schlucher. Rock fall is active along the upper steep dolomite cliffs and local limestone exposures along the southern slopes. Debris flows can be generated from the available talus and weath-ering material at the foot of these cliffs. The transition of steeper to gentle terrain is characterized by numerous smaller and larger slides, both rotational and planar. The middle part of the catchment is taken in by a gypsum underlain landslide. Benchmarks were installed on and around this landslide, and have been measured on a yearly basis. The widespread oc-currence of gypsum in both the upper and middle reaches
1de Graaff, L. W. S. and Seijmonsbergen, A. C.:
Erdwis-sentschaftliche Untersuchungen im Schlucher (Malbun, F¨urstentum Liechtenstein), Report to “Landesamt fur Wald, Natur und Land-schaft, Liechtenstein”, Unpublished report, University of Amster-dam, 2000.
186 A. C. Seijmonsbergen and L. W. S. de Graaff: GIS-supported mapping and evaluation of natural hazard
Fig. 1. Location of the study area. The photo shows the small “Schlucher” catchment.
Fig. 2. The wooden drainage system is disrupted by the eroding power of debris flows, by small slides from the adjacent slopes (top right) and by differential movements within the landslide (detail top left), which leads to increased displacements rates.
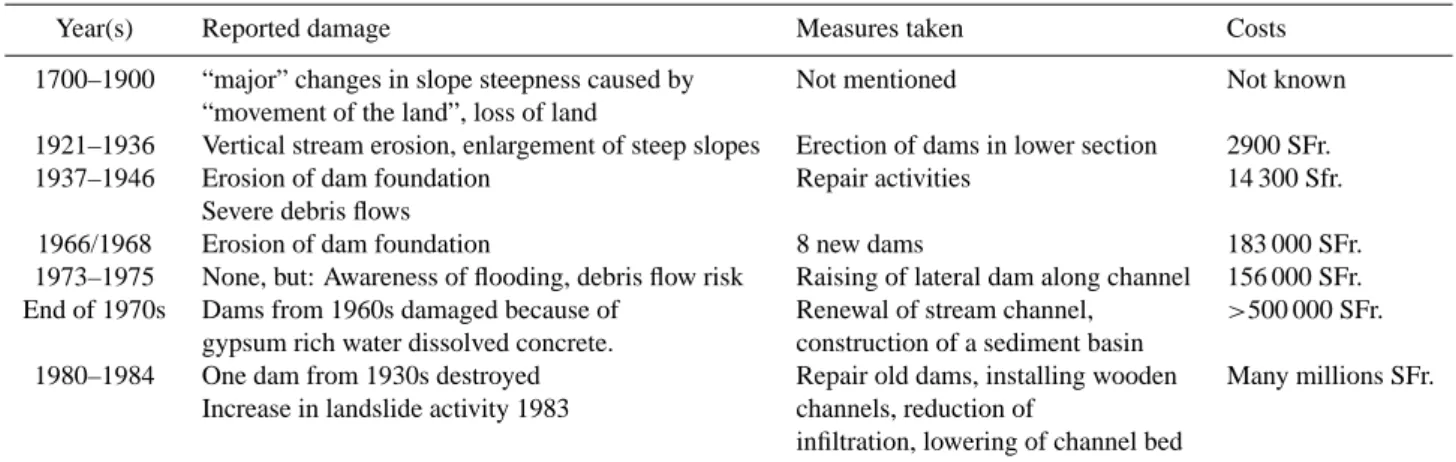
of the area is evidenced by the presence of numerous solu-tion features, such as dolines and collapse depressions. The distribution of all these features has been documented in the geomorphological map (Fig. 3). “Movement of the land” is known to occur for a long time in the Schlucher catchment. In Table 1 a summary of the major damaging events and mea-surements taken in relation to the historical torrent control program is presented (after Wenzel, 1985). Since the early 1980s a new torrent control program was started. In 1983 a new series of concrete check dams and a system of artificial wooden channels were built to improve runoff and to lower the local groundwater table, with the objective of reducing the landslide displacement rates. After approximately fifteen years the wooden system was damaged, due to differential
displacements within the landslide and the erosive forces of debris flows (Fig. 2). The resulting infiltration increased the displacement rates. It was noticed by Wenzel (1985) that the landslide could pose a serious threat to Malbun; in the event
of a sudden failure over 500 000 m3of material could be
re-leased. We therefore decided to evaluate the landslides and especially the displacement pattern and depth of the land-slide in the central part of the catchment (see Fig. 3). The ob-jectives of the study were: 1. to prepare a detailed 1:3000 ge-omorphological map that shows the spatial distribution of all landforms and processes; 2. to carry out a geophysical anal-ysis over the gypsum underlain landslide, and 3. to present a GIS-supported hazard zonation of debris flows.
Hazard zonation is the division of the land surface into areas and the ranking of these areas according to actual or potential hazards posed by landslides and other mass move-ments (Varnes, 1984). The delineation of these zones is of crucial importance for quantifying and reducing the risks as-sociated with geomorphological hazards. The method fol-lowed here is an adaptation of direct mapping methods de-scribed by Soeters and Van Westen (1996) and Van Westen
et al. (1997). It comprises a detailed geomorphological
map, prepared using the legend developed by de Graaff et al. (1987) and Seijmonsbergen (1992) for mountainous ar-eas. For the purpose of GIS-data handling and visualizing of thematic maps a geo-database was designed in ArcGIS which integrates geological information, geomorphological data, elevation data, displacement measurements and ortho-rectified air-photos. We used the concept of “Terrain Map-ping Units” (TMU), which was already applied in traditional and in GIS-based mapping (Dorren, 2002; Garcia-M´elendez, 1998; Iqballudin, 1999; Meyerink, 1988; Seijmonsbergen, 1992; Suryana, 1996). Many other “terrain unit” approaches
Table 1. Historical torrent control data in the Schlucher catchment (after Wenzel, 1985).
Year(s) Reported damage Measures taken Costs
1700–1900 “major” changes in slope steepness caused by Not mentioned Not known “movement of the land”, loss of land
1921–1936 Vertical stream erosion, enlargement of steep slopes Erection of dams in lower section 2900 SFr.
1937–1946 Erosion of dam foundation Repair activities 14 300 Sfr.
Severe debris flows
1966/1968 Erosion of dam foundation 8 new dams 183 000 SFr.
1973–1975 None, but: Awareness of flooding, debris flow risk Raising of lateral dam along channel 156 000 SFr. End of 1970s Dams from 1960s damaged because of Renewal of stream channel, >500 000 SFr.
gypsum rich water dissolved concrete. construction of a sediment basin
1980–1984 One dam from 1930s destroyed Repair old dams, installing wooden Many millions SFr. Increase in landslide activity 1983 channels, reduction of
infiltration, lowering of channel bed
have been proposed – e.g. the Desertification Response Units (Imeson and Cammeraat, 1999). All these approaches unify the concept of dividing the landscape into areas of compara-ble characteristics. The digitized 1:3000 scale geomorpho-logical map is the main document for the hazard zonation. The difference between this GIS-supported hazard zonation and other GIS-based studies is the detailed scale, which al-lows the fine patterns within the landslides to be linked to the displacement patterns in the benchmark measurements. Recently, various statistical techniques have been used in re-gional hazard studies (Fernandez et al., 2003; Ercanoglu et al., 2003; Santacana et al., 2003), in which local geomorpho-logical expert knowledge input was only implicitly included. Guzzetti et al. (1999) provide an overview of methods used in hazard studies. Another trend is to use Information Sys-tems for the assessment and management of natural hazards (e.g. Dai et al., 2002; Guzzetti and Tonelli, 2003; Gaspar et al., 2004).
2 Geology and geomorphology
2.1 Introduction
The success of a qualitative hazard zonation in alpine ar-eas is related to the detail and the reliability of the produced maps. In Liechtenstein, detailed geological maps are avail-able (Allemann, 1985), but geomorphological maps are not. The required detail for hazard zonation, the spatial surface distribution of the materials and the variation in logical processes were the reasons to construct a geomorpho-logical map that reflects not only individual landforms, but also shows relations between such landforms, in time and in space. Therefore, we have chosen a 1:3000 map scale, so that the displacement measurements and the results of geo-electrical profiles could be easily matched with patterns of landslides. For a better understanding of these relations, a
brief description of the geological situation and the geomor-phological landscape development is required.
2.2 Geological setting
The Malbun area is located in the northern calcareous Alps and belongs to the Austro-alpine nappe complex of the Eastern Alps (Ring et al., 1988). Table 2 summarizes the main tectonic units, their lithological formations and main bedrock types important for this research. Here, the “Lech-tal” nappe is fragmented into three slices; the “Augstenberg” slice, the “Ochsenkopf-Fundlkopf” slice and the “Heubuhl-Schonberg” slice (Allemann, 1985). In between these units the Penninic Arosa-Zone is discontinuously exposed. Tec-tonic shear zones mainly developed in the less resistant for-mations (Raibler and Arosa Forfor-mations) are more prone to mass movement processes. The Raibler Formation records shallow marine conditions, in which large amounts of an-hydrite and gypsum were deposited. These evaporitic rocks alternate with silicate, silt and mud layers (Helmcke, 1974). The overlying formation is the resistant “Hauptdolomit” For-mation and represents tidal flat deposits (Oberhauser, 1998). The Arosa Formations form a tectonic m´elange of various rock types, ranging from breccia to sandstone and marl (Ko-bel, 1969). The rocks of the Arosa Formations are often intermixed with materials coming from the Raibler Forma-tion. The Arlberg Formation is composed by a sequence of alternating light to dark grey, thickly layered and highly fractured limestone and thin marl beds. The Partnach For-mation is characterized by thinly layered clay- and siltstone. The Muschelkalk Formation is a resistant, dark grey, layered limestone and typically has open fractures.
2.3 Geomorphological landscape development
The actual landforms in the study area are the result of glacial, late-glacial and in particular postglacial processes.
188 A. C. Seijmonsbergen and L. W. S. de Graaff: GIS-supported mapping and evaluation of natural hazard
Table 2. Geological data of the study area (after Kobel, 1969, and Alleman, 1985).
Period Age Formation Dominant lithology Tectonic unit
Jurassic to Cretaceous
Dogger to Turonian
Aorsa Zone marl, sandstone,
conglomerate
Arosa nappe
Exposed at the base of the Lechtal nappe slices – served as d´ecollement zone
Triassic Norian Hauptdolomit Formation dolomite Lechtal nappe
three nappe slices: Augsten-berg, Ochsenkopf-Fundlkopf Heubuhl-Schonberg slice Carnian Raibler Formation anhydrite, gypsum,
rauhwacke, breccia, marl, sandstone Ladinian Arlberg Schichten limestone,
intercala-tion of marl Partnach Schichten limestone and marl
Anisian Muschelkalk limestone
E E E E E E E E E E E E Anthropogeneous Alluvial Karst Slope Glacial/subglacial University of Amsterdam
±
0 50 100 200 MetersCoarse fluvial deposits Scree deposits Debris flow deposits Solifluction deposits Rock fall blocks
Ablation till Cemented deposits Sinkholes Erosion solifluction niche Alluvial fan Slide, small, large
Fissure, small, large Spring, ponor Intermittent stream, Stream with waterfall and rapids, Old channel Lake, pond Steep cliff Legend 1 2 3 A B C D E Geomorphological Map
Malbun, Principality of Liechtenstein
Fig. 3. Geomorphological map Malbun, Principality of Liechtenstein.
The geomorphological map of the Schlucher catchment (Fig. 3) shows landforms and processes at the 1:3000 scale. The legend is a modified version of the legend developed for alpine areas by de Graaff et al. (1987) and Seijmonsbergen (1992). The scale of the map ensures that most geomorpho-logical features are represented without generalizations. For ease of reference the map is divided into squares A1–E3 with A1 in the NW and E3 in the SE corner (Fig. 3).
The area is dominated by both surface and deep seated mass movement. Therefore, few relicts of glacial landforms and deposits have been preserved. Only local ridges be-tween some sub-catchments (e.g. in square B2) and a series of moraine ridges in A3 have been preserved. These ridges document a late-glacial blockage of the Schlucher catchment by the larger Malbun glacier. This blockage caused a local rise of the erosion base. This resulted in the accumulation of
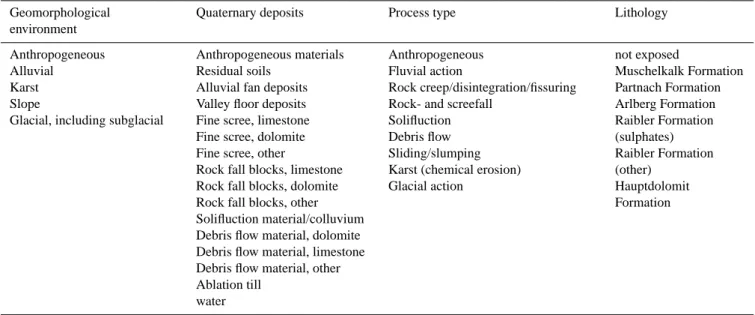
Table 3. The four attributes in the geomorphological table: geomorphological environment, Quaternary deposits, process type and lithology. This table only contains those attributes that are representative for this area.
Geomorphological environment
Quaternary deposits Process type Lithology
Anthropogeneous Alluvial
Karst Slope
Glacial, including subglacial
Anthropogeneous materials Residual soils
Alluvial fan deposits Valley floor deposits Fine scree, limestone Fine scree, dolomite Fine scree, other
Rock fall blocks, limestone Rock fall blocks, dolomite Rock fall blocks, other Solifluction material/colluvium Debris flow material, dolomite Debris flow material, limestone Debris flow material, other Ablation till
water
Anthropogeneous Fluvial action
Rock creep/disintegration/fissuring Rock- and screefall
Solifluction Debris flow Sliding/slumping Karst (chemical erosion) Glacial action not exposed Muschelkalk Formation Partnach Formation Arlberg Formation Raibler Formation (sulphates) Raibler Formation (other) Hauptdolomit Formation
low angle debris flow materials against the former ice mar-gin. The sediments have partly survived the postglacial ero-sion and are no longer areas of active debris flow.
The presence of gypsum and anhydrite leads to collapse karst and naked karst landforms. In a runoff and debris flow channel in square C2 a collapse depression was formed in 1999 (Fig. 3). These collapse depressions can substantially decrease the impact of debris flows, because they serve as debris traps and, therefore, reduce mass and momentum. An example of naked karst in sub-horizontal terrain is shown e.g. at the local water divide in square B1. Some of these sinkholes are elongated and aligned, and this suggests that they are related to faults or thrust zones in the Raibler For-mation.
In the central part of the Schlucher catchment a landslide underlain by gypsum is present (Wenzel, 1985). The outline of the central landslide is shown in Fig. 6. The back scar is lo-cated between 1850 and 1920 m, the side scars reach downs-lope to approximately 1800 m and expose heavily tectonized gypsum and anhydrite layers (Fig. 4). The lower end of the landslide is now situated at 1700 m altitude, which suggests a minimum displacement of 150 m. Rapid mass movements occur along the steep upper surrounding cliffs. Rock- and scree fall produces vast amounts of scree slopes which serve as source areas for debris flows, e.g. in square D1 (Fig. 3).
Fig. 4. Upslope view with the steep Hauptdolomite cliffs and as-sociated scree slopes in the upper left part. The central part of the photo shows the major scarp of the gypsum underlain landslide. In the foreground the eroded drainage system is shown.
3 Mapping and measurement methods
3.1 Mapping
The traditional symbol-based geomorphological map was prepared in the field using a topographical contour line map (original scale 1:10 000) and stereo infrared imagery (mean scale approximately 1:12 000) for both location and interpre-tation purposes. The resulting 1:3000 geomorphological map was scanned and georeferenced and used in all further GIS analyses and visualizations as a background image. In this
190 A. C. Seijmonsbergen and L. W. S. de Graaff: GIS-supported mapping and evaluation of natural hazard
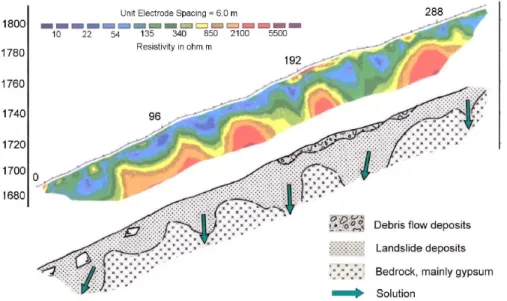
Fig. 5. Top: subsurface resistivity profile along the central landslide, for profile location see Fig. 7. The lower part shows a three layer geological interpretation of the resistivity profile.
way, the original landscape boundaries, the distribution of materials, processes and interpretation of genesis can still be consulted. The original symbol-based legend was translated into a vector-based GIS legend. The geomorphological ter-rain mapping units were digitized on screen by the geomor-phological expert, and contain information on process, form and materials. For each polygon the attribute table was filled in. Table 3 lists the information on the geomorphological environment, the quaternary deposits, the process type and the lithology. These attributes can be displayed as thematic maps by using transparent legend colours over the original geomorphological map (Figs. 3 and 6).
The hazard zonation map (Fig. 7) is prepared by select-ing those areas from the attribute table that are related to the actual process of debris flows and to those areas underlain by inactive debris flow source materials and deposits. In the field we noticed from local exposures that areas underlain by thick solifluction deposits often contain debris flow deposits. For this reason, areas underlain by solifluction deposits were also selected to define the hazard zone. The degree of hazard used is: low, medium or high. High activity refers to ar-eas with current debris flow activity. These arar-eas can ar-easily be distinguished from the ortho-photo because of their high reflectance, absence of vegetation and the non-weathered de-bris fragments in the field. Medium activity refers to areas showing distinct vegetation growth (grass, low shrubs), and a slightly raised position in the terrain. Low activity was as-signed to all other debris flow deposits and solifluction ar-eas. The latter may act as debris generating areas in the Schlucher catchment. In practice, minor manual additions and/or changes of the hazard zonation were made by the ex-pert during the process of preparation of the hazard zonation map.
3.2 Geophysical profiling and displacement measurements
The gypsum underlain landslide in the central part of the catchment was investigated in more detail. In 1983 a system of benchmarks was installed on and around the lower part of the central landslide. Since 1985 the horizontal and verti-cal displacements are recorded by the “Landesamt F¨ur Wald, Natur und Landschaft in Vaduz (de Graaff and
Seijmonsber-gen, 20001). In total 26 benchmarks were digitised and their
yearly movement rates were recorded in point attribute ta-bles. Fifteen benchmarks are located on the landslide of in-terest. In Fig. 6 the interpolated total horizontal displacement is shown. In ArcGIS the outline of the central landslide acted as a boundary mask for inverse distance weighting interpo-lation within the landslide. Two geo-electrical profiles with a length of respectively 330 m and 246 m were constructed over the crown of the landslide using a Sting-Swift earth re-sistivity meter. The aim of the geophysical profiling was to determine the depth of failure and to better understand the na-ture of the displacements. The distance between each of the 28 electrodes was 6 m, which allowed a penetration depth of 20–30 m. The resistivity values depend on the conductivity characteristics of the subsurface materials. Non-weathered bedrock has a relatively high resistivity, whereas disrupted anhydrite and gypsum rocks appeared to have low resistivity.
4 Results and interpretations
The location and relations between processes, material and form are derived from the geomorphological map (Fig. 3). The source area of the debris flow deposits are shown in the process attribute map (Fig. 6), which suggests that debris
E E E E E E E E E E E E 9 7 8 5 4 3 2 1 20 17 15 14 13 10 11 Geomorphological Processes Malbun, Principality of Liechtenstein
University of Amsterdam
±
0 40 80 160 Metersbenchmark
Geoelectric_profile Human activity
Fluvial action
Rock disintegration / fissuring Rock fall Solifluction Debris flows Sliding/slumping Karst (gypsum) Glacial deposition Total displacement (cm) High : 365.0 Low : 27.0 Legend processes 1 2 3 A B C D E
Fig. 6. Geomorphological processes Malbun, Principality of Liechtenstein.
E E E E E E E E E E E E Hazard zonation
Malbun, Principality of Liechtenstein University of Amsterdam
±
0 50 100 Meters Low hazard Medium hazard High hazardDebris flow hazard
A B
C D E
1
2
3
192 A. C. Seijmonsbergen and L. W. S. de Graaff: GIS-supported mapping and evaluation of natural hazard flows may still reach parts of Malbun village. The
occur-rence of surface collapse dolines, in active debris flow tracks, is evidence that these features may hamper sediment trans-port by debris flows. The two geo-electrical profiles showed similar resistivity patterns; hence, only one profile is given (Fig. 5). The location of the geo-electrical profile is shown in Fig. 6. A three layer model is proposed. Low values on the landslide are recorded to a depth of approximately 20 m. An undulating boundary shows the transition to high resistivity values. The low values correspond to the disin-tegrating materials of the landslide, which are derived from the Arosa Zone, and mainly from the Raibler Formation (an-hydrite and gypsum). The high values are characteristic for in situ bedrock values. The surrounding geomorphology, in which sink holes and collapse dolines are common features, strongly suggests that the undulating boundary is influenced by karst. The higher surface resistivity values near and up-slope from point 192 m coincide with a cover of debris flow material composed of coarse dolomite rock fragments on top of the landslide. These boundaries match the surface distri-bution of the debris flows as shown in Fig. 3.
In Fig. 6 the total displacements values over 15 years within the landslide indicate that the largest displacements occurred near the frontal section of the landslide. Bench-marks 5 and 11 have a vertical displacement of more than 3 m. This is related to local steeper slope gradients, which favours the development of tension cracks and sliding. This pattern can be attributed to fragmentation of the frontal slide masses into smaller slide units. After failure, these slides are too small to pose a serious threat to Malbun village. Bench-mark no. 17 is located on an individual rock fall block that has moved down slope, resulting in a local optimum in the displacement rate.
The hazard zonation map (Fig. 7) shows all areas that are potentially exposed to debris flows. The largest source area for active debris flows is in D1. Debris may travel north along the central landslide through the wooden channels; in a worst case scenario they may cover the debris fan in A/B2/3.
5 Conclusions and discussion
The combination of geomorphological analyses and visual-ization in GIS of the geo-electrical profiling and the bench-mark measurements has resulted in the following observa-tions:
– Debris flows still occur in the Schlucher catchment.
De-bris flows are still an important natural hazard and can pose a serious risk to Malbun village if no countermea-sures are taken.
– The central landslide does not pose a severe risk to
Mal-bun. Surface displacement rates indicate slow move-ments, and the geomorphological map shows that the landslide is disintegrating into minor slides. Therefore,
a major outbreak of material is unlikely, but small fail-ures can be expected.
– Karst is an active process that locally favours slope
in-stability. Locally, collapse dolines can reduce the im-pact of debris flows, by serving as sediment traps. Geomorphological information is integrated in hazard zona-tion studies since Kienholz (1977) used his geomorphologi-cal approach in hazard zonation. Our research presents dig-ital thematic maps prepared on the basis of a detailed geo-morphological map stored in a GIS. Our study emphasizes on detailed site specific observations, whereas many (semi) quantitative GIS and/or stability models emphasize on geo-statistical calculations (Moon et al., 2004; Ercanoglu et al., 2004; Corominas et al., 2004; Santacana et al., 2004). In both cases the results may provide emergency management plan-ners with estimates or approximations of the likely extent of features (Fabbri et al., 2003; Fernandez et al., 2003; Moon et al., 2004). Often this is insufficient because of missing input values or observations. The relation between terrain units is often ignored, in most cases because the total landscape is not mapped, but only the landslides themselves. This may result in under- or overestimating of the landslide suscepti-bility (Chau et al., 2003). This is particularly true for areas where the boundary conditions, such as the geological struc-ture and lithology, are highly complex and the scale needed for modelling is very detailed. A possible disadvantage is that the reproducibility of the “expert driven” method is not optimal, compared to other methods that implicitly use ex-pert knowledge (e.g. Corominas et al., 2003; Santacana et al., 2003). However, for detailed studies a balance has to be found between workability and suitability of the method.
One advantage of integrating the scanned symbol based geomorphological map into GIS is that it forms a background image and thereby remains a valuable source of information in interpreting geomorphological hazards. For example, the variability of material cover and process intensity, expressed by changing the density of symbols is still recognizable and increases the practical value of the various GIS layers. This means that the source of information upon which the deci-sions are made is visible to others. A further advantage is that the final maps do not rely only on instability features alone, but are based on a full representation of the landscape. A further strength of GIS is also that both quantitative and qualitative terrain parameters can easily be integrated.
Acknowledgements. We would like to thank J. Z¨urcher and
E. Banzer from the “Landesamt Fur Wald, Natur und Landschaft” in Vaduz, for kindly providing us with the colour infrared air-photos and the displacement data of the Schlucher catchment. Moreover, R. J. Sporry from ITC Delft, D. T. Biewinga and J. Rupke and are kindly acknowledged for their support in the geophysical survey. The students J. Timmers and T. Busnach from the Institute for Biodiversity and Ecosystem Dynamics (IBED) of the University of Amsterdam are thanked for their assistance with the geodetic and geo-electrical measurements. J. van Smaalen of the GIS-studio,
University of Amsterdam is thanked for his advice in the GIS data handling and visualization.
Edited by: F. Guzzetti
Reviewed by: M. Soldati and another referee
References
Allemann, F.: Geologische Karte des F¨urstentums Liechtenstein, Regierung des F¨urstentums Liechtenstein, Vaduz, 1985. Chau, K. T., Sze, Y. L., Fung, M. K., Wong, W. Y., Fong, E. L., and
Chan, L. C. P.: Landslide hazard analysis for Hong Kong using landslide inventory and GIS, Computers & Geosciences, 30(4), 429–443, 2003.
Corominas, J., Copons, R., Vilaplana, J. M., Altimir, J., and Amiga, J.: Integrated landslide susceptibility analysis and hazard assess-ment in the principality of Andorra, Nat. Hazards, 30(3), 421– 435, 2003.
Dai, F. C., Lee, C. F., and Ngai, Y. Y.: Landslide risk assessment and management: an overview, Engineering geology, 64, 65–87, 2002.
de Graaff, L. W. S., De Jong, M. G. G., Rupke, J., and Verhofstad, J.: A geomorphological mapping system at scale 1:10 000 for mountainous areas, Zeitschrift f¨ur Geomorphologie N.F., 31, 2, 229–242, 1987.
Dorren, L. K. A.: Mountain Geoecosystems. Gis modelling of rock-fall and protection forest structure, PHd Thesis, Universiteit van Amsterdam, 162 pp., 2002.
Ercanoglu, M., Gokceoglu, C., and van Asch, T. W. J.: Landslide susceptibility zoning north of Yenice (nw Turkey) by multivariate statistical techniques, Nat. Hazards, 32(1), 1–23, 2004.
Fabbri, A. G., Chung, C.-J. F., Cendrero, A., and Remondo, J.: Is prediction of landslides posible with a GIS?, Nat. Hazards, 30(3), 487–499, 2003.
Fernandez, T., Irigaray, C., el Hamdouni R., and Chacon, J.: Methodology for landslide susceptibility mapping by means of a GIS: application to the Contraviesa area (Granada, Spain), Nat. Hazards, 30(3), 297–308, 2003.
Garcia-M´elendez, I., Molina, I., Ferre-Julia, M., and Aguirre, J.: Multi-sensor data integration and GIS-analysis for natural hazard mapping in a semiarid area (southeast Spain), Adv. Space Res., 21(3), 493–499, 1998.
Gaspar, J. L., Goulart, C., Queiroz, G., Silveira, D., and Gomez, A.: Dynamic structure and data sets of a GIS database for geological risk analysis in the Azores volcanic islands, Nat. Hazards Earth Syst. Sci., 4, 233–242, 2004.
Guzzetti, F., Carrara, A., Cardinali, M., and Reichenbach, P.: Land-slide hazard evaluation: a review on current techniques and their application in a multi-scale study, central Italy, Geomorphology, 31, 181–216, 1999.
Guzzetti, F. and Tonelli, G.: Information system on hydrological and geomorphological catastrophes in Italy (SICI): a tool for managing landslide and flood hazards, Nat. Hazards Earth Syst. Sci., 4, 213–232, 2004.
Helmcke, D.: Geologie der s¨udliche Klostertaler Alpen (Vorarlberg, ¨
Osterreich), Geologica et Palaeontologica, 8, 131–147, 1974. Imeson, A. C. and Cammeraat, L. H.: Scaling up from field
mea-surements to large areas using the Desertification Response Unit and Indicator Approaches, in: Rangeland Desertification, edited by: Arnalds, O. and Archer, S., Dordrecht, Kluwer Academic Publishers, 1999.
Iqballudin, Saifuddin, Javed, A., and Moni, M.: Terrain mapping unit based approach for sustainable agricultural development in India – an example from plains ecosystem at semi-arid interface, J. Arid Environ., 42, 319–330, 1999.
Kienholz, H.: Kombinierte geomorphologische Gefahrenkarte 1:10 000 von Grindelwald, Geographica Bernesia G4, Geo-graphisches Institut der Universit¨at Bern, 204 pp., 1977. Kobel, M.: Erl¨auterungen zur Tektonik des R¨atikon, Jahresbericht
des Vorarlberger Landesmuseum Vereins, 145–260, 1969. Meyerink, A. M. J.: Data aquisition and data capture through terrain
mapping units, ITC Journal, 23–44, 1988.
Moon, V. and Blackstock, H.: A methodology for assessing land-slide hazard using deterministic stability models, Nat. Hazards, 32(1), 11–134, 2004.
Oberhauser, R.: Erl¨auterungen zur geologisch-tektonischen ¨
Ubersichtskarte von Vorarlberg 1:200 000, Geologische Bunde-sanstalt, Wien, 1998.
Rickli, C. and Banzer, E.: Gefahrenkartierung im F¨urstentum Liechtenstein, Interpraevent 1996, Tagungspublikation, vol. 3, p. 183–192, 1996.
Ring, U., Ratschbacher, L., and Frisch, W.: Plate-boundary kine-matics in the Alps: Motion in the Arosa suture zone, Geology, 16, 696–698, 1988.
Santacana, N., Baeza, B., Corominas, J., de Paz, A., and Marturia, J.: A GIS-based multivariate statistical analysis for shallow land-slide susceptibility mapping in La Pobla de Lillet area (Eastern Pyrenees, Spain), Nat. Hazards, 30(3), 281–295, 2003.
Seijmonsbergen, A. C.: Geomorphological evolution of an alpine area and its application to geotechnical and natural hazard ap-praisal, PHd thesis, University of Amsterdam, 109 pp., 1992. Soeters, R. and van Westen, C. J.: in: Landslides – investigations
and mitigation, edited by: Turner, A. K. and Schuster, R. L., Special report 247 – Transportation Research Board, National Academy Press, Washington D.C., 1996.
Suryana, N.: A geo-information theoretical approach to inductive erosion modeling based on terrain mapping units. PhD thesis, Landbouwuniversiteit Wageningen, The Netherlands, 234 pp, 1996.
van Westen, C. J., Rengers, N., and Terlien, M.: Prediction of the occurrence of slope instability phenomena through GIS-based hazard zonation, Geologische Rundschau, 86, 404–414, 1997. Varnes, D. J.: Landslide hazard zonation: a review of principles and
practice, Nat. Hazards, 3, UNESCO, 63 pp., 1984.
Wenzel, H.: Schucher – Gefahren und Sanierungsmassnahmen, Sonderdruck aus der Jahresschrift “Bergheimat” des Liechten-steiner Alpen Vereins, 19–34, 1985.