HAL Id: hal-00297071
https://hal.archives-ouvertes.fr/hal-00297071
Submitted on 2 Jan 2008
HAL is a multi-disciplinary open access
archive for the deposit and dissemination of
sci-entific research documents, whether they are
pub-lished or not. The documents may come from
teaching and research institutions in France or
abroad, or from public or private research centers.
L’archive ouverte pluridisciplinaire HAL, est
destinée au dépôt et à la diffusion de documents
scientifiques de niveau recherche, publiés ou non,
émanant des établissements d’enseignement et de
recherche français ou étrangers, des laboratoires
publics ou privés.
A complex geo-scientific strategy for landslide hazard
mitigation ? from airborne mapping to ground
monitoring
R. Supper, A. Römer, B. Jochum, G. Bieber, W. Jaritz
To cite this version:
R. Supper, A. Römer, B. Jochum, G. Bieber, W. Jaritz. A complex geo-scientific strategy for landslide
hazard mitigation ? from airborne mapping to ground monitoring. Advances in Geosciences, European
Geosciences Union, 2008, 14, pp.195-200. �hal-00297071�
www.adv-geosci.net/14/195/2008/ © Author(s) 2008. This work is licensed under a Creative Commons License.
Geosciences
A complex geo-scientific strategy for landslide hazard mitigation –
from airborne mapping to ground monitoring
R. Supper1, A. R¨omer1, B. Jochum1, G. Bieber1, and W. Jaritz2 1Geological Survey of Austria, Department of Geophysics, Austria 2Moser & Jaritz-ZT, Civil Engineering Company, Gmunden, Austria
Received: 13 June 2007 – Revised: 14 September 2007 – Accepted: 20 September 2007 – Published: 2 January 2008
Abstract. After a large landslide event in Sibratsgf¨all/Austria several exploration methods were evaluated on their applicability to investigate and monitor landslide areas. The resulting optimised strategy consists of the combined application of airborne electromagnet-ics, ground geoelectrical measurements and geoelectrical monitoring combined with hydrological and geological mapping and geotechnical modelling. Interdisciplinary communication and discussion was the primary key to assess this complicated hazard situation.
1 Introduction
Landslides are one of the major threats to human settlements and infrastructure, causing over time, enormous human suf-fering and property losses. Especially in alpine regions, pop-ulation pressure has prompted settlement to more extreme areas, which are, due to their geological settings, vulnera-ble to landslides. Therefore effort has to be centred on risk detection, risk reduction and development of timely warning systems to prevent future loss of life and property.
In spring 1999, after a short period of heavy precipita-tion and the rapid melting of snow, a catastrophic landslide was triggered on the South-flank of the Rubach Valley near Sibratsgf¨all in the province of Vorarlberg (Austria). Shortly after the first slide activity was observed, the State Depart-ment of Avalanche and Torrent Control authorized prelimi-nary geological investigations.
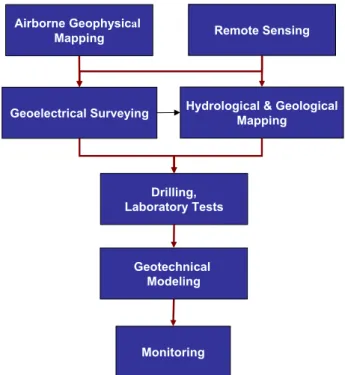
2 The strategy (Fig. 1)
As a follow up of this first phase of investigation, a complex research program was initiated. The final goal of this study
Correspondence to: R. Supper
(robert.supper@geologie.ac.at)
was to develop an operative strategy to optimise measures in case of future events. The applied methods incorporated geo-morphological, hydro-geological and geophysical surveys of the area. It was determined that airborne geophysical mea-surements are a valuable tool to obtain a quick overview of the geological situation. Furthermore they can help to de-tect areas susceptible to a high sliding risk, to assist the fol-low up geological and hydrological mapping program and to optimise further ground-geophysical surveys. In a sec-ond step, ground geoelectrical surveys were used to achieve advanced understanding of the internal structure of the land-slide. The location of survey lines was planned according to the resistivity pattern derived from the airborne electro-magnetic survey. Based on these findings and on the results of the geo-hydrological mapping program, boreholes were drilled to calibrate the geoelectrical results. Labaratory tests were performed on soil and rock samples to determine the geotechnical parameters the main subsurface units. Addi-tionally, geophysical and hydrophysical logging were carried out. Based on these results a geotechnical subsurface model was created and parameters and conditions of safety and fail-ure were calculated. Finally a multi parameter monitoring network was installed and has been operated since 2002. In this paper we focus on the geophysical aspects of the strat-egy.
2.1 The geological framework
The research area is entirely located within the “Feuerst¨atter Unit”, which is characterized by extensive rock disruption. The landslide area itself is mainly composed of rocks of the Junghansen and Schelpen series. These sub-units consist of marl and schist with highly variable stability as a result of tectonic fracturing. Due to their low resistance against weathering, rocks degrade under the influence of water into deeply weathered granular soils. Within these areas, all pri-mary scarps are located. The Junghansen and Schelpen series
196 R. Supper et al.: From airborne mapping to ground monitoring
Airborne Geophysical
Mapping Remote Sensing
Geoelectrical Surveying Hydrological & Geological Mapping Drilling, Laboratory Tests Geotechnical Modeling Monitoring
Fig. 1. Flow chart of the evaluated strategy.
are embedded into the more stabile Feuerst¨atter sandstones and limestones of the Aptychen series.
Figure 2 shows the results of the geological mapping of the landslide area (Jaritz et al., 2004) and surroundings. 2.2 The airborne geophysical survey
Soon after the landslide event, a high resolution, multi-parameter airborne survey was performed. The main part of the airborne system (Motschka, 2001) consisted of a GEOTECH-“Bird” of 5.6 m length and 140 kg weight. It was dragged on a tow cable 30 m below the helicopter. The fre-quency domain method works in such a way that a primary field induces currents in conductive underground structures. In turn the corresponding magnetic field induces a current in the receiver coils (secondary field). Variable frequencies and different geometric arrangements of the coils are being used to allow depth specific-sounding of the subsurface. The low-est frequency determines the maximum penetration depth of the method. Based on the amplitudes and the phases of the secondary fields, conclusions can be drawn on the electri-cal resistivity of the ground by applying delicate data inver-sion algorithms (Ahl, 20071; Avdeev, 2005; Seiberl et al., 1998; Sengpiel et al., 1998; Winkler et al., 2003). For the “Sibratsgf¨all” survey, electromagnetic alternating fields with frequencies of 3200 Hz (coaxial coil) and 7190 Hz (coplanar
1Ahl, A., Winkler, E., Bieber, G., and R¨omer, A.: Probabilistic
inversion of aeroelectromagnetic data with a homogeneous halfs-pace model, J. Appl. Geophys., under review, 2007.
Fig.2: Geological overview map of the landslide Rindberg
Profile MONITORING
Fig. 2. Geological overview map of the landslide Rindberg.
coil) were used, thus allowing investigation depths up to 70 m below ground surface. The electromagnetic bird was supple-mented by a laser altimeter, two differential GPS sensors, one of them located in the “bird” and the other one in the helicopter, a Cs-magnetometer, a gamma spectrometer and a passive microwave soil moisture sensor.
Out of the set of different airborne techniques, the elec-tromagnetic method was expected to deliver the most useful results for the investigation of landslide areas. This is due to the fact that with this method depth-specific sounding can be performed. Moreover the derived parameter, namely the electrical bulk resistivity of the subsurface, directly depends on fluid content, soil porosity and clay content. These param-eters describe indirectly the internal lithological composition of the landslide. Using the results of a two-layer inversion cross-correlated with remote sensing data (satellite images, ortho-photographs and digital terrain data from airborne laser scanning) and results from geological mapping, a conceptual model of the subsurface structure was derived.
Figure 3 shows the results of the inversion of the electro-magnetic data using a homogenous halfspace model (Ahl, 20071). This approach is very useful in providing a first overview over geological structures in a research area. The territory affected by movement of clay and marl material is clearly detectable in the central zone of the landslide, exhibit-ing medium to low resistivities (35–100 Ohmm). Sandstones (resistivity>175 Ohmm) of the Feuerst¨atter series, building up the unmoved frame of the landslide on the western side, can be delineated laterally with high resolution due to their contrast in resistivity to the surrounding materials. However, ground moraines, defining the south-western border of the landslide, and limestone material from the Aptychen series, dominating the north-eastern part of the landslide, show the same resistivity signature. Therefore they cannot be distin-guished from the sandstone using only electromagnetic re-sults.
Fig. 3: Results of the inversion of airborne electromagnetic mapping: homogenous Fig. 3. Results of the inversion of airborne electromagnetic map-ping: homogenous halfspace inversion – Parameter: Resistivity [Ohmm].
Fig. 4. Results of the inversion of airborne mapping: – Parameter: Gamma ray spectroscopy – Potassium [ppm].
Incorporating additionally results from the gamma ray mapping, particularly the potassium distribution (Fig. 4), a more accurate differentiation between Aptychen series (low potassium content) and sandstones (medium potassium val-ues) was possible.
It is remarkable that the distribution of maximum potas-sium content follows the main flow track of the landslide (Fig. 4). The reason for that is not obvious. This might be due to the fact that the top layers in the landslide material are mainly mixtures of marl and schist originating from Jung-hansen and Schelpen series, which show also high potassium contents at in-situ position. Destruction of the vegetation cover and dehiscing of the sward by high movement rates could be other causes.
Within a second processing step, the geoelectric results as well as information from core drillings were used to
con-Rock debris on Aptychen series (limestones, moved)
Sandstones of
Feuerstätter series Landslide material
(mud, debris & rocks)
Fig. 5. Results of the inversion of geoelectric multielectrode data: subsurface resistivity model for Profile GR-1.
Sandstones Ground moraine
Junghansen series (schist, marl)
Leimer series (?), marl Landslide material
(mud, debris & rocks)
Fig. 6. Results of the inversion of geoelectric multielectrode data: subsurface resistivity model for Profile GR-4.
? ? Ground moraine Junghansen series (schist, marl) Junghansen series (schist, marl), moved Mud and debris flow
Leimer series (?), marl
Fig. 7. Results of the inversion of geoelectric multielectrode data: subsurface resistivity model for Profile GR-5.
strain the inversion of the airborne electromagnetic data. This improved resistivity model was consequently used to refine the subsurface structural model, based on the complex interpretation of all available data.
Furthermore it has to be pointed out that all airborne geo-physical results had been very valuable for mapping geol-ogists as they helped to optimize the follow-up mapping procedures. Additionally it helped to minimize actual field work, which is often very difficult and time consuming in the rugged terrain of unstable slopes.
2.3 The ground geoelectrical surveys
Based on the preliminary subsurface resistivity model, a high resolution ground geoelectrical survey was planned. Several kilometers of multielectrode measurements on 29 profiles
198 R. Supper et al.: From airborne mapping to ground monitoring
Fig. 8. Location of Profile MONITORING, background: ortho-photography after landslide event light green rectangles: location of buildings before event.
were performed in the area of Rindberg and Sibratsgf¨all to determine the detailed subsurface structure of the sliding area. For calibration purpose, several boreholes were drilled along the geoelectric profiles and logged with induction and gamma probes. Some of them were equipped with incli-nometers in order to define the depth of slip surface. At the position of the geoelectrical monitoring profile (location see Fig. 2) hydrophysical logging (Pedler et al., 1992) was ad-ditionally performed to derive information on the variation of hydraulic conductivity with depth. Figures 5–7 show re-sults from the geoelectric inversion of multielectrode data on some selected profiles (GR-1, GR-4 and GR-5). The loca-tion of the profiles in relaloca-tion to geological units and airborne geophysical results can be identified in Figs. 2, 3 and 4.
Profile GR-1 is located near the top scarp of the landslide. The geoelectrical results (Fig. 5) give detailed information of the depth extent of the high resistive rock debris of Aptychen limestone composition. This material forms a compact plate of thicknesses up to 50 m, which is detached from in-situ po-sition. Due to its heavy weight, this block puts pressure on the subjacent soft clay and marl. In case of heavy rainfall the additional force of this load can increase pore water pressure within underlain clays and marls. Consequently the trigger-ing of movements can be supported. Therefore determination of size and depth extent of the detached limestone “block” was important to define the boundary conditions to quantify this effect using geotechnical modeling.
Figures 6 and 7 show the results on two parallel down-hill profiles, encountering very similar geological settings. Schist and marls of the Junghansen series (resistivities below 50 Ohmm) are overlain by moved material of the same geo-logical formation. This disturbed layer shows slightly higher
resistivity values (50–100 Ohmm) and obtains a maximum thickness of 30 to 40 m. Only on profile GR-5, the Jung-hansen series is covered by a mud and debris flow of variable thickness up to 40 m (resistivity of mudflow: 10–35 Ohmm; of debris flow 50–500 Ohmm, depending on the composi-tion).
The resistivity structure changes downslope completely. On profile GR-5 the mudslide has already eroded the base of the undercliffs, which is built up of ground moraines of sand-gravel composition. This situation is expressed in a low resistive top layer, followed by high resistive sequences. The depth of the moraines could not be determined due to insufficient penetration depth in the border area of the pro-file. Upslope of the moraines at depth, a different structure, showing resistivities between 35 and 50 Ohmm, could be hy-pothesized from the geoelectrical results. This unit could be interpreted as marls of the Leimer series, which can be found under in-situ position at the same altitude further to the west. The findings of the geoelectric survey significantly con-tributed to the setup of the subsurface structure used within the geotechnical model. Geotechnical parameters for each lithological formation were derived from laboratory tests on soil samples and cuttings from the core drillings.
2.4 The geotechnical model
Morphological mapping found out that, at time of the sur-vey, slip surfaces existed as well in the top mudflow as in the underlain mudslide material and moved Junghansen se-ries. It is remarkable, that, even though deep reaching move-ments had occurred upslope, the mudslide has so far eroded the base of the undercliff only at one location (at the base of profile GR-5). Therefore a stable counter bearing must ex-ist. Consequently, geotechnical modeling, based on the geo-electrical sections and geotechnical parameters, determined by laboratory test on rock samples, were carried out. These calculations showed that the quality of acting as abutment can neither be contributed to the ground moraines nor to un-moved marls of the Junghansen series. However, geotechni-cal probing of samples from a distant outcrop of Leimer marl suggested, that this series could overtake this role. Direct de-termination of the geotechnical parameters of the Leimer for-mation from in-situ position inside the landslide area would allow a more realistic modeling of future scenarios and to define pre-alarm conditions.
Continuative geotechnical calculations showed that soil water dynamics are the driving processes for triggering of movements on this landslide. Depending on different val-ues for pore water pressure and assumptions on the mostly unknown geotechnical parameters of the Leimer marls, dif-ferent scenarios of rock failure were obtained. The results ranged from very local, rotational sliding to the worse-case scenario of failure of the counter bearing, causing consequent damming of the river Ruhbach.
Debris flow material
Mudflow material
drilling
Junghansen series (schist, marl), moved
Fig. 9. Results of the inversion of geoelectric multielectrode data: subsurface resistivity model for Profile MONITORING.
The outcome underlined the importance of monitoring the subsurface water regime for risk estimation. Consequently, a multi-parameter monitoring system was designed, centered on the development of an innovative geoelectrical monitoring system.
2.5 The monitoring system
Due to the fact that triggering of movements on this land-slide is directly correlated with hydrological processes, geo-electrics seemed to be a promising method for monitoring of similar landslides. In 2001 no commercially available geoelectrical instrument met the requirements of high reso-lution monitoring (high resoreso-lution data, direct noise control, short acquisition time, permanent remote access and auto-matic data broadcasting). Therefore the Geological Survey of Austria (Supper et al., 2002, 2003 and 2004) designed a new, high speed geoelectrical data acquisition system, called GEOMON4D. A first prototype 2d system was installed at the landslide of Sibratsgf¨all in spring 2002 (see location map Fig. 8). This system has been in operation since Novem-ber 2002, measuring six complete sets of resistivity data, each compromising 3000 single measurements, and 24 self-potential data sets in gradient configuration each day. Since then, daily standard processing of actual data has been per-formed.
Figure 9 shows the result of one geoelectrical subsurface model obtained on the monitoring profile. The upper part is dominated by low resistive clays of the mudflow with embed-ded higher resistive debris flow components. Inclinometric measurements at the central drilling determined a well pro-nounced slip surface at a depth of 6 m (Fig. 10a), right below the embedded high resistivity body.
In 2003, the system was completely redesigned according to the experiences derived with the prototype. The instru-ment now offers a completely open architecture, allowing in-stallation of any number of current or potential electrodes by adding parallel or serial cards. Moreover GPRS (Gen-eral Packet Radio Service) data transfer was implemented. Therefore maintenance can be performed remote-controlled. Data (measurement results, test sequences and log files, con-taining information about system and GPRS connection
sta-A [cm] 5 4 3 2 1 0 -1 -2 -3 -4 T ie fe [ m N N ] 0 -2 -4 -6 -8 -10 -12 -14 -16 -18 -20 -22 -24 -26 -28 -30 -32 -34 2 6 .1 2 .2 0 0 2 2 4 .0 2 .2 0 0 3 2 5 .0 4 .2 0 0 3 2 4 .0 6 .2 0 0 3 2 3 .0 8 .2 0 0 3 2 2 .1 0 .2 0 0 3 2 1 .1 2 .2 0 0 3 1 9 .0 2 .2 0 0 4 2003 200 180 160 140 120 100 80 60 40 20 0 R e la ti ve h o ri zo n ta l mo ve m e n t [cm] ? ? GPS 141 GPS 142 GPS 140 GPS 139 D e p th [m ] Date
Fig. 10. Rates of movements on Profile MONITORING; (a) Incli-nometric data at the central drilling; (b) Relative horizontal move-ment rates determined for 2003 using high accuracy GPS position-ing. Re si st ivi ty [O h m m ] Date – Year 2003 MONITORING RINDBERG – Resistivity [Ohmm]
0.4 0.2 0 -0.2 -0.4 S el f P ot ent ia l [V ]
MONITORING RINDBERG – Self Potential [V]
Date – Year 2003
Effect of seasonal variation of temperature Anomaly due to movements
Fig. 11. Selection of monitoring results: (a) Self potential anomaly [V] – potential difference between electrodes at position 78 and 84 m (b) Resistivity [Ohmm] – current injection between position 48–72, potential measurement between 78–84 both parameters ver-sus time.
tus) are sent automatically every day via email to the data processing centre. Several software packages were devel-oped for selecting appropriate measurement configurations, remote controlled operation, data conversion and data anal-ysis. For the purpose of advanced interpretation, a special data base system was developed. One of the redesigned in-struments was installed additionally in 2005, operating an electrode spread with 40 electrodes at 2 m spacing along the same profile. This line was replaced in late 2006 by a line with 20 m of electrode spacing perpendicular to the original layout.
The geoelectrical system was complemented with three soil temperature and soil humidity sensors, rainfall, snow and drainage recording points. Additionally three drillings, equipped with inclinometers, allowed correlation of move-ment rates with geoelectrical anomalies. To determine val-ues of surface movements, high resolution geodetic surveys
200 R. Supper et al.: From airborne mapping to ground monitoring were performed almost every two weeks. Selected results
of self potential (Fig. 11a) as well as of resistivity time se-ries (Fig. 11b) clearly showed the existence of pronounced anomalies at times of movements of the landslide (Fig. 10), whereas during periods of slowdown, hardly any anomalous values were registered. Unfortunately, due to the lack of per-manent motion data, no direct correlation with triggering of movements could be derived.
3 Conclusions
Several methods were evaluated to design an improved in-terdisciplinary strategy for immediate measures to be ap-plied in case of future landslide events. The strategy al-lows to quickly assess the prevailing hazard situation and to develop and recommend effective mitigation measures. The resulting optimised approach consists of the application of airborne electromagnetics, ground geoelectrical measure-ments and geoelectrical monitoring combined with hydro-logical and geohydro-logical mapping and geotechnical modelling. Interdisciplinary communication and discussion was the pri-mary key to access the complicated hazard situation in the case of the large-scale landslide event evaluated at Rindberg. Acknowledgements. This study was financed by grants from
the State Department of Torrent and Avalanche Control (WLV), the Federal Ministry of Transport, Innovation and Technol-ogy (BMVIT), the Federal Ministry of Science and Research (BMWF), the State of Vorarlberg and internal research funds
of the Geological Survey of Austria. We further like to thank
G. W¨ohrer – WLV (logistical support), M. Mittelberger – Land Surveying Office Feldkirch (GPS) and R. Hofmann
(geotech-nical consulting) for fruitful cooperation. We are also grateful
to two anonymous reviewers for the through evaluation of the paper. Edited by: P. Fabian
Reviewed by: two anonymous referees
References
Avdeev, A.: Three dimensional electromagnetic modelling and in-version from theory to practice, Surv. Geophys., 26, 767–799, 2005.
Jaritz, W., Reiterer, A., and Supper, R.: Landslide Rindberg (Vo-rarlberg), Multidiscipline Research, Proceedings of the 10th In-terpraevent Congress, Riva del Garda, 2004.
Motschka, K.: Aerogeophysics in Austria, Bulletin of the Geologi-cal Survey of Japan, 52, 2/3, 83–88, Tsukuba, Japan, 2001. Pedler, W. H., Head, C. L., and Williams, L. L.: Hydrophysical
Log-ging: A New Wellbore Technology for Hydrogeologic and Con-taminant Characterization of Aquifers, Proceedings of National Groundwater Association 6th National Outdoor Action Confer-ence, 1701–1715, 1992.
Seiberl, W., Ahl, A., and Winkler, E.: Interpretation of airborne electromagnetic data with neural networks, Explor. Geophys., 29, 152–156, 1998.
Sengpiel, K. and Siemon B.: Examples of 1-D inversion of multi-frequency HEM data from 3-D resistivity distributions, Explor. Geophys., 29, 133–141, 1998.
Supper, R., R¨omer, A., and H¨ubl, G.: Development of a new, fast remote controlled 3D geoelectrical system for subsurface surveil-lance, Proceedings of the Environmental and Engineering Geo-physical Society, 8th Meeting Aveiro, Portugal, 2002.
Supper, R. and R¨omer, A.: New achievments in development of a high-speed geoelectrical monitoring system for landslide moni-toring, Proceedings of the Environmental and Engineering Geo-physical Society, 9th Meeting Prag, Prag, 2003.
Supper, R. and R¨omer, A.: New achievments in development of a high-speed geoelectrical monitoring system for landslide moni-toring (GEOMONITOR2D), Proceedings of the SAGEEP 2004 meeting, Colorado Springs, p. 556, 2004.
Winkler, E., Seiberl, W., and Ahl, A.: Interpretation Of Airborne Electromagnetic Data with Neural Networks, in: Geophysical Applications of Artificial Neural Networks and Fuzzy Logic, edited by: Sandham, W. and Leggett, M., Kluwer Academic Pub-lishers, 253–265, 2003.
![Fig. 3. Results of the inversion of airborne electromagnetic map- map-ping: homogenous halfspace inversion – Parameter: Resistivity [Ohmm].](https://thumb-eu.123doks.com/thumbv2/123doknet/14785418.598574/4.892.79.421.98.345/results-inversion-electromagnetic-homogenous-halfspace-inversion-parameter-resistivity.webp)


