HAL Id: hal-00295852
https://hal.archives-ouvertes.fr/hal-00295852
Submitted on 27 Feb 2006
HAL is a multi-disciplinary open access
archive for the deposit and dissemination of
sci-entific research documents, whether they are
pub-lished or not. The documents may come from
teaching and research institutions in France or
abroad, or from public or private research centers.
L’archive ouverte pluridisciplinaire HAL, est
destinée au dépôt et à la diffusion de documents
scientifiques de niveau recherche, publiés ou non,
émanant des établissements d’enseignement et de
recherche français ou étrangers, des laboratoires
publics ou privés.
tropical lower stratosphere
P. J. Popp, T. P. Marcy, E. J. Jensen, B. Kärcher, D. W. Fahey, R. S. Gao, T.
L. Thompson, K. H. Rosenlof, E. C. Richard, R. L. Herman, et al.
To cite this version:
P. J. Popp, T. P. Marcy, E. J. Jensen, B. Kärcher, D. W. Fahey, et al.. The observation of nitric
acid-containing particles in the tropical lower stratosphere. Atmospheric Chemistry and Physics, European
Geosciences Union, 2006, 6 (3), pp.601-611. �hal-00295852�
www.atmos-chem-phys.net/6/601/2006/ © Author(s) 2006. This work is licensed under a Creative Commons License.
Chemistry
and Physics
The observation of nitric acid-containing particles in the tropical
lower stratosphere
P. J. Popp1,2, T. P. Marcy1,2, E. J. Jensen3, B. K¨archer4, D. W. Fahey1, R. S. Gao1, T. L. Thompson1, K. H. Rosenlof1,
E. C. Richard1,2,*, R. L. Herman5, E. M. Weinstock6, J. B. Smith6, R. D. May7, H. V¨omel8, J. C. Wilson9,
A. J. Heymsfield10, M. J. Mahoney5, and A. M. Thompson11
1Chemical Sciences Division, Earth System Research Laboratory, National Oceanic and Atmospheric Administration, Boulder, CO 80305, USA
2Cooperative Institute for Research in Environmental Sciences, University of Colorado, Boulder, CO 80309, USA 3NASA Ames Research Center, Moffett Field, CA 94035, USA
4Institut f¨ur Physik der Atmosph¨are, Deutsches Zentrum f¨ur Luft- und Raumfahrt, Oberpfaffenhofen, Germany 5Jet Propulsion Laboratory, California Institute of Technology, Pasadena, CA 91109, USA
6Atmospheric Research Project, Harvard University, Cambridge, MA 02138, USA 7MayComm Instruments, San Dimas, CA 91773, USA
8Global Monitoring Division, Earth System Research Laboratory, National Oceanic and Atmospheric Administration, Boulder, CO 80305, USA
9Department of Engineering, University of Denver, Denver, CO 80208, USA
10Mesoscale and Microscale Meteorology Division, National Center for Atmospheric Research, Boulder, CO 80301, USA 11Department of Meteorology, Pennsylvania State University, University Park, PA 16802, USA
*now at: Laboratory for Atmospheric and Space Physics, University of Colorado, Boulder, CO 80303, USA Received: 9 August 2005 – Published in Atmos. Chem. Phys. Discuss.: 18 October 2005
Revised: 18 January 2006 – Accepted: 18 January 2006 – Published: 27 February 2006
Abstract. Airborne in situ measurements over the eastern Pacific Ocean in January 2004 have revealed a new category of nitric acid (HNO3)-containing particles in the tropical lower stratosphere. These particles are most likely composed of nitric acid trihydrate (NAT). They were intermittently ob-served in a narrow layer above the tropopause (18±0.1 km) and over a broad geographic extent (>1100 km). In contrast to the background liquid sulfate aerosol, these particles are solid, much larger (1.7–4.7 µm vs. 0.1 µm in diameter), and significantly less abundant (<10−4cm−3vs. 10 cm−3). Mi-crophysical trajectory models suggest that the NAT particles grow over a 6–14 day period in supersaturated air that re-mains close to the tropical tropopause and might be a com-mon feature in the tropics. The small number density of these particles implies a highly selective or slow nucleation pro-cess. Understanding the formation of solid NAT particles in the tropics could improve our understanding of stratospheric nucleation processes and, therefore, dehydration and denitri-fication.
Correspondence to: P. J. Popp
1 Introduction
The nucleation and growth of ice and other solid-phase par-ticles in the upper troposphere and lower stratosphere af-fect chemical composition and climate forcing (Baker, 1997; Lawrence et al., 1998; McFarquhar et al., 2000; Jensen and Pfister, 2004). Ice formation in the tropopause region reg-ulates stratospheric humidity through particle sedimentation and controls the radiative properties of high clouds (Jensen et al., 1996). Polar stratospheric clouds, when composed of NAT (HNO3·3H2O), sediment and denitrify the lower strato-sphere in winter and thereby enhance photochemical ozone destruction (Davies et al., 2005; Rex et al., 1997; Gao et al., 2001). Theoretical efforts have had limited success in iden-tifying and quaniden-tifying atmospheric nucleation processes, in part, because of incomplete knowledge of aerosol composi-tion and how composicomposi-tion affects nucleacomposi-tion. This in turn limits our current understanding of how global change might alter future cloudiness, stratospheric dehydration, and ozone amounts.
15
10
5
0
-5
Deg. Latitude
-95
-90
-85
-80
-75
Deg. Longitude
5
0
10
2km
X
Popp Fig. 1
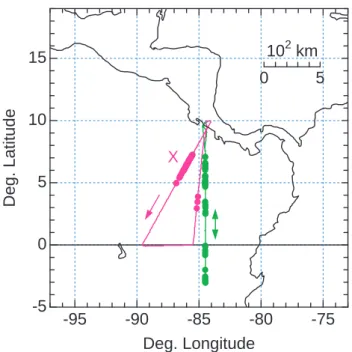
Fig. 1. Map of the WB-57F flight tracks on 27 (green) and 29 (pur-ple) January 2004. Observations of individual HNO3-containing particles are indicated by solid symbols laid over the flight tracks. Both flights originated and terminated in San Jose, Costa Rica (10◦N, 84◦W). The flight track segment on 29 January marked by “X” is the region of highest particle concentrations and corresponds to the purple bar in Fig. 2.
Observations of ambient aerosol from ground-based, air-borne, and space-borne platforms under a wide range of con-ditions are providing key guidance in completing our under-standing of microphysical processes. In situ observations made on airborne platforms are particularly effective because they offer high spatial resolution with quantitative detail, and as a consequence can be used to reveal features of atmo-spheric aerosol processes that would otherwise be inacces-sible. An important example of the guiding role of obser-vations is the discovery of large NAT particles in the Arctic winter stratosphere using airborne instruments (Fahey et al., 2001; Northway et al., 2002). Proof of their existence has led to a refined and more comprehensive view of how NAT particles denitrify the stratosphere and how atmospheric con-ditions can affect denitrification (Davies et al., 2005; Mann et al., 2003). However, the nucleation process for these large particles remains an unsolved microphysical puzzle.
Here we present evidence for a new category of NAT par-ticles that nucleate and grow in the tropical lower strato-sphere. The particles are only a small fraction of the am-bient aerosol population, and they grow under substantially different conditions than those found in polar regions. First, gas-phase HNO3values observed in the tropical lower strato-sphere were typically 0.1 ppbv or lower, which is 10 to 100 times less than that available for particle growth in the polar
stratosphere. As a result, the growth times of NAT parti-cles in the tropical lower stratosphere will generally be much longer than those of NAT particles in polar regions. Sec-ond, the particles grow at temperatures much closer to the frost point. In the tropics, NAT saturation conditions occur within +1.5 K of the frost point while the difference can ex-ceed +6 K in the polar lower stratosphere. Third, the new particles grow over considerable horizontal distances (up to 15 000 km) in a narrow altitude range (a few hundred meters) near the tropopause where NAT saturation conditions are fa-vorable. In polar regions, NAT growth can occur over a 5– 10 km vertical extent confined to the low temperature region of the polar vortex.
2 Particle detection
The tropical NAT particles were detected in situ with a chemical ionization mass spectrometer (CIMS) onboard the NASA WB-57F high-altitude research aircraft. The CIMS instrument measures HNO3 with two independent channels of detection connected to separate forward- and downward-facing inlets (Popp et al., 2004). The forward-downward-facing in-let samples both gas- and particle-phase HNO3. Particles are inertially stripped from the air stream sampled by the downward-facing inlet, effectively yielding a measure of only gas-phase HNO3. Thus, the difference in the signal be-tween the two channels allows a determination of the amount of HNO3 in the particle phase (Popp et al., 2004; Gao et al., 2004). When particle concentrations are low enough (<∼10−3cm−3), individual HNO3-containing particles can be detected as peaks above the background gas-phase value in the time series of HNO3measurements. The frequency of these peaks in the time series and the known particle spling volume of the CIMS instrument directly yield the am-bient particle concentration (Fahey et al., 2001).
HNO3-containing particles were observed on two flights over the eastern tropical Pacific Ocean in January 2004. The flights originated and ended in San Jose, Costa Rica, (10◦N) while reaching the Galapagos Islands (1◦S) or further south of the equator as shown in Fig. 1. Time series of observations and derived quantities for the flights are shown in Figs. 2 and 3. The most intense period of particle observations oc-curred on 29 January over a 300 km (30 min) flight segment (marked by X in Figs. 1 and 2). Individual HNO3-containing particles are identified in Fig. 2a as peaks throughout the seg-ment. The detection of several individual particles is shown in Fig. 2e. During the 30 min interval, a total of 59 particles were observed, yielding an average particle concentration of 6·10−5cm−3. Lower particle concentrations were observed for a short period later on the same flight and for several pe-riods during the flight on 27 January 2004 (Fig. 3). Overall, particles were found over a narrow range of flight altitudes (18±0.1 km) and temperatures (190±2 K), and intermittently over a broad geographic extent (1100 km) between 3◦S and
1 SNAT 150 100 50 0 RHi (%) 17:15 17:30 17:45 18:00 15 10 5 0 Water (ppmv) 200 190 180 Temp. (K) 18 16 14 Altitude (km) 0 2.0 3.0 Particle Dia. (µ m) 1.0 0.5 0.0 Sulfate (ppbm) 1.0 0.5 0 HNO 3 (ppbv) 800 600 400 200 0 Distance (km) HNO3 (forward) HNO3 (downward) Amb. Temp. Flight Alt. Trop. Height RHi Water Vapor SNAT Sulfate 1.0 0.5 0 HNO 3 (ppbv) 17:19:00 17:19:10 17:19:20 17:19:30 Universal Time 0 2.0 3.0 Particle Dia. (µ m) HNO3 (forward) HNO3 (downward)
Popp Fig. 2
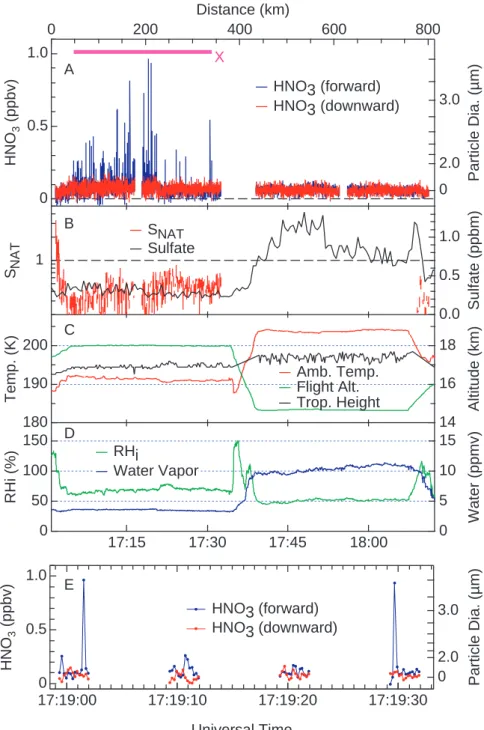
X D E C B AFig. 2. Time series measurements of the HNO3mixing ratios observed from the forward- and downward-facing CIMS channels (blue and red lines in (a), respectively) during the flight of 29 January 2004. The purple bar in (a) represents a 300 km flight segment in which HNO3 -containing particles were observed and corresponds to region X in Fig. 1. Also shown are calculated values of SNATand measured sulfate mass mixing ratios (panel (b)); ambient temperature, flight altitude and cold-point tropopause height (panel (c)); and measured water vapor and calculated values of relative humidity with respect to ice (RHi)(panel (d)). Panel (e) is a 35-s flight segment expanded from panel (a) that shows HNO3-containing particles as peaks in forward-facing CIMS channel (blue line) and the absence of peaks in the downward-facing CIMS channel (red line). The HNO3measurements are shown at 5 Hz in both (a) and (e). Assuming the HNO3-containing particles are composed of NAT, the spherical-equivalent diameter of the particles is D(µm)=6.0[µHNO3]1/3where µHNO3is the integrated HNO3 mixing ratio for an individual particle in ppbv·s. The calculated particle diameters are shown on the right axes in (a) and (e). The gap in the HNO3data at ∼17:16 UT in (a) represents a 60-s instrument background measurement. The gaps in the HNO3data in (e) occur when the instrument is monitoring the CIMS reagent ion, or the product ions used to measure hydrochloric acid (HCl) or chlorine nitrate (ClONO2). The HNO3product ion is monitored for 3 s out of every 10-s period, and derived particle concentrations account for this 30% duty cycle. Measurements other than HNO3shown in Fig. 2 are described in Appendix B.
1 10 SNAT 150 100 50 0 RHi (%) 17:00 17:30 18:00 18:30 Universal Time 15 10 5 0 Water (ppmv) 210 200 190 180 Temp. (K) 20 18 16 14 Altitude (km) 1 0 Sulfate (ppbm) 2.0 1.5 1.0 0.5 0 HNO 3 (ppbv) 0 2.0 3.0 4.0 Particle Dia. (µ m) HNO3 (forward) HNO3 (downward) Amb. Temp. Flight Alt. RH
i
Water Vapor SNAT SulfatePopp Fig. 3
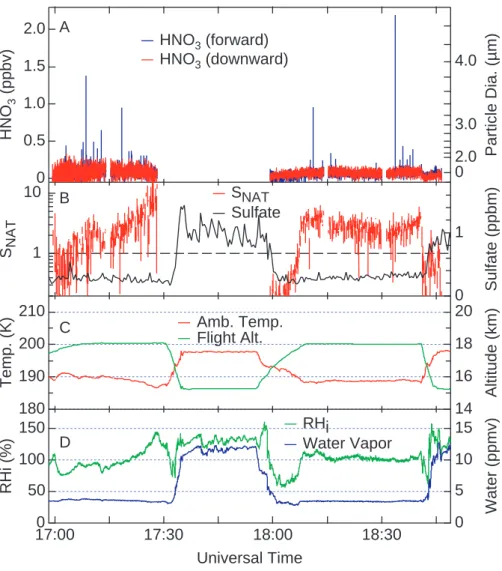
A B C DFig. 3. Time series measurements of HNO3mixing ratios observed from the forward- and downward-facing CIMS channels (blue and red lines in (a), respectively) on 27 January 2004. Also shown are calculated values of SNATand measured sulfate mass mixing ratios (panel (b)); ambient temperature and flight altitude (panel (c)); and measured water vapor and calculated values of relative humidity with respect to ice (RHi)(panel (d)). The HNO3measurements are shown at 5 Hz in (a). Tropopause height data was not available for this flight.
7◦N latitude. We note here that the particles were observed at the maximum flight altitude of the WB-57F (18 km), and it seems possible that the particles exist in a layer that extends to altitudes higher than 18 km. Microwave temperature pro-files show that the cold-point tropopause was typically 0.5 to 1 km below the observed particles (Fig. 2c). The two halves of the time series in Fig. 2 contrast the flight segment where particles are detected with one of similar length at lower al-titude. The latter shows no evidence of particles and further shows the agreement between the two CIMS detection chan-nels in the absence of HNO3-containing particles. Additional evidence for the presence of HNO3-containing particles on 29 January (Fig. 2) is provided by an automatic check of the background signal of the CIMS instrument. The background signal is checked at regular intervals during flight by adding a flow of dry nitrogen to the sample line 6 cm from the inlet opening. The nitrogen flow is large enough that a fraction
flows out of the inlet opening, thereby preventing ambient gases or small particles from entering the inlet (Neuman et al., 2000; Popp et al., 2004). This automatic check is the cause of the 1-min gap near 17:16 UT in the time series in Fig. 2. Peaks were not observed during this period, but were observed in each of several 1-min periods before and after the background check. This result is consistent with parti-cles entering the forward-facing inlet being the cause of the peaks found in the forward CIMS channel.
3 Particle composition and size
We assume the composition of the sampled particles to be NAT. NAT is the most stable HNO3 condensate at the ob-served levels of HNO3 and water vapor, and is known to form at low temperatures in the polar winter stratosphere (Voigt et al., 2000). The observed particles are unlikely to be
a supercooled ternary solution (STS) composed of H2SO4, HNO3, and water, or ice particles containing HNO3on the surface or in the bulk. Results from the Aerosol Inorganics Model (Carslaw et al., 1995) indicate that formation of STS via uptake of HNO3 by the background aerosol population is not thermodynamically favorable at temperatures greater than approximately 186 K with observed amounts of HNO3, sulfate, and water vapor. Furthermore, since there is no ther-modynamic nucleation barrier to the uptake of HNO3 by the background sulfate aerosol, all available aerosols would grow to form STS. The concentration of the resulting STS population, therefore, would be equivalent to that of the background sulfate aerosol (∼10 cm−3)and approximately 105times greater than the particle population reported here.
While cirrus ice particles have been observed to con-tain HNO3 in the upper troposphere and lower stratosphere (Kondo et al., 2003; Popp et al., 2004) the particles described in this study are unlikely to be composed of ice. Using HNO3 contents typical of those observed in subtropical cirrus cloud particles (Popp et al., 2004), ice particles would need to be at least 50 to 200 µm in diameter to produce an instrument response similar to that shown in Figs. 2 and 3. These ice particle sizes represent lower limits, since HNO3uptake by ice particles is proportional to the gas-phase partial pressure of HNO3. HNO3 partial pressures in the subtropical cir-rus clouds were 5–10 times greater than those observed in the tropical lower stratosphere during this study (Popp et al., 2004). The Video Image Particle Sampler (VIPS), which de-tects particles above ∼10 µm in diameter (Heymsfield and McFarquhar, 1996), observed no significant evidence for a population of large ice particles coincident with the CIMS particle observations. Furthermore, there was no observable ice water content in these air masses (<1 ppmv). Ice water content is measured as the difference between the total water and water vapor measurements onboard the aircraft (Wein-stock et al., 1994 and Appendix B).
We also note that the particles observed in this study are distinctly different from ultrathin tropical tropopause cloud (UTTC) particles first observed over the western Indian Ocean (Peter et al., 2003; Luo et al., 2003). While UTTC par-ticles are only slightly larger than the NAT parpar-ticles reported here (∼10 µm mode diameter), they are composed of ice, are more concentrated than the NAT particles by 2 to 3 orders of magnitude (∼10−2cm−1), and were observed below the cold-point tropopause exclusively. UTTCs are stabilized in a thin layer below the tropopause by an upwelling velocity that maintains supersaturation with respect to ice above the cloud and subsaturation below the cloud. This mechanism limits UTTC particle sizes to less than ∼50 µm in diameter. Adia-batic cooling events can destabilize the UTTCs by the forma-tion of larger particles that sediment from the cloud layer and evaporate. Thus, UTTC particles cannot grow large enough to contain HNO3amounts comparable to the NAT particles observed here.
With NAT composition assumed, calculated particle di-ameters are shown with the right hand axes in Figs. 2a and e. When all particles are examined from both flights, sizes range from 1.7 to 4.7 µm in diameter. There is essentially no size dependence in the particle number distribution. Particles substantially larger than 4.7 µm would be detected if present. The lowest observed size is set by the signal to noise ratio of the HNO3measurements. Although it is likely that some NAT particles are present with sizes less than 1.7 µm, it is un-likely that their concentration would be significantly greater than 6·10−5cm−3. If a considerable number of smaller par-ticles were present, they would deplete gas-phase HNO3and preclude the growth of the larger observed particles in a rea-sonable amount of time.
In previous studies in which the CIMS instrument detected HNO3-containing particles, independent observations of par-ticle size were available (Popp et al., 2004; Gao et al., 2004). During these studies, contrail particles with sizes of 1 to 3 µm diameter were found to contain HNO3. These earlier observations confirm that particles greater than ∼1 µm are inertially removed from the sample entering the downward-facing CIMS inlet. In the present study, this lower size limit is consistent with the absence of peaks in the downward-facing channel during periods when the forward-downward-facing chan-nel was detecting NAT particles with inferred sizes of 1.7– 4.7 µm.
It is worth noting here that the CIMS instrument is capa-ble of measuring hydrochloric acid (HCl) and chlorine nitrate (ClONO2)in addition to HNO3(Marcy et al., 2005). During flight, the CIMS instrument measures HNO3 for 3 s out of every 10-s period. The remaining 7 s are devoted to mea-suring HCl and ClONO2for 3 s each, and to monitoring the CIMS reagent ion for 1 s. Thus, HNO3, HCl and ClONO2are observed for an equal amount of time during flight, and par-ticles were sampled during the HCl and ClONO2 measure-ments modes at a rate equivalent to that during the HNO3 mode. No peaks in the HCl or ClONO2 time series were observed during the flights of 27 and 29 January 2004, indi-cating that neither species is present in the observed particles in amounts comparable to HNO3.
4 NAT saturation conditions
The formation of tropical NAT particles requires growth un-der NAT supersaturated conditions (SNAT>1, where SNATis the ratio of available HNO3 to the equilibrium value over an NAT surface) (Hanson and Mauersberger, 1988). Using observed HNO3, water vapor, and temperature values, only some of the particles reported here were found in NAT super-saturated air. For example, during the most intense sampling period (Fig. 2), conditions were subsaturated with respect to NAT. This is not unusual since HNO3-containing particles and ice have been extensively observed in subsaturated air masses (Northway et al., 2002; Str¨om et al., 2003). This
Particle. Obs. at 80±2 hPa
Popp Fig. 4
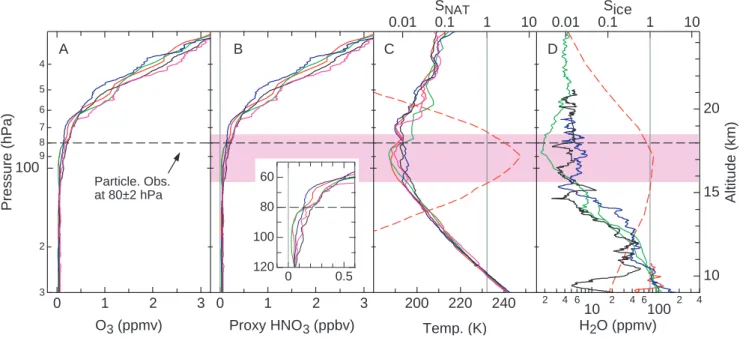
0.01 0.1 1 10 SNAT 0.01 0.1Sice 1 10 4 5 6 7 8 9 100 2 3 Pressure (hPa) 3 2 1 0 O3 (ppmv) 3 2 1 0 Proxy HNO3 (ppbv) 240 220 200 Temp. (K) 2 4 6 10 2 4 6100 2 4 H2O (ppmv) 20 15 10 Altitude (km) 120 100 80 60 0.5 0 A B C DFig. 4. Vertical profiles of ozone (O3)(a), proxy HNO3(b), temperature (c), and water vapor (H2O) (d) from balloon sonde measurements. Data in (a–c) were obtained on launches from San Crist´obal, Ecuador (1◦S, 90◦W) on 23 and 30 January 2003 and 30 January 2004 (red, green and blue lines) or Paramaribo, Suriname (6◦N, 55◦W) on 23 and 30 January 2003 (black and purple lines) from the Southern Hemisphere ADditional Ozonesonde (SHADOZ) network (Thompson et al., 2004). Data shown in (d) were obtained on launches from San Crist´obal on 29 and 30 January 2004 (red and green lines) or San Jose, Costa Rica (10◦N, 84◦W) on 27 and 29 January 2004 (blue and black lines). We note that the water vapor data measured from San Crist´obal (red and green lines in (d)) was measured using a frostpoint hygrometer, which typically reports values ∼30% lower than the in situ instruments onboard the WB-57F (Kley et al., 2000). Proxy HNO3 profiles were derived from O3values assuming a HNO3/O3ratio of 0.001. The purple region represents the altitude range in which NAT is stable (SNAT>1), calculated using the median values of HNO3, temperature and water vapor. The red dashed lines in (c) and (d) represent SNATand Siceprofiles, respectively, also calculated using the median values of HNO3, temperature and water vapor. The black dashed line indicates the pressure at which particles were observed on the WB-57F flights on 27 and 29 January 2004.
apparent inconsistency potentially can be explained in two ways. First, the sampled particles are not necessarily in equi-librium with observed ambient conditions. As conditions change from supersaturated to subsaturated, NAT particles will begin to reduce in size, but do so slowly. For example, a 3-µm particle requires 5–7 days to completely sublimate at temperatures 1–2 K greater than TNAT. Second, there is uncertainty in the observed parameters used in the NAT sat-uration calculation. HNO3vapor in equilibrium with NAT is reduced by half if the temperature is decreased by 1 K or if water vapor is increased by 20%. Uncertainties in the tem-perature, water, and HNO3 measurements, and the HNO3 -H2O phase diagram, are such that the uncertainty in calcu-lated SNATvalues includes unity throughout the highlighted region in Fig. 2.
In situ measurements of HNO3have not been reported pre-viously for the tropical upper troposphere or lower strato-sphere. As a consequence, in order to derive a representative vertical profile of NAT saturation conditions in the tropics, we use balloon sonde measurements of water and ozone and previous aircraft observations of the reactive nitrogen (NOy) to ozone ratio. HNO3generally accounts for up to 80% of the
NOyreservoir in the lower stratosphere and is a smaller frac-tion in the upper troposphere (Neuman et al., 2001). Mea-surements in and near the tropics show that the NOy/O3ratio varies between 0.001 and 0.003 in the lower stratosphere, with the lower values found throughout the inner tropics (Murphy et al., 1993). These ratios are consistent with a HNO3/O3ratio of 0.001 observed in the lower stratosphere between 1◦S and 7◦N during the WB-57F flight on 30 Jan-uary 2004. Proxy HNO3profiles for the tropical upper tro-posphere and lower stratosphere were calculated by scaling ozone profiles by 0.001. Representative ozone profiles were obtained from balloon sondes launched from San Crist´obal, Ecuador (1◦S) and Paramaribo, Suriname (6◦N) in January of 2003 and 2004. Similarly, ice stability is calculated from water vapor mixing ratios obtained from several balloon son-des that were coordinated with the aircraft flights. The pro-files for O3, proxy HNO3, temperature, water vapor, and the associated regions of NAT and ice saturation are shown in Fig. 4. The results in Fig. 4 indicate that a 3 km layer near the tropopause will be supersaturated with respect to NAT under typical conditions. Within the NAT layer, a narrower layer of ice saturation might also exist. These results suggest
that even with the low observed HNO3amounts, NAT par-ticles could be expected to routinely form near the tropical tropopause. The existence and width of this tropical layer is sensitive to HNO3and water vapor amounts, and tempera-ture, as noted in an earlier study (Hamill and Fiocco, 1988). The NAT-supersaturated layer is narrow because of the steep gradients in the controlling variables. Above the layer, in-creases in temperature dominate inin-creases in HNO3 in de-termining NAT saturation. Below the layer, the sharp fall in HNO3 amounts and increasing temperatures preclude NAT saturation.
5 Particle growth and trajectory calculations
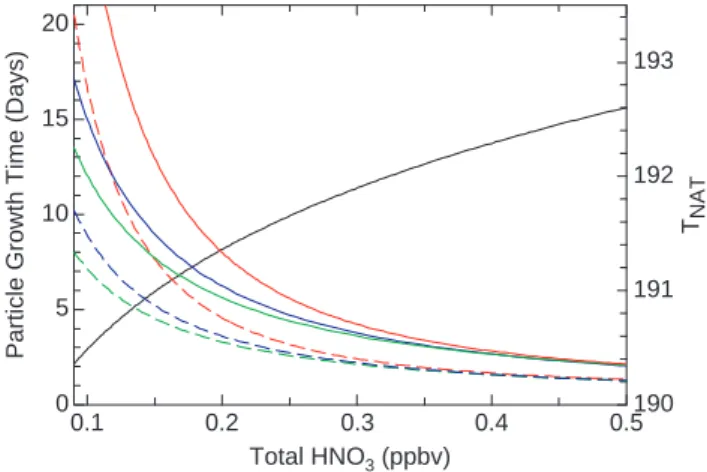
Particle growth under NAT saturation conditions is governed by gaseous diffusion, the HNO3deposition coefficient, and particle shape. With the assumption of static ambient condi-tions, calculations of the growth times for a 0.1 µm diameter particle in the background aerosol to become a 2 or 3 µm NAT particle are shown in Fig. 5. The growth model used here is described in Appendix A. For observed HNO3 val-ues near 0.1 ppb, growth times are in the range 8–17 days when the temperature is below the saturation point. The temperature and water vapor dependences (not shown) are not strong. For the largest particles, however, a doubling of HNO3approximately halves the growth time. Particle sedi-mentation rates, which vary strongly with size, are approxi-mately 13 m day−1and 80 m day−1 for 1 µm and 3 µm di-ameter particles, respectively, at observation altitudes. Thus, net displacements for the largest particles over a continuous growth period are only hundreds of meters, which is the ap-proximate depth of the typical NAT-stable layer above the particle observations (Fig. 4). It is worth noting here that a population of 3 µm NAT particles with a number density of 6·10−5cm−3 contains the gas-phase equivalent of 2 pptv HNO3 at 80 hPa. The nucleation and growth of such a di-lute population of particles, therefore, does not significantly deplete gas-phase HNO3.
Back-trajectory calculations provide strong evidence that suitable conditions existed for prolonged NAT growth. Tra-jectories initiated at all particle observation locations show that air parcels were continuously at low latitudes and low temperatures near the tropopause for at least 6–14 days prior to sampling. The trajectories, which include particle growth and sedimentation, are extended backwards in time until a particle reaches a size near 0.1 µm in order to locate the approximate nucleation location. A small upwelling veloc-ity (0.3 mm s−1) characteristic of the tropopause region is also imposed on the trajectories, which serves to lower the sedimentation rate of the particles during the growth period. For observations under NAT-supersaturated conditions on 27 January (Fig. 3), the particle trajectories show that particles nucleated at slightly higher altitudes between 6 and 14 days prior to sampling, and in some cases traveled over 15 000 km
193 192 191 190 TNAT 0.5 0.4 0.3 0.2 0.1 Total HNO3 (ppbv) 20 15 10 5 0
Particle Growth Time (Days)
Popp Fig. 5
Fig. 5. NAT particle growth times plotted as a function of available gas-phase HNO3using the model described in Appendix A. The calculations assume a pressure of 80 hPa and the observed water vapor mixing ratio of 3.4 ppmv. Green, blue and red lines represent growth times at 187, 188 and 189 K, respectively. The time repre-sents that needed for a 0.1 µm diameter particle to grow to a 2 µm (dashed line) or 3 µm (solid line) diameter NAT particle. The NAT saturation temperature is shown as the black solid line.
during this period (Figs. 6 and 7). This difference in tra-jectory length indicates that nucleation is not localized geo-graphically, for example, near a convectively active region. Particles that never reach the background particle size dur-ing the 15-day back trajectory encountered NAT subsatu-rated air, as indicated by the SNAT and particle diameter histories shown in Fig. 7. Since particle histories are cal-culated backwards in time, the particle size increases when SNAT>1. Hence, the back trajectory calculations cannot ex-plain the formation of these particles. Furthermore, the par-ticles observed on 29 January (Fig. 2) have back trajectories that leave the tropics after ∼6 days, somewhat before the par-ticles reach background sizes. In this case, the departure of the trajectories from the tropics after 6 days is uncertain be-cause the air is moving along an anticyclonic pathway from higher latitudes. The particles were located near the edge of the anticyclone, and the location of the anticyclone bound-ary in the analyses used for the trajectories is very uncer-tain. It is entirely plausible that the anticyclone was actually slightly further north, in which case the particles would have remained in the zonal westerly tropical flow.
6 Particle nucleation
The nucleation process for tropical NAT particles cannot be unambiguously identified. However, it is known that all available particles do not nucleate to form NAT, because the tropical NAT particles are collocated with a large population of background particles, assumed to be primarily composed of sulfate. This background aerosol, observed separately
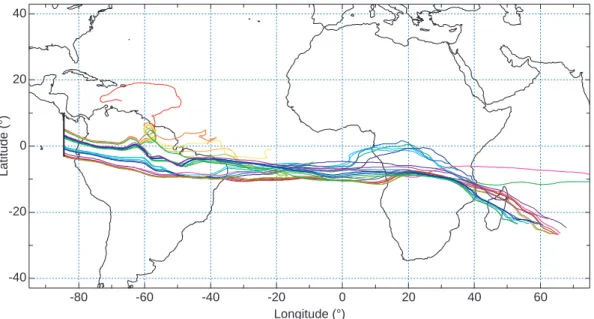
Popp Fig. 6
-40 -20 0 20 40 Latitude (°) -80 -60 -40 -20 0 20 40 60 Longitude (°)Fig. 6. Fifteen-day particle back trajectories for particles observed under NAT supersaturated conditions (SNAT>1) during the flight on 27 January 2004 (Fig. 3). On this day, the WB-57F aircraft flew out and back along a track due south from San Jose, Costa Rica. The flight track is shown in black. Individual trajectories are distinguished by color. Note that some particles travel more than 15 000 km between the time of observation in the tropical eastern Pacific Ocean and their point of origin in the Indian Ocean.
on both flights with an optical particle counter (Appendix B), show concentrations of about 10 cm−3and mode diame-ters near 0.1 µm, which are typical of the lower stratosphere (Brock et al., 1995). If tropical NAT particles nucleate on background sulfate particles, fewer than 1 in 105participate. This small fraction of NAT particles was also found in the Arctic winter vortex (Fahey et al., 2001). In this previous case, the nucleation process, which remains unsolved, might include seeding by a mother cloud, heterogeneous nucle-ation of sulfate or meteoritic material, and cosmic ray activity (Tabazadeh et al., 2001; Dhaniyala et al., 2002; Fueglistaler, 2002; Drdla et al., 2003; Voigt et al., 2005; Yu, 2004).
Nucleation of tropical NAT particles by a mother cloud seems highly unlikely because of the requirement for ice sat-uration conditions above the NAT growth region (Dhaniyala, 2002; Fueglistaler, 2002). However, nucleation could occur stochastically in a homogeneous process possibly aided by cosmic rays (Yu, 2004; Carslaw et al., 2002), or in a het-erogeneous process involving nuclei or inclusions of special composition (Bogdan et al., 2003; Drdla et al., 2003). A re-cent study of large NAT particles in polar regions concludes that nucleation on meteoritic inclusions offers the most plau-sible option (Voigt et al., 2005). Because meteoritic material is ubiquitous in the stratosphere (Cziczo et al., 2001), a sim-ilar nucleation process would be possible in the tropics.
What is known is that tropical NAT particles nucleate in air very similar in composition and recent history to the air in which they were observed. This follows simply from the knowledge that particles sediment small distances when sizes remain below a few µm in diameter and that particle
trajec-tories during growth necessarily remain close to the tropical tropopause in NAT supersaturated conditions. Thus, air sam-pled with the particles observed here likely also contained other examples of background particles that could nucleate NAT.
7 Implications
Several important implications follow from the observations of tropical NAT particles and inferred formation conditions. First, it seems reasonable to speculate that the tropical and polar NAT particles nucleate with a common process since low NAT particle concentrations are observed in both re-gions. This common process would likely involve a small number of special particles with the ability to nucleate NAT, or require that the homogeneous nucleation rate be slow enough to activate only a small fraction of the available sul-fate aerosol over the growth times allowed by tropical and polar trajectories. Thus, the definitive identification of the tropical NAT particle nucleation process is likely to further our understanding of particle nucleation processes in the po-lar regions.
Second, ice particles might form via a similar nucleation process and with the same nuclei as tropical NAT particles. Theoretically, there seems nothing to distinguish the micro-physics of NAT nucleation from that of ice that would sug-gest that NAT would form and not ice when both are super-saturated. For example, their respective saturation temper-atures typically differ by less than 2 K near the tropopause.
A dilute population of ice particles could grow and sediment near the tropical tropopause and, thereby, represent a new contributing pathway to stratospheric dehydration.
Third, the observations and trajectory analyses of tropi-cal NAT particles imply that these particles might be a com-mon feature of the tropical tropopause region. As a test, we used a forty-day back trajectory ensemble initiated glob-ally in the deep tropics in the 10 December 1995–20 Jan-uary 1996 period (Jensen and Pfister, 2004). Tropopause temperatures are lowest in northern hemisphere winter and, hence, most favorable for NAT formation. The analysis shows that 10% of air masses between 5◦S and 5◦N latitude and near the tropopause were supersaturated with respect to NAT (SNAT>1) for periods of at least 6 days or longer. Since 6 days is the approximate time required for particles to grow to detectable sizes under conditions reported here (Fig. 7), we estimate that approximately 10% of air masses in the deep tropics could contain NAT particles with the ob-served properties in the December/January period. We also note that this may be a conservative estimate, since particles were observed over an 1100 km region on 2 out of 3 south-bound flights from Costa Rica during this study.
Fourth, at the number concentrations and sizes observed, tropical NAT particles will not be observable in satellite ex-tinction measurements. Calculated exex-tinction values are near 1·10−6km−1at 525 nm, which is much less than the back-ground aerosol extinction and below reasonable detection thresholds for a thin aerosol layer near the tropopause. Pre-vious inferences of tropical NAT particles are based on much larger extinction values (>0.01 km−1)(Hervig and McHugh, 2002) that are not consistent with the low HNO3abundances observed in situ during this and previous studies (Jensen and Drdla, 2002).
Appendix A
Model to calculate NAT particle growth times
We use a standard diffusional growth law (Pruppacher and Klett, 1978) in the form
G ≡ ada dt = Mn ρ µ · κDnβn pn−pNAT kT , βn= 1 1 + 4κDn/(αuna) (A1) to calculate the time an ensemble of monodisperse particles composed of NAT needs to grow from an initial radius ai to a final radius af at a fixed temperature T , HNO3partial pressure pn, H2O partial pressure pw, and air pressure p of 80 hPa. In Fig. 5 we have assumed an H2O volume mixing ratio of 3.4 ppmv and vary the total HNO3concentration.
Here, t is the time, a is the particle radius, Mnis the mass of an HNO3molecule, ρ=1.62 g/cm3is the NAT mass den-sity, µ=(3Mw+Mn)/Mnis a flux correction factor with the
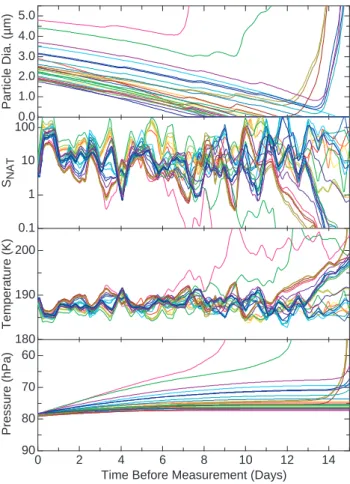
5.0 4.0 3.0 2.0 1.0 0.0 Particle Dia. (µ m) 14 12 10 8 6 4 2 0
Time Before Measurement (Days) 0.1 1 10 100 SNAT 200 190 180 Temperature (K) 90 80 70 60 Pressure (hPa)
Popp Fig. 7
Fig. 7. Particle size and growth conditions along fifteen-day back trajectories that were initiated at locations where particles were ob-served on the flight on 27 January 2004 (Fig. 3). Individual particles are distinguished by color coding according to the same scheme in Fig. 6. Throughout the trajectory period, the particles are growing (forward in time) because they largely remain in air that is supersat-urated with respect to NAT (SNAT>1). Temperatures of 190 K or less are characteristic of the tropical tropopause region. Increasing pressure values indicate that the particles are sedimenting as they grow.
mass Mw of an H2O molecule, κ=1.61 is the capacitance accounting for the non-spherical shape of NAT particles,
Dn(p, T )is the diffusion coefficient for HNO3molecules in air, βnis a correction factor accounting for gas kinetic effects that become important within about one molecular mean free path around the particle surface, pNAT(pw, T ) is the NAT saturation vapor pressure (Hanson and Mauersberger, 1988), and k is the Boltzmann constant. The factor µ takes into account that one impinging HNO3molecule is accompanied by three H2O molecules to form NAT at the particle surface, implying that H2O molecules equilibrate with the particles much quicker than HNO3due to their much higher gas phase abundance. In the expression for βn, α=1 is the deposition coefficient and unis the thermal speed of HNO3molecules.
The growth equation is solved explicitly according to
a(t + 1t ) =pa2(t ) +2G(t )1t (A2) using a time step 1t =30 s with a(t =0)=ai until af is reached. As only a small fraction of the HNO3 molecules is in the particle phase, significant depletion of the gas phase does not occur and pnapproximately equals the total HNO3 pressure.
Appendix B
Supporting measurements
Ambient temperature was derived using static pressure, pitot pressure, and total temperature observed with external air-craft probes. Water vapor was measured using an open-path laser light absorption method (May, 1998). Ice water content was derived from the difference between total water and wa-ter vapor, measured via Lyman-α fluorescence (Weinstock et al., 1994). Sulfate aerosol number density and size distribu-tions were measured using an optical particle counter (Wil-son et al., 1992). The vertical profile of temperature near the aircraft and tropopause height were derived using a pas-sive microwave temperature profiler (Denning et al., 1989). Water vapor profiles shown in Fig. 4 were measured using a tunable diode laser balloon sonde hygrometer (Hagan et al., 2004).
Acknowledgements. We appreciate the efforts of the NASA WB-57F air and ground crews, access to the SHADOZ dataset (http://croc.gsfc.nasa.gov/shadoz), and discussions with D. M. Mur-phy, Th. Peter, O. B. Toon, and C. Voigt. We also acknowledge J. C. Wilson for advice on the NOAA CIMS inlet design. The NASA Upper Atmosphere Research Program and the SCOUT-O3 project funded by the European Commission provided partial support of this research. Work performed by R. L. Herman and M. J. Mahoney at the Jet Propulsion Laboratory, California Institute of Technology, was done under contract with the National Aeronautics and Space Administration.
Edited by: R. MacKenzie
References
Baker, M. B.: Cloud microphysics and climate, Science, 276, 1072– 1078, 1997.
Bogdan, A., Kulmala, M., MacKenzie, A. R., et al.: Study of finely divided aqueous systems as an aid to understanding the formation mechanism of polar stratospheric clouds: Case of HNO3/H2O and H2SO4/H2O systems, J. Geophys. Res., 108(D10), 4303, doi:10.1029/2002JD002605, 2003.
Brock, C. S., Hamill, P., Wilson, J. C., et al.: Particle formation in the upper tropical troposphere – A source of nuclei for the stratospheric aerosol, Science, 270, 1650–1653, 1995.
Carslaw, K. S., Clegg, S. L., and Brimblecombe, P.: A thermody-namic model of the system HCl-HNO3-H2SO4-H2O, including solubilities of HBr, from <200 K to 328 K, J. Phys. Chem., 99, 11 557–11 574, 1995.
Carslaw, K. S., Harrison, R. G., and Kirkby, J.: Cosmic rays, clouds, and climate, Science, 298, 1732–1737, 2002.
Cziczo, D. J., Thomson, D. S., and Murphy, D. M.: Ablation, flux, and atmospheric implications of meteors inferred from strato-spheric aerosol, Science, 291, 1772–1775, 2001.
Davies, S., Mann, G. W., Carslaw, K. S., et al.: 3-D microphysical model studies of Arctic denitrification: Comparison with obser-vations, Atmos. Chem. Phys., 5, 3093–3109, 2005.
Denning, R. F., Guidero, S. L., Parks, G. S., et al.: Instrument de-scription of the airborne microwave temperature profiler, J. Geo-phys. Res., 94, 16 757–16 765, 1989.
Dhaniyala, S., McKinney, K. A., and Wennberg, P. O.: Lee-wave clouds and denitrification of the polar stratosphere, Geophys. Res. Lett., 29, 1322, doi:10.1029/2001GL013900, 2002. Drdla, K., Schoeberl, M. R., and Browell, E. V.: Microphysical
modeling of the 1999–2000 Arctic winter: 1. Polar stratospheric clouds, denitrification, and dehydration, J. Geophys. Res., 108, 8312, doi:10.1029/2001JD000782, 2003.
Fahey, D. W., Gao, R. S., Carslaw, K. S., et al.: The detection of large HNO3-containing particles in the winter arctic stratosphere, Science, 291, 1026–1031, 2001.
Fueglistaler, S.: NAT-rock formation by mother clouds: A micro-physical model study, Atmos. Chem. Phys., 2, 93–98, 2002. Gao, R. S., Richard, E. C., Popp, P. J., et al.: Observational evidence
for the role of denitrification in Arctic stratospheric ozone loss, Geophys. Res. Lett., 28, 2879–2882, 2001.
Gao, R. S., Popp, P. J., Fahey, D. W., et al.: Evidence that nitric acid increases relative humidity in low-temperature cirrus clouds, Science, 303, 516–520, 2004.
Hagan, D. E., Webster, C. R., Farmer, C. B., et al.: Validating AIRS upper atmosphere water vapor retrievals using aircraft and bal-loon in situ measurements, Geophys. Res. Lett., 31, L21103, doi:10.1029/2004GL020302, 2004.
Hamill, P. and Fiocco, G.: Nitric acid aerosols at the tropical tropopause, Geophys. Res. Lett., 15, 1189–1192, doi:10.1029/88GL03593, 1988.
Hanson, D. and Mauersberger, K.: Laboratory studies of the nitric-acid trihydrate – Implications for the south polar stratosphere, Geophys. Res. Lett., 15, 855–858, 1988.
Hervig, M. and McHugh, M.: Tropical nitric acid clouds, Geophys. Res. Lett., 29, 1125, doi:10.1029/2001GL014271, 2002. Heymsfield, A. J. and McFarquhar, G. M.: On the high albedos
of anvil cirrus in the tropical Pacific warm pool: Microphysical interpretations from CEPEX and from Kwajalein, Marshall Is-lands, J. Atmos. Sci., 53, 2424–2451, 1996.
Jensen, E. J., Toon, O. B., Pfister, L., and Selkirk, H. B.: Dehy-dration of the upper troposphere and lower stratosphere by sub-visible cirrus clouds near the tropical tropopause, Geophys. Res. Lett., 23, 825–828, doi:10.1029/96GL00722, 1996.
Jensen, E. J. and Drdla, K.: Nitric acid concentrations near the tropical tropopause: Implications for the properties of tropi-cal nitric acid trihydrate clouds, Geophys. Res. Lett., 29, 2001, doi:10.1029/2002GL015190, 2002.
Jensen, E. J. and Pfister, L.: Transport and freeze-drying in the tropical tropopause layer, J. Geophys. Res., 109, D02207,
doi:10.1029/2003JD004022, 2004.
Kley, D., Russell, J. M., and Phillips, C.: SPARC assessment of upper tropospheric and stratospheric water vapor, WCRP – No. 113, WMO/TD – No. 1043, SPARC Report No. 2, 2000. Kondo, Y., Toon, O. B., Irie, H., et al.: Uptake of reactive
nitrogen on cirrus cloud particles in the upper troposphere and lowermost stratosphere, Geophys. Res. Lett., 30, 1154, doi:10.1029/2002GL016539, 2003.
Lawrence, M. G. and Crutzen, P. J.: The impact of cloud particle gravitational settling on soluble trace gas distributions, Tellus, 50B, 263–289, 1998.
Luo, B. P., Peter, Th., Wernli, H., et al.: Ultrathin Tropical Tropopause Clouds (UTTCs): II. Stabilization mechanisms, At-mos. Chem. Phys., 3, 1093–1100, 2003.
Mann, G. W., Davies, S., Carslaw, K. S., and Chipperfield, M. P.: Factors controlling Arctic denitrification in cold winters of the 1990s, Atmos. Chem. Phys., 3, 403–416, 2003.
Marcy, T. P., Gao, R. S., Northway, M. J., et al.: Using chemical ionization mass spectrometry for detection of HNO2, HCl, and ClONO2in the atmosphere, Int. J. Mass Spectrom., 243, 63–70, 2005.
May, R. D.: Open-path, near-infrared tunable diode laser spectrom-eter for atmospheric measurements of H2O, J. Geophys. Res., 103, 19 161–19 172, 1998.
McFarquhar, G. M., Heymsfield, A. J., Spinhirne, J., and Hart, B.: Thin and subvisual tropopause tropical cirrus: Observations and radiative impacts, J. Atmos. Sci., 57, 1841–1853, 2000. Murphy, D. M., Fahey, D. W., Proffitt, M. H., et al.: Reactive
nitro-gen and its correlation with ozone in the lower stratosphere and upper troposphere, J. Geophys. Res., 98, 8751–8773, 1993. Neuman, J. A., Gao, R. S., Schein, M. E., et al.: A fast-response
chemical ionization mass spectrometer for in situ measurements of HNO3in the upper troposphere and lower stratosphere, Rev. Sci. Inst., 71, 3886–3894, 2000.
Neuman, J. A., Gao, R. S., Fahey, D. W., et al.: In situ measure-ments of HNO3, NOy, NO, and O3in the lower stratosphere and upper troposphere, Atmos. Environ., 35, 5789–57597, 2001. Northway, M. J., Gao, R. S., Popp, P. J., et al.: An analysis of
large HNO3-containing particles sampled in the Arctic strato-sphere during the winter of 1999/2000, J. Geophys. Res., 107, 8298, doi:10.1029/2001JD001079, 2002.
Peter, Th., Luo, B. P., Wirth, M., et al.: Ultrathin Tropical Tropopause Clouds (UTTCs): I. Cloud morphology and occur-rence, Atmos. Chem. Phys., 3, 1083–109, 2003.
Popp, P. J., Gao, R. S., Marcy, T. P., et al.: Nitric acid uptake on sub-tropical cirrus cloud particles, J. Geophys. Res., 109, D06302, doi:10.1029/2003JD004255, 2004.
Pruppacher, H. R. and Klett, J. D.: Microphysics of Clouds and Precipitation, Reidel Publishing Co., Holland, 1978.
Rex, M., Harris, N. R. P., von der Gathen, P., et al.: Prolonged stratospheric ozone loss in the 1885/96 Arctic winter, Nature, 389, 835–838, 1997.
Str¨om, J., Seifert, M., K¨archer, B., et al.: Cirrus cloud occurrence as function of ambient relative humidity: a comparison of ob-servations obtained during the INCA experiment, Atmos. Chem. Phys., 3, 1807–1816, 2003.
Tabazadeh, A.: Role of the stratospheric freezing belt in denitrifica-tion, Science, 291, 2591–2594, 2001.
Thompson, A. M., Witte, J. C., Oltmans, S. J., and Schmidlin, F. J.: SHADOZ (Southern Hemisphere ADditional OZonesondes): A tropical ozonesonde-radiosonde network for the atmospheric community, Bull. Am. Meteorol. Soc., 85, 1549–1564, 2004. Voigt, C., Schreincer, J., Kohlmann, A., et al.: Nitric acid trihydrate
(NAT) in polar stratospheric clouds, Science, 290, 1756–1758, 2000.
Voigt, C., Schlager, H., Luo, B. P., et al.: Nitric acid trihydrate (NAT) formation at low NAT supersaturations, Atmos. Chem. Phys., 5, 1371–1380, 2005.
Weinstock, E. M., Hintsa, E. J., Dessler, A. E., et al.: New fast-response photofragment fluorescence hygrometer for use on the NASA ER-2 and the Perseus remotely piloted aircraft, Rev. Sci. Instrum., 65, 3544–3554, 1994.
Wilson, J. C., Stolzenburg, M. R., Clark, W. E., et al.: Stratospheric sulfate aerosol in and near the northern hemisphere polar vor-tex: The morphology of the sulfate layer, multimodal size dis-tributions, and the effect of denitrification, J. Geophys. Res., 97, 7997–8013, 1992.
Yu, F.: Formation of large NAT particles and denitrification in po-lar stratosphere: Possible role of cosmic rays and effect of sopo-lar activity, Atmos. Chem. Phys., 4, 2273–2283, 2004.