HAL Id: insu-03066023
https://hal-insu.archives-ouvertes.fr/insu-03066023
Submitted on 15 Dec 2020
HAL is a multi-disciplinary open access
archive for the deposit and dissemination of
sci-entific research documents, whether they are
pub-lished or not. The documents may come from
teaching and research institutions in France or
abroad, or from public or private research centers.
L’archive ouverte pluridisciplinaire HAL, est
destinée au dépôt et à la diffusion de documents
scientifiques de niveau recherche, publiés ou non,
émanant des établissements d’enseignement et de
recherche français ou étrangers, des laboratoires
publics ou privés.
Fading magnetic anomalies, thermal structure and
earthquakes in the Japan Trench
Hanjin Choe, Jérôme Dyment
To cite this version:
Hanjin Choe, Jérôme Dyment. Fading magnetic anomalies, thermal structure and earthquakes in the
Japan Trench. Geology, Geological Society of America, 2020, 48 (3), pp.278-282. �10.1130/G46842.1�.
�insu-03066023�
Manuscript received 5 August 2019 Revised manuscript received 20 November 2019 Manuscript accepted 22 November 2019
https://doi.org/10.1130/G46842.1
© 2019 Geological Society of America. For permission to copy, contact editing@geosociety.org.
CITATION: Choe, H., and Dyment, J., 2020, Fading magnetic anomalies, thermal structure and earthquakes in the Japan Trench: Geology, v. 48, p. XXX–XXX, https://doi.org/10.1130/G46842.1
Fading magnetic anomalies, thermal structure and earthquakes
in the Japan Trench
Hanjin Choe* and Jerome Dyment
Université de Paris, Institut de physique du globe de Paris, CNRS, F-75005 Paris, France
ABSTRACT
Early magnetic studies of the Japan Trench showed that seafloor spreading magnetic anomalies progressively fade away and disappear during subduction, reflecting the increas-ing distance to magnetized sources and the removal of their remanent magnetization with alteration and increasing temperature. An improved magnetic anomaly map derived from both scalar and vector magnetic anomaly data, coupled with a better knowledge of the slab geometry in one hand, of the magnetic structure of the oceanic crust on the other hand, allow us to constrain the thermal structure of the subducting slab. We, for the first time, identify two steps in the anomaly disappearance: first the magnetization of extrusive basalt is rapidly erased between 9 and 12 km, where titanomagnetite reaches its blocking temperature between 150 °C and 350 °C, then the magnetization of deeper crustal layers slowly decreases down to ∼20 km, reflecting the progressive slab heating toward the Curie temperature of magnetite, 580 °C. The resulting slab temperatures are higher than predicted by most thermal models. Recent observations and models suggest rejuvenated hydrothermal activity triggered by lithospheric flexure before subduction that may significantly heat up the subducting oceanic crust through thermal blanketing and possibly serpentinization, with consequences on the depth of the seismogenic zone.
INTRODUCTION
Subduction is a major geodynamic pro-cess that leads to the consumption of oceanic lithosphere, the creation of volcanic arcs and the largest volcanic edifices on Earth, and the generation of natural disasters, such as earth-quakes and tsunamis, resulting in major dam-age and casualties. Many geophysical studies have been conducted over the Japan Trench to understand the structure of the subducting plate. Detailed slab geometry models Slab 1.0 and Slab 2 (Hayes et al., 2012, 2018) have been developed based on active seismic profiles and seismicity studies. Thermal structure models have been proposed based on heat flow sur-veys (Hyndman and Peacock, 2003; van Keken et al., 2012; Kawada et al., 2014; Wada et al., 2015). A pioneer study of magnetic anomalies on a subducting plate has shown that, from the Japan Trench landward, the magnetic anom-alies decrease in amplitude and their short wavelength content attenuates (Okubo et al., 1991), as a result of increasing distance be-tween the magnetized sources and the
observa-tion points, thermal demagnetizaobserva-tion, and con-tinuous oxidation of magnetic minerals within the extrusive oceanic crust (Okubo et al., 1991; Kido and Fujiwara, 2004). Today, the structure of the slab is well constrained (Hayes et al., 2012, 2018); moreover, the magnetic structure of the oceanic crust is better understood (e.g., Dyment and Arkani-Hamed, 1995; Gee and Kent, 2007).
Based on this existing information, the mag-netic anomalies over the Japan Trench offer an independent means to access to the slab ther-mal structure. To address this problem, we take advantage of a unique scalar and vector marine magnetic data set to build an improved high-resolution magnetic anomaly map. We identify two steps of thermal demagnetization, corre-sponding to the two major magnetic minerals of the oceanic crust layers, which constrain the thermal structure at shallow depths within the subduction system.
GEOLOGICAL SETTINGS OF NORTH-WEST PACIFIC
The oceanic crust in the northwestern Pacific plate off Japan was formed at ca. 125–140 Ma
at the Pacific-Izanagi plate boundary (Nakani-shi et al., 1989). The area is covered by pelagic sediments 1.6 km thick, and subducts beneath the Japan islands at a speed of 70–90 km/m.y. (Seno, 2017). A thicker and wider accretion-ary prism is observed in the northern Japan Trench (Kodaira et al., 2017). The free-air grav-ity anomaly locally delineates seamounts and
fracture zones (Fig. 1A). In the entire area, it
displays a negative anomaly associated with the trench and a positive anomaly on the flexural
bulge ∼150 km seaward. This bulge reflects the
bending of the subducting plate, and induces horsts and grabens as the plate approaches the trench (Tsuru et al., 2002; Kodaira et al., 2017).
DATA AND METHODS
We gathered two sets of marine magnetic data. Scalar magnetic data (i.e., total field vec-tor intensity) acquired by proton precession magnetometer (PPM) were obtained from the Data and Sample Research System for Whole Cruise Information (DARWIN) program of the Japan Agency for Marine-Earth Scienc-es (JAMSTEC) (http://www.godac.jamstec. go.jp/darwin/e), the Geophysical Data System (GEODAS, www.ngdc.noaa.gov/mgg/geodas) of the U.S. National Oceanic and Atmospheric Administration’s National Center for Envi-ronmental Information, and the Nautilus data base of the Institut Français de Recherche pour l’Exploitation de la MER (IFREMER, http:// donnees-campagnes.flotteoceanographique. fr). Vector magnetic data (i.e., total field vec-tor components) acquired by a shipboard three-component magnetometer (STCM), mostly on Japanese research vessels, were obtained from JAMSTEC (the DARWIN database). The Inter-national Geomagnetic Reference Field (IGRF) model (Thébault et al., 2015) was subtracted from the PPM data. The STCM data were cor-rected for the ship magnetic effect and motion using the method of Isezaki (1986). To mini-mize the misfit at cross-over points, a modified
*E-mail: choe@ipgp.fr
cross-over error analysis technique was applied, both to the PPM data and to the STCM data
(see the GSA Data Repository1). We reduced
the corrected magnetic anomaly grid to the pole
(RTP) assuming a 53.6° inclination and − 7.6°
declination (IGRF averaged over 20 years), 33° paleoinclination and 11° paleoazimuth (average value for the study area from the global grids of Dyment and Arkani-Hamed [1998]).
High-resolution bathymetric data were ob-tained from Global Multi-Resolution Topog-raphy (GMRT; Ryan et al., 2009). The top of the magnetic source, i.e., of the extrusive basalt layer, for the subducting plate was computed by merging and correcting different grids. The World sediment thickness grid (Divins, 2003) was subtracted from the bathymetry grid, and the resulting grid was merged with Slab 1.0 (Hayes. et al., 2012; for a discussion on the choice of the Slab 1.0 model, see the Data Re-pository) validated by published seismic profiles (e.g., Tsuru et al., 2002; Kodaira et al., 2017). The geometrical misfit between the two grids
along the trench boundary was erased and re-interpolated using the Partial Differential Equa-tion (PDE) surface method (D’Errico, 2005).
We carefully selected magnetic anomalies showing no tectonic or volcanic local complexi-ties, such as fracture zones, propagators, or sea-mounts. Anomalies older than M10r (130.8 Ma) and younger than M8 (129.0 Ma) are therefore discarded (Fig. 1). We extracted profiles from the magnetic grid across the selected anomalies and considered separately the anomaly profiles before and after subduction; i.e., located east and west of the Japan Trench. The anomaly profiles be-fore subduction were inverted to equivalent mag-netization assuming a 500-m-thick magnetized source layer with no vertical variation of magneti-zation (Parker and Huestis, 1974). The equivalent magnetization shows little variation among
pro-files and has been averaged (Fig. 2A). We use this
average equivalent magnetization and the inferred top of the magnetic source layer along the anom-aly profiles after subduction (Fig. 2B) to compute synthetic magnetic anomalies along these profiles (Fig. 2C). These modeled anomalies represent the contribution of the subducting plate at the sea surface if the magnetic structure of the plate remains unchanged. Comparison of these syn-thetic anomalies with the observed ones gives us the opportunity to estimate how the magnetic structure of the plate has been changed (Fig. 2C).
The ratio of peak to trough anomaly ampli-tudes of the observed and synthetic anomalies,
hereafter named RAM (Remaining Amount of Magnetization), provides an estimate of the re-maining fraction of magnetization in the sub-ducting plate: when it is close to 1, demagnetiza-tion remains negligible, whereas when it tends to 0, demagnetization is almost complete. We expect demagnetization to progress as a func-tion of depth, and display RAM as a funcfunc-tion of the depth to the top of the magnetized layer under the maximum (respectively minimum) of the observed positive (respectively negative)
anomalies (Fig. 3).
A NEW MAGNETIC ANOMALY MAP OF THE JAPAN TRENCH AREA
We compiled both scalar and vector marine magnetic data available in the study area and merged them into a unique scalar magnetic anomaly map (Fig. 1B). Many gaps in the scalar anomaly coverage could be filled with the vec-tor data. The resulting map shows two types of anomalies. Near the Japanese Islands, a strong positive anomaly (FIMAB in Fig. 1) is caused by the induced magnetization of serpentinite in the forearc mantle (Okubo and Matsunaga, 1994; Blakely et al., 2005) and, possibly, of the volcanic arc. On the Pacific plate and subducting slab, alternating positive and negative lineated anomalies are caused by the remanent magne-tization of the oceanic crust. Magnetic anoma-lies M5 to M17 (ca. 124.6–139.7 Ma; Malin-verno et al., 2012) are identified between two 1GSA Data Repository item 2020076,
supplemen-tary information on the method, and discussions of (1) Crossover correction for scalar and vector magnetic anomalies, (2) uncertainties in the slab geometry, and (3) the effect of a dipping slab on the inclination and declination of magnetization, is available online at http://www.geosociety.org/datarepository/2020/, or on request from editing@geosociety.org.
A
B
C
Figure 1. (A) Free-air gravity anomaly map (Sandwell et al., 2014) offshore northeastern Japan. (B) Magnetic anomaly map offshore northeastern Japan. (C) Magnetic anomaly map after reduction to the pole (RTP) in the detailed area of investigation outlined in B. White circles indicate earthquake epicenters (1970–2018 CE) obtained from the Global CMT database (Dziewonski et al., 1981). Contours in the maps indicate the slab geometry at 5 km depth interval (Hayes et al., 2012). The magnetic anomalies on the oceanic plate align along a regular ENE-WSW direc-tion, only disrupted by propagators (red lines) and fracture zones (black solid lines). Gray-shaded numbered blocks mark the normal polarity intervals. Magnetic anomalies start to fade at the trench (white line) and disappear at ∼20 km depth. The Japanese Islands are shown in black, and the oceanward limit of the forearc induced magnetic anomaly belt (FIMAB) by a thick dashed line in A and B. Color boxes in C indicate the magnetic anomalies suitable for this study. The earthquakes plotted in Figure 3B lie within the white dashed box.
NNW-SSE–trending fracture zones depicted on the free-air gravity anomaly (Fig. 1A), confirm-ing the interpretation of Nakanishi et al. (1989). In our study area, only anomalies M8r–M10r (129.0–130.8 Ma) are suitable for a detailed analysis, as they are linear and only disrupted by a few isolated seamounts. They display a clear seafloor-spreading magnetic signal be-fore and after subduction (Fig. 1A). Converse-ly, anomaly M5 is still recognizable but totally subducted, while anomalies M6–M7 are only partially subducted beneath the southern Ku-ril Trench, roughly parallel to the magnetic anomaly trend. The presence of propagating rifts (Nakanishi, 2011) and the Joban seamount chain affect anomalies M10n1–M15 south of 38°40′N. During this period, the (half) spreading rate was 70–80 km/m.y. and the studied oceanic crust was formed at a fast spreading center (Na-kanishi et al., 1989).
MAGNETIC STRUCTURE OF THE OCEANIC CRUST AND PROGRESSIVE DEMAGNETIZATION
The amplitude of the slab magnetic anoma-lies continuously decreases landward, and the anomalies disappear beyond 20 km depth below
sea level (bsl) (Fig. 1C). The increasing depth of the magnetized source preferentially attenuates shorter anomaly wavelengths, as does demag-netization of the oceanic crust induced by fluids (alteration) and increasing temperature (thermal demagnetization). To separate the effects of in-creasing depth and demagnetization, we com-pute synthetic magnetic anomalies assuming an unchanged magnetic structure of the subducting plate. The observed anomalies decrease faster than the synthetic ones (Fig. 2C). Indeed, the RAM decays rapidly, by 20% per km, between 9 and 12 km bsl, and more slowly, by 2% per km, beyond (Fig. 3A).
The observation of two distinct depth in-tervals with contrasted RAM decay is in good agreement with our knowledge of the magnetic structure model of oceanic crust formed at fast spreading centers, where two magnetic layers are distinguished (Dyment and Arkani-Hamed, 1995). The shallower one, <1 km thick (e.g., Karson, 2002), is made of extrusive basalt of which the magnetic mineral is titanomagnetite with various Ti content and oxidation state (Cu-rie temperature Tc of 100–350 °C; Zhou et al.,
2001). The deeper one, ∼5 km thick, is made of
dolerite, gabbro, and serpentinized peridotite in
which magnetite (Tc 580 °C) is the dominant magnetic phase. The natural remanent magneti-zation (NRM) carried by these layers varies: the
extrusive layer bears a strong NRM (>10 A/m) at
the ridge axis, which decays to ∼3 A/m for old oceanic crust. It is the main contributor to the lineated marine magnetic anomalies observed at the sea surface. Conversely, the dolerite and gabbro bear a weaker NRM (∼1–1.5 A/m) and the serpentinized peridotite has a variable NRM (0–6 A/m) depending the degree of serpentini-zation (Harrison, 1987). We, therefore, suggest that the sudden decay of RAM between 9 and 12 km bsl corresponds to the thermal demagneti-zation of the extrusive basalt layer, and the slow decrease beyond 12 km bsl to that of the deeper layers (Fig. 3B). Observed magnetic anomalies beyond 18 km bsl are very low and their shape does not match that of the synthetic ones, pre-cluding the calculation of RAM. Their short wavelength content is not consistent with the expected depth of subducting slab, suggesting the presence of shallower sources in the upper plate continental crust.
THERMAL STRUCTURE AND EARTHQUAKES IN THE SHALLOW SUBDUCTING OCEANIC CRUST
A global compilation over subduction zones suggests that, apart from local effects, heat flow over oceanic lithosphere entering subduction does not significantly deviate from that of nor-mal oceanic lithosphere (Stein, 2003), whereas a more recent study supports higher heat flow over oceanic lithosphere approaching subduc-tion (Harris et al., 2017). Conversely, heat flow over the forearc basin is generally low (Stein, 2003; Yamano et al., 2014). Heat flow measure-ments on the Pacific plate off the Japan Trench
range between 50 and 100 mW/m2, significantly
higher than the ∼50 mW/m2 expected for
ocean-ic lithosphere of this age (Yamano et al., 2014). Estimating the slab thermal structure is dif-ficult because the hydrothermal circulation in the accretionary prism and overriding continen-tal crust is hard to quantify. Proposed models consider constraints such as the age of oceanic lithosphere, rate of convergence, shear heating, and dip of the slab (van Keken et al., 2012; Wada et al., 2015). However, strong uncertainties re-main in the shallow subduction zones on the effectiveness of hydrothermal circulation, the permeability of the igneous crust, and its evolu-tion with depth. Consequently, models propose a wide variety of temperature ranges for the shal-low subducting slab. For instance, the obtained temperatures are as low as ∼100–200 °C from the deformation front to 20 km depth (Hynd-man and Peacock, 2003; van Keken et al., 2012; Wada et al., 2015), a consequence of the rapid convergence of old oceanic crust (van Keken et al., 2012). Our study suggests that the Tc of titanomagnetite, within the range 150–350 °C, is
A
B
C
Figure 2. (A) Equivalent magnetization inverted from profiles across magnetic anomaly M10n before subduction (for location, see Figure 1C, black dashed lines in orange box). Red dotted curve indicates the average equivalent magnetization adopted for further modeling. (B) Three-dimensional view of the source layer and magnetization intensity (color) used to model the synthetic magnetic anomalies. Black solid lines on top indicate location of the profiles (for location, see Figure 1C, black solid lines in orange box). Blue solid line on top is the Japan Trench. (C) Three-dimensional view of the observed (black) and synthetic (red) magnetic anomalies across magnetic anomaly M10n after subduction (location as above). Comparison of the observed and synthetic anomalies show that demagnetization is required to explain the difference of anomaly amplitudes west of 144°E.
reached by the extrusive basalt layer at 9–12 km bsl, and the Tc of magnetite, 580 °C, is reached by the deeper crustal layers when the slab
sur-face is at 20 km bsl (i.e., at ∼22–26 km bsl,
con-sidering the initial depth of these layers). These temperatures are significantly higher than those predicted by most published models. They agree better with the background thermal gradient of 26.29° ± 0.13 °C/km measured on the overriding plate near the trench (Fulton et al., 2013), which predicts 170 °C at 10 km bsl (6.5 km below sea-floor) and 460 °C at 20 km bsl (17.5 km bsf).
A recent study explains the high heat flow before subduction by rejuvenated hydrother-mal activity induced by the flexural bending of the lithosphere and associated normal faults (Kawada et al., 2014). After entering subduc-tion, the convecting fluid mines heat from depth but is prevented to transfer this heat upward by the thick sediments of the accretionary prism, the subducted pelagic sediments, and possibly an impermeable décollement surface, warming up the subducting oceanic crust through thermal blanketing (e.g., Granot and Dyment, 2019). Ad-ditional heat may be provided by serpentinization, i.e., the hydration of mantle rocks by the perco-lating fluid, an exothermic transformation most active between 100 and 400 °C (Macdonald and Fyfe, 1985) reported in various active tectonic contexts involving the oceanic crust—slow sea-floor spreading (Kelley et al., 2001), compres-sive deformation (Delescluse and Chamot-Rooke, 2008), and subduction (Grevemeyer et al., 2018). Conversely, the frictional heat generated by recur-ring megathrust earthquakes, although reaching high temperatures (Yang et al., 2016) for a short time at a very local scale, remains negligible if the estimate of Fulton et al. (2013) is considered.
A warmer subducting oceanic crust has im-plications on the rheology of the subducting slab. The brittle-ductile transition in basalt
oc-curs at 550 ± 100 °C (e.g., Violay et al., 2012).
If our inference on the Curie temperatures are
correct, this depth is reached at ∼20 km,
ex-plaining why most earthquakes of magnitudes
stronger than 5 are observed at depths <20 km,
as Figure 3C suggests, despite the poor vertical resolution of epicenter determinations. ACKNOWLEDGMENTS
We thank Jeff Gee, Ingo Grevemeyer, and an anony-mous reviewer for their helpful comments. We also thank Koichiro Obana for providing precise earthquake catalogs even though we could not use them due to their limitation in deeper areas. Choe has been supported by an Ecole Doctorale STEP’UP Fellowship. We thank all scientists and crews who collected the marine geophys-ical data used in this study. This is Institut de Physique du Globe de Paris contribution 4089.
REFERENCES CITED
Blakely, R.J., Brocher, T.M., and Wells, R.E., 2005, Subduction-zone magnetic anomalies and implica-tions for hydrated forearc mantle: Geology, v. 33, p. 445–448, https://doi .org/10.1130/G21447.1.
0 10 20
Magnetization (A/m) Magnitude (Mw) Overriding continental crust Frontal prism
5.0-5.4 5.5-6.0 6.1-6.9 0 0.2 0.4 0.6 0.8 1 1.2 1.4
Remaining Amount of Magnetization (RAM)
Depth (km)
Number of Earthquake
-18 -17 -16 -15 -14 -13 -12 -11 -10 -9 -8 -7 Ti-magnetite Ti-maghemite MagnetiteDepth (km)
Distance from trench (km)
0 20 40 0 50 75 25 -15 100 -35 -30 -25 -20 -15 -10 -5 0 serpentinized peridotite intrusive dolerite, gabbro, extrusive basalt sediment r al mm
A
B
C
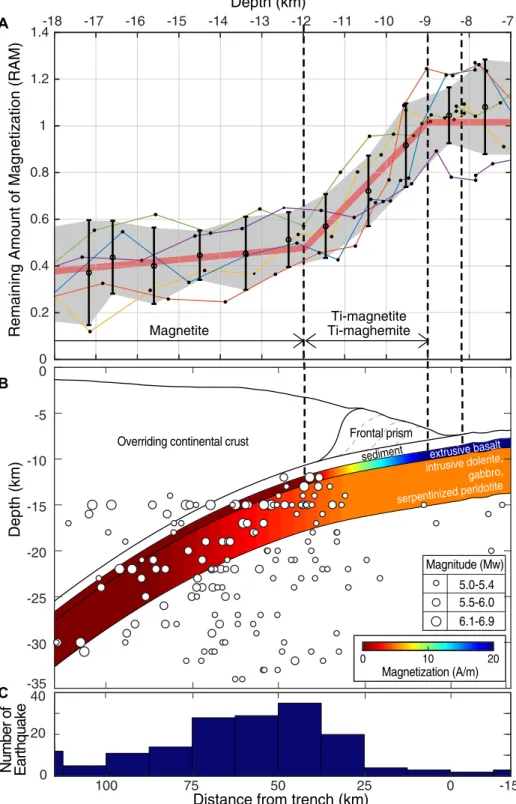
Figure 3. (A) Remaining Amount of Magnetization (RAM) versus depth of the top of the magnetic layer for the subducting plate, offshore northeastern Japan. Colored lines correspond to a mag-netic anomaly shown by a similarly colored box in Figure 1C. Averaged RAM within 1 km depth intervals are shown by circles with error bars (σ = 1), and confidence limits by the shaded area. Thick red line summarized the RAM variation with depth: (1) between 7 and 9 km, i.e., before and immediately after subduction, the RAM is equal to 1; (2) between 9 and 12 km, the RAM decays rapidly as a result of alteration and/or thermal demagnetization of the extrusive basaltic layer; and (3) beyond 12 km, the RAM decreases slowly, reflecting the thermal demagnetization of the deeper crust. (B) Schematic illustration of decaying magnetization in the different layers of the oceanic crust based on the result in A. Earthquake hypocenters are shown by circles of size proportional to magnitude. The magnetization of the extrusive basaltic layer decreases rapidly and disappears between 9 and 12 km depth; the magnetization of the deeper oceanic layers slowly decays and disappears at ∼20 km depth. (C) Number of earthquakes per 12.5 km intervals versus distance from the trench. The number of earthquakes sharply increases 25 km landward from the trench (∼10 km depth) and suddenly decreases 75 km landward from the trench, where the slab depth is ∼18 km.
Delescluse, M., and Chamot-Rooke, N., 2008, Serpen-tinization pulse in the actively deforming Central Indian Basin: Earth and Planetary Science Let-ters, v. 276, p. 140–151, https://doi .org/10.1016/ j.epsl.2008.09.017.
D’Errico, J., 2005, Surface Fitting using gridfit, MAT-LAB Central File Exchange: https://www.math- works.com/matlabcentral/fileexchange/8998-surface-fitting-using-gridfit (accessed May 2006). Divins, D.L., 2003, Total Sediment Thickness of the
World’s Oceans and Marginal Seas: Boulder, Colorado, National Oceanic and Atmospheric National Geophysical Data Center, https://www. ngdc.noaa.gov/mgg/sedthick/sedthick.html). Dyment, J., and Arkani-Hamed, J., 1995,
Spreading-rate-dependent magnetization of the oceanic lithosphere inferred from the anomalous skew-ness of marine magnetic anomalies: Geophysical Journal International, v. 121, p. 789–804, https:// doi .org/10.1111/ j.1365-246X.1995.tb06439.x. Dyment, J., and Arkani-Hamed, J., 1998,
Contribu-tion of lithospheric remanent magnetizaContribu-tion to satellite magnetic anomalies over the world’s oceans: Journal of Geophysical Research: Sol-id Earth, v. 103, p. 15423–15441, https://doi .org/10.1029/97JB03574.
Dziewonski, A.M., Chou, T.-A., and Woodhouse, J.H., 1981, Determination of earthquake source parameters from waveform data for studies of global and regional seismicity: Journal of Geo-physical Research, v. 86, p. 2825–2852, https:// doi .org/10.1029/JB086iB04p02825
Fulton, P.M., Brodsky, E.E., Kano, Y., Mori, J., Ches-ter, F., Ishikawa, T., Harris, R.N., Lin, W., Eguchi, N., and Toczko, S., 2013, Low coseismic friction on the Tohoku-Oki fault determined from tem-perature measurements: Science, v. 342, p. 1214– 1217, https://doi .org/10.1126/science.1243641. Gee, J.S., and Kent, D.V., 2007, Source of oceanic
mag-netic anomalies and the geomagmag-netic polarity tim-escale, in Schubert, G., ed., Treatise on Geophysics, Volume 5: Amsterdam, Elsevier, p. 455–507, https:// doi .org/10.1016/B978-044452748-6.00097-3. Granot, R., and Dyment, J., 2019, The
influ-ence of post-accretion sedimentation on ma-rine magnetic anomalies: Geophysical Re-search Letters, v. 46, p. 4645–4652, https://doi .org/10.1029/2019GL082265.
Grevemeyer, I., Ranero, C.R., and Ivandic, M., 2018, Structure of oceanic crust and serpentinization at subduction trenches: Geosphere, v. 14, p. 395– 418, https://doi .org/10.1130/GES01537.1. Harris, R.N., Spinelli, G.A., and Fisher, A.T., 2017,
Hydrothermal circulation and the thermal struc-ture of shallow subduction zones: Geosphere, v. 13, p. 1425–1444,: https://doi .org/10.1130/ GES01498.1.
Harrison, C., 1987, Marine magnetic anomalies: The origin of the stripes: Annual Review of Earth and Planetary Sciences, v. 15, p. 505–543, https:// doi .org/10.1146/annurev.ea.15.050187.002445. Hayes, G.P., Wald, D.J., and Johnson, R.L., 2012,
Slab1.0: A three-dimensional model of global subduction zone geometries: Journal of Geo-physical Research: Solid Earth, v. 117, p. 1–15, https://doi .org/10.1029/2011JB008524). Hayes, G.P., Moore, G.L., Portner, D.E., Hearne, M.,
Flamme, H., Furtney, M., and Smoczyk, G.M., 2018, Slab2, a comprehensive subduction zone geometry model: Science, v. 362, p. 58–61, https://doi .org/10.1126/science.aat4723.
Hyndman, R.D., and Peacock, S.M., 2003, Serpentini-zation of the forearc mantle: Earth and Planetary Science Letters, v. 212, p. 417–432, https://doi .org/10.1016/S0012-821X(03)00263-2. Isezaki, N., 1986, A new shipboard three-component
magnetometer: Geophysics, v. 51, p. 1992–1998, https://doi .org/10.1190/1.1442054.
Karson, J.A., 2002, Geologic structure of the up-permost oceanic crust created at fast- to inter-mediate-rate spreading centers: Annual Re-view of Earth and Planetary Sciences, v. 30, p. 347–384, https://doi .org/10.1146/annurev. earth.30.091201.141132.
Kawada, Y., Yamano, M., and Seama, N., 2014, Hy-drothermal heat mining in an incoming ocean-ic plate due to aquifer thocean-ickening: Explaining the high heat flow anomaly observed around the Japan Trench: Geochemistry Geophysics Geosystems, v. 15, p. 1580–1599, https://doi .org/10.1002/2014GC005285.
Kelley, D.S., et al., 2001, An off-axis hydrother-mal vent field near the Mid-Atlantic Ridge at 30°N: Nature, v. 412, p. 145–149, https://doi .org/10.1038/35084000.
Kido, Y., and Fujiwara, T., 2004, Regional variation of magnetization of oceanic crust subducting beneath the Nankai Trough: Geochemistry Geo-physics Geosystems, v. 5, p. 1–11, https://doi .org/10.1029/2003GC000649.
Kodaira, S., Nakamura, Y., Yamamoto, Y., Obana, K., Fujie, G., No, T., Kaiho, Y., Sato, T., and Miura, S., 2017, Depth-varying structural characters in the rupture zone of the 2011 Tohoku-oki earth-quake: Geosphere, v. 13, p. 1408–1424, https:// doi .org/10.1130/GES01489.1.
Macdonald, A.H., and Fyfe, W.S., 1985, Rate of serpentinization in seafloor environments: Tec-tonophysics, v. 116, p. 123–135, https://doi .org/10.1016/0040-1951(85)90225-2.
Malinverno, A., Hildebrandt, J., Tominaga, M., and Channell, J.E.T., 2012, M-sequence geomagnet-ic polarity time scale (MHTC12) that steadies global spreading rates and incorporates astrochro-nology constraints: Journal of Geophysical Re-search: Solid Earth, v. 117, p. 1–17, https://doi .org/10.1029/2012JB009260.
Nakanishi, M., Tamaki, K., and Kobayashi, K., 1989, Mesozoic magnetic anomaly lineations and sea-floor spreading history of the northwestern Pacif-ic: Journal of Geophysical Research: Solid Earth, v. 94, p. 15437–15462, https://doi .org/10.1029/ JB094iB11p15437.
Nakanishi, M., 2011, Bending-Related Topographic Structures of the Subducting Plate in the North-western Pacific Ocean, in Ogawa, Y., et al., eds., Accretionary Prisms and Convergent Margin Tec-tonics in the Northwest Pacific Basin (Chapter 1): Springer, 1–33 p., https://doi .org/10.1007/978-90-481-8885-7_1.
Okubo, Y., Makino, M., and Kasuga, S., 1991, Magnetic model of the subduction zone in the northeast Japan Arc: Tectonophysics, v. 192, p. 103–115, https://doi .org/10.1016/0040-1951(91)90249-R.
Okubo, Y., and Matsunaga, T., 1994, Curie point depth in northeast Japan and its correlation with regional thermal structure and seismicity: Journal of Geo-physical Research: Solid Earth, v. 99, p. 22363– 22371, https://doi .org/10.1029/94JB01336. Parker, R.L., and Huestis, S.P., 1974, The
inver-sion of magnetic anomalies in the presence of
topography: Journal of Geophysical Research, v. 79, p. 1587–1593, https://doi .org/10.1029/ JB079i011p01587.
Ryan, W.B.F., et al., 2009, Global multi-resolu-tion topography synthesis: Geochemistry Geophysics Geosystems, v. 10, https://doi .org/10.1029/2008GC002332).
Sandwell, D.T., Müller, R.D., Smith, W.H.F., Garcia, E., and Francis, R., 2014, New global ma-rine gravity model from CryoSat-2 and Jason-1 reveals buried tectonic structure: Science, v. 346, p. 65–67, https://doi .org/10.1126/ science.1258213.
Seno, T., 2017, Subducted sediment thickness and M w 9 earthquakes: Journal of Geophysical Re-search: Solid Earth, v. 122, p. 470–491, https:// doi .org/10.1002/2016JB013048.
Stein, C.A., 2003, Heat flow and flexure at subduc-tion zones: Geophysical Research Letters, v. 30, https://doi .org/10.1029/2003GL018478. Thébault, E., et al., 2015, International Geomagnetic
Reference Field: The 12th generation: Earth, Planets, and Space, v. 67, p. 79, https://doi .org/10.1186/s40623-015-0228-9.
Tsuru, T., Park, J.-O., Miura, S., Kodaira, S., Kido, Y., and Hayashi, T., 2002, Along-arc structur-al variation of the plate boundary at the Japan Trench margin: Implication of interplate cou-pling: Journal of Geophysical Research: Solid Earth, v. 107, p. ESE 11-1–ESE 11-15, https:// doi .org/10.1029/2001JB001664.
van Keken, P.E., Kita, S., and Nakajima, J., 2012, Thermal structure and intermediate-depth seis-micity in the Tohoku-Hokkaido subduction zones: Solid Earth, v. 3, p. 355–364, https://doi .org/10.5194/se-3-355-2012.
Violay, M., Gibert, B., Mainprice, D., Evans, B., Dau-tria, J.-M., Azais, P., and Pezard, P., 2012, An experimental study of the brittle-ductile transi-tion of basalt at oceanic crust pressure and tem-perature conditions: Journal of Geophysical Re-search: Solid Earth, v. 117, p. 1–23, https://doi .org/10.1029/2011JB008884.
Wada, I., He, J., Hasegawa, A., and Nakajima, J., 2015, Mantle wedge flow pattern and thermal structure in Northeast Japan: Effects of oblique subduc-tion and 3-D slab geometry: Earth and Planetary Science Letters, v. 426, p. 76–88, https://doi .org/10.1016/ j.epsl.2015.06.021.
Yamano, M., Hamamoto, H., Kawada, Y., and Goto, S., 2014, Heat flow anomaly on the seaward side of the Japan Trench associated with deformation of the incoming Pacific plate: Earth and Planetary Science Letters, v. 407, p. 196–204, https://doi .org/10.1016/ j.epsl.2014.09.039.
Yang, T., Dekkers, M.J., and Zhang, B., 2016, Seismic heating signatures in the Japan Trench subduc-tion late-boundary fault zone: Evidence from a preliminary rock magnetic “geothermometer”: Geophysical Journal International, v. 205, p. 319– 331, https://doi .org/10.1093/gji/ggw013. Zhou, W., Van der Voo, R., Peacor, D.R., Wang,
D., and Zhang, Y., 2001, Low-temperature oxidation in MORB of titanomagnetite to titanomaghemite: A gradual process with implications for marine magnetic anomaly amplitudes: Journal of Geophysical Research: Solid Earth, v. 106, p. 6409–6421, https://doi .org/10.1029/2000JB900447.