HAL Id: hal-03044708
https://hal.archives-ouvertes.fr/hal-03044708
Submitted on 7 Dec 2020HAL is a multi-disciplinary open access archive for the deposit and dissemination of sci-entific research documents, whether they are pub-lished or not. The documents may come from teaching and research institutions in France or abroad, or from public or private research centers.
L’archive ouverte pluridisciplinaire HAL, est destinée au dépôt et à la diffusion de documents scientifiques de niveau recherche, publiés ou non, émanant des établissements d’enseignement et de recherche français ou étrangers, des laboratoires publics ou privés.
Ages and chemistry of mare basaltic units in the
Grimaldi basin on the nearside of the Moon:
Implications for the volcanic history of the basin
P.M. Thesniya, V. J. Rejesh, Jessica Flahaut
To cite this version:
P.M. Thesniya, V. J. Rejesh, Jessica Flahaut. Ages and chemistry of mare basaltic units in the Grimaldi basin on the nearside of the Moon: Implications for the volcanic history of the basin. Meteoritics and Planetary Science, Wiley, 2020, 55 (11), pp.2375-2403. �10.1111/maps.13579�. �hal-03044708�
Ages and chemistry of mare basaltic units in the Grimaldi basin on the nearside
of the Moon: Implications for the volcanic history of the basin
P. M. Thesniya1, V. J. Rajesh1,*, and J. Flahaut2
1Department of Earth and Space Sciences, Indian Institute of Space Science and Technology,
Valiamala (P. O.), Thiruvananthapuram-695547, India
2Centre de Recherches Pétrographiques et Géochimiques (CRPG) - CNRS/ Université de Lorraine,
15 rue Notre Dame des Pauvres, 54500 Vandoeuvre les Nancy, FRANCE Correspondence E-mail: [email protected]
Abstract
Lunar mare basalts represent flood volcanism between ~4.0 and 1.2 Ga, therefore providing insights into the thermal and volcanic history of the Moon. The present study investigates the spectral and chemical characteristics as well as ages of the nearside mare basaltic units from the Grimaldi basin, namely Mare Grimaldi and Mare Riccioli, using a wealth of orbital remote sensing data. This study delineated distinct basaltic units of varying albedo, mineralogy, and titanium contents in both Mare Grimaldi and Mare Riccioli. The Crater size-frequency Distribution technique revealed that at least two phases of basaltic magmatism have occurred in the Grimaldi basin spanning ~3.5 Ga to 1.5 Ga (Late Imbrian-Eratosthenian). High-Ti olivine basalts dated at 2.05 Ga are found to be surrounded by Late Imbrian (~3.47 Ga) low to intermediate-Ti basalts in Mare Grimaldi. Low to intermediate-Ti basalts observed in Mare Riccioli date back to two different volcanic events at ~3.5 Ga and ~3.2 billion years, while patches of basalts having remarkably higher titanium content within the Mare Riccioli record the youngest age of ~1.5 Ga. The chemical trend of the pyroxenes from distinct basaltic units also revealed that multiple events of volcanism have occurred in the Grimaldi basin. The high-Ti basalts in the Mare Grimaldi crystallized from a Fe-enriched late-stage magma while the low-Ti basalts crystallized from an Mg and Ca-rich initial magma that experienced an ultra-late stage quenching. The low to intermediate-Ti basaltic magma erupted in both the units was derived by partial melting of early cumulate materials from the hybrid source region in the post-overturn upper mantle and made its way to the surface through dikes that propagated by excess pressures accumulated in the diapirs stalled at the base of the crust due to buoyancy trap. The intermediate to high-Ti magma erupted in the Mare Grimaldi was generated by a hot plume ascended from
deeper clinopyroxene-ilmenite rich cumulate layer near the core-mantle boundary. Whereas, the Eratosthenian (~1.5 Ga) intermediate-Ti volcanic activity in the Mare Riccioli rather sourced from the ilmenite-clinopyroxene cumulate materials remained in the upper mantle after mantle overturn. The new results suggest that volcanism had not ceased in the Grimaldi basin at 3.27 Ga, rather it was active and fed by different mantle sources until 1.5 Ga for a period spanning ~2 billion years.
Keywords: Mare Grimaldi, Mare Riccioli, pyroxene chemistry, crystallization history, mare
volcanism, Moon.
I. INTRODUCTION
Earth's Moon is a natural laboratory for studying key planetary processes, including the formation and evolution of rocky planets. Scientific contributions from sample return missions and orbital measurements have greatly improved our understanding about the Moon. According to the Lunar Magma Ocean scenario, the Moon was melted up to a considerable depth following its accretion (Smith et al. 1970; Wood et al. 1970; Wood et al. 1972; Wood et al. 1975; Wood et al. 1983; Warren, 1985). As this magma ocean crystallized, denser mafic minerals (e.g., olivine) settled to the bottom and formed a part of the lunar mantle, whereas later formed plagioclase crystals floated upward and formed the anorthositic lunar crust (e.g., Warren, 1985; Shearer et al. 2006; Elardo et al. 2011; Charlier et al. 2018). Mare basalts are believed to have been formed by remelting of the lunar interior after this initial differentiation episode, through serial magmatism (e.g., Spudis and Davis 1986). They are emplaced as fissure-type eruptions of the low-viscosity basaltic magma through cracks and dikes and cover 17% of the lunar surface area (Wilson and Head 1981; Head and Wilson 1992). The nature of source regions and causeand processes of remelting of the lunar interior for the generation of mare basaltic magmas are not yet well understood. The Surface dating of the mare basaltic units based on Crater Size-Frequency Distribution (CSFD) technique as well as radiometric ages of the returned lunar samples revealed that the mare volcanism on the Moon begun at around ~3.9-4.0 Ga ago and continued until ~1.2 Ga, with a peak in the volcanic activity at ~3.2-3.8 Ga (Head and Wilson 1992; Hiesinger et al. 2000). In addition, the long time span of the eruption of the mare basalts along with vast diversity in their compositions across the lunar surface hint to the heterogeneous nature of lunar interior and make them potential candidates for understanding the variations in compositions, source regions, processes, and temperatures over time (Head and Wilson 1992;
Giguere et al. 2000; Morota et al. 2011). Therefore, investigating the origin, diversity, and ages of mare basalts on the Moon is vital to understand its volcanic history and thermal evolution better.
The present study utilizes orbital remote sensing data from various lunar exploration missions to survey mare basalts of the Grimaldi basin on the western limb of the nearside Moon (Fig. 1). In the past few decades, the Visible Near-InfraRed (VNIR) orbital remote sensing technique emerged as a powerful tool to understand the surface mineralogy and chemical composition of the Moon. Pyroxene, plagioclase, and olivine minerals, which are major components of basalts, can be identified in the VNIR domain due to their diagnostic absorptions (see Methods section). Among these, pyroxene is a significant component in the basalts. The pyroxene group minerals form in all the stages of the crystallization of basaltic magma (Bence and Papike 1972; Shearer et al. 2006) and hence record the petrogenetic history of basalts (Bence and Papike 1972). Therefore, the chemical trend of pyroxenes in basalts should provide information about the crystallization history of basaltic magma. The chemistry of the pyroxenes present in the mare basalts and the relative abundances of endmember compositions can be determined based on their band parameter analysis, allowing us to retrieve information about the crystallization history of basaltic magma (e.g., Cloutis and Gaffey 1991a).
In the present study, mare basaltic units in the Grimaldi basin (Fig. 1) have been investigated using high-resolution optical and spectral imagery. M3 (Moon Mineralogy Mapper)
data has been utilized for determining the mineralogy of mare basaltic units. Detailed chemistry of pyroxenes in the Mare Grimaldi and Mare Riccioli has been analyzed further based on the M3 absorption band characteristics. Moderate-high resolution spatial data from
Terrain Mapping Camera (TMC), Terrain Camera (TMC), Lunar Reconnaissance Orbiter Camera (LROC), and topographic data from LOLA (Lunar Orbiter Laser Altimeter) have also been used to study the geological context and CSFD dating of the mare basaltic units in the Grimaldi basin. Based on the results, the origin, age, and emplacement mechanism of the basaltic units in the Mare Grimaldi and Mare Riccioli are discussed. The evolutionary stages of the Grimaldi basin involving the eruption of mare basalts in multiple stages and from diverse sources are also discussed.
I.A. Geological background of the study area
Grimaldi basin is a Pre-Nectarian two ringed, ‘mascon' impact basin located at 5°S, 68°W on
the western limb of the nearside Moon, northeast of the Orientale basin (nearly 290 kilometers away) (Hartmann and Kuiper 1962; Wilhelms 1987) (Fig. 1A). The basin has a diameter of ~440 km and an inner peak ring of ~ 230 km in diameter, with an approximate depth estimated to
~2.7 km. (Fig. 1A, 1B) (C. A. Wood 2004). Lunar mascon (mass concentrations) basins such as the Grimaldi basin are characterized by positive free-air gravity anomalies in their central low-lying topography (Muller and Sjogren 1968; Melosh et al. 2013) which might be an indication of a positive density anomaly or excess distribution of mass within the crust or upper mantle (Freed et al. 2014; Zhong et al. 2018). Possibly, dense mare basaltic lavas and/ upliftment of the crust-mantle interface would have contributed to the build-up of mass concentrations in basin depressions (Bratt et al. 1985; Melosh et al. 2013). Crustal thickness map derived from the GRAIL (Gravity Recovery and Interior Laboratory) data suggests a thickness of ~7 to 43 km for the crust beneath Grimaldi basin (Wieczorek et al. 2013), which is relatively thinner than the average lunar crust and make it, together with the occurrence of a mascon anomaly, a potential site of interest for this study.
Mare basalts (Mare Grimaldi, hereafter) of Eratosthenian age (termed as ‘Elm’ unit, Scott et al. 1977) fill part of the basin interior to the inner peak ring of 230 km diameter (Wilhelms 1987). The inner peak ring is prominent towards the SE and NW sides of the basin (Fig. 1C). The peak rings have been degraded partially and/ to some extent in the north-eastern and south-western parts of the basin. The ringed peaks rise to an approximate height of ~4.5 km. The region that is lying between the inner ring and outer rim has been designated as the basin floor (Fig. 1B). On the west, this mascon basin is bounded by a regular border, having an average height of 1.21 km, while on the opposite side, it is much broken. Riccioli crater is present on the north-western side of the basin. Mare basalts (Mare Riccioli, hereafter) have partially filled the floor of the Riccioli crater. In the south of the basin, the wall is broken by a large irregular depression. On the east, several grabens were identified (Fig. 2). At the extreme north end, several linear grabens cut through the wall and trend towards Lohrmann crater. Rimae Havelius is one such linear fracture trending in the NW-SE direction (Fig. 2). Wrinkle ridges were also found within Mare Grimaldi, trending in the NE-SW direction (Fig. 2). The Grimaldi region was initially mapped by McCauley et al. (1973), and later studied with NIR telescopic data by Peterson etal. (1995); various geological units in the Grimaldi region were delineated, and the composition and possible origin of these geological units and the stratigraphy of the pre-impact target site were also discussed. Spectral studies revealed that much of the Grimaldi region is covered by the outer facies of Havelius formation (Orientale Group) of noritic anorthosite and anorthositic norite in composition. The proximity of the Grimaldi basin to the Orientale basin (~3.8 Ga) (Yue et al. 2020) resulted in the blanketing of intact lithologies in the Grimaldi basin by the outer facies of the Orientale ejecta. The Orientale ejecta also overlies the interior of the Riccioli crater to the northwest of the crater. This blanketing of the Orientale ejecta is evident in long linear patterns on the surface of the Riccioli crater. Pure anorthosites were
detected in the peak ring and represent the excavated anorthositic crust. The mare basalts within the Grimaldi have mafic assemblages dominated by High Calcium Pyroxenes (HCP) (Peterson et al. 1995). Gabbroic materials were also identified in excavated materials from beneath the Orientale related units at the location of three small impact craters (Fig. 2). Localized Dark Mantling Deposits (LDMD) of pyroclastic origin were also identified in the outer portion of the Grimaldi basin (McCauley 1973; Scott et al. 1977; Coombs 1988; Hawke et al. 1989a, b; Coombs and Hawke 1992). The compositional and morphological studies of Grimaldi LDMDs were carried out in detail by Gaddis et al. (2003) and Hawke et al. (2012). Elongated depressions aligned along NW-SE direction at the center of the Grimaldi deposit were suggested to be probable vents through which pyroclastic debris erupted. These vents have widths ranging from ~3.1 – 3.2 km, length from 4.4 km to 12.3 km, and depths up to 1007 m (Hawke et al. 2012). The wt. % FeO of the dark deposits show greater values ranging from 10-15 compared to that of the surrounding geological units (~4-6 wt. %) and wt. % TiO2 values of ~3.6 wt. % (Hawke et al. 2012).
As discussed in the previous section, compositional studies of the Grimaldi basin were carried out by previous researchers. However, the mare basaltic units in the Grimaldi basin, Mare Grimaldi and Mare Riccioli have not been studied yet. The present study investigates those two mare basaltic units with newly available high-resolution datasets. The age of distinct basaltic units has been determined based on the CSFD technique. The mineralogical and spectral characteristics of these basaltic units have been examined. The chemistry of pyroxenes was also determined based on their band parameter analysis. Finally, the cooling and emplacement history of the basalts have been deciphered. The origin and emplacement of the younger high-Ti basalts within Mare Grimaldi and Mare Riccioli have also been discussed.
II. DATASETS AND METHODS II.A. Data
Orbital remote sensing data from various lunar missions available in the public domain have been utilized in the present study. Hyperspectral data from Moon Mineralogy Mapper (M3) on-board ISRO's Chandrayaan-I spacecraft have been used for the identification and
mapping of minerals. M3 is a Visible Near-InfraRed (VNIR) hyperspectral imager aboard the
Chandrayaan-1 mission, designed for compositional mapping of the lunar surface (Pieters et al. 2009; Klima et al. 2010; Green et al. 2011). The sensor has obtained global images of the Moon at a spatial resolution of 140m/pixel in global mode and operated in the 446 nm-3000 nm wavelengths range with a spectral resolution of 20 nm-40 nm. Fifteen orbits of Level 2 images from the optical period OP1B have been used in the present study, because of the OP1B complete coverage in the regions of interest (Boardman et al. 2011). Level 2 dataset, consisting of
photometrically and thermally corrected reflectance data (Isaacson et al. 2011; Besse et al. 2013; Isaacson et al. 2013), were downloaded from the Lunar Orbiter Data Explorer Portal (http://ode.rsl.wustl.edu/moon/).
Moderate to-high spatial resolution optical imagery from Terrain Mapping Camera (TMC), Terrain Camera (TC), and NASA's Lunar Reconnaissance Orbiter Camera (LROC) have been used for the morphological studies.
TMC was a panchromatic stereo-viewing camera on-board Chandrayaan-1 with a spatial resolution of 5 m, operating in the spectral range of 0.5-0.75 µm (Bhandari 2005; Kiran Kumar and Roy Chowdhury 2005a; Goswami and Annadurai 2009; Goswami 2010). TMC was aimed for topographic mapping of the Moon using high-resolution images acquired in the fore, nadir, and aft directions of the spacecraft movement (Gopala Krishna et al. 2009; Arya et al. 2011; Chauhan et al. 2012). TMC images were downloaded from the ISSDC (Indian Space Science Data Center) portal (https://webapps.issdc.gov.in). Full coverage of the mare was only available for Mare Riccioli.
The Kaguya TC is a push broom type stereoscopic imager that flew in the SELENE spacecraft (Haruyama et al. 2008). TC has a spatial resolution of 10m/pixel from the nominal 100 km SELENE orbit. TC operated in a panchromatic band ranging from 430-850 nm. TC data were utilized in addition to TMC data because of its full coverage in the regions of Mare Grimaldi and Mare Riccioli. TC images were downloaded from the SELENE data archive portal (http://darts.isas.jaxa.jp/planet/pdap/selene/dataset). Mare Grimaldi units were dated using the mosaic generated from TC images, while TMC images were used for the Mare Riccioli.
Lunar Reconnaissance Orbiter Camera (LROC) is a set of high-resolution stereo-viewing cameras that flew on LRO (Lunar Reconnaissance Orbiter) mission of NASA (Tooley et al. 2010; Robinson et al. 2010; Speyerer et al. 2011; Scholten et al. 2012; Wagner et al. 2015). LROC-WAC (Wide-Angle Camera) images with a spatial resolution of 100m/pixel have been used to understand the broad morphology and local geological setting of the study area. LROC WAC global mosaic of the Moon was downloaded from the Astrogeology Science Centre portal (https://astrogeology.usgs.gov.).
LOLA and Kaguya Terrain Camera (TC) merged DEM has been utilized in the present study to understand the topography of the study area. This DEM merge was generated at a horizontal resolution of 512 pixels/degree (~59 m at the equator) with ~3-4 m vertical accuracy (Barker et al. 2016a). LRO-LOLA and Kaguya TC merge global hillshade map has also been used in the present study. The data was downloaded from the Astrogeology Science Centre portal (https://astrogeology.usgs.gov.).
Olivine abundance maps of the region were generated using SELENE MI (Multiband Imager) data (Lemelin et al. 2016). The FeO abundance map generated from the SELENE MI data (Lemelin et
al. 2016) and TiO2 abundance map generated from the LROC WAC (Wide Angle Camera) (Sato
et al. 2017) was also utilized in the present study. These three abundance maps were obtained from the QuickMap web interface (https://quickmap.lroc.asu.edu).
II.B. Methods
II.B.1. Mineralogical mapping
M3 image strips were georeferenced and spatially subset to the boundary coordinates of the
basin. The subset of images was then used to produce a reflectance mosaic of the Grimaldi basin. Albedo variations in the lithological units were observed based on the M3 R1578 albedo
map. The varying albedo in the 1578 nm band points towards the mineralogical differences in the region.
Lunar minerals and soils commonly exhibit absorption features at 1000 nm and 2000 nm (e.g., Pieters et al. 2009; Staid et al. 2011). Besides, space weathering effects tend to induce a positive (red) slope in the surface spectra and cause “optical maturation” (evidenced by a decrease in the average reflectance level and the absorption band strengths, e.g., Adams and McCord 1970; Pieters et al. 1993, 2000). Olivine can be identified by three overlapping broad absorption bands near 1 µm (0.9 µm, 1.05 µm, and 1.3 µm) and the absence of features at higher wavelengths (King and Ridley 1987; Burns 1970a; Burns 1970b; Burns et al. 1972; Burns 1973; Adams 1975; Burns 1993). Two major Fe2+ absorption bands from 0.9 µm-1.05 µm and 1.8 µm-2.3 µm in pyroxenes
vary as a function of Fe2+ and Ca2+ content (Adams 1974). High Calcium Pyroxenes (HCP; e.g.,
augite, diopside) exhibit a 1 µm absorption band centered between 0.91-1.06 µm with a 2 µm band centered at 1.97-2.35 µm. Low Calcium Pyroxenes (LCP; e.g., enstatite, hypersthene) also show both 1 µm and 2 µm absorption bands with band centres that vary from 0.90-0.93 µm and 1.80-2.10 µm respectively (Burns 1970; Burns 1972; Adams 1974; Cloutis and Gaffey 1991a; Cloutis and Gaffey 1991b). In addition, the 1 µm and 2 µm band centres of LCP systematically shift to longer wavelengths with an increase in Ca2+ content (Adams 1974; Cloutis and Gaffey 1991b).
This shift in the band centres to longer wavelengths as a function of Ca2+ content is owing to change
in crystal field sites in which Fe2+ ions are located. (Burns 1970; Adams 1974). As a result,
pigeonites, which are of intermediate Ca composition, show absorption bands near 0.93 µm and 2 µm, sub-calcic augites have bands near 0.99 µm and 2.18 µm, whereas absorption bands of the Ca-rich diopside are near 1.04 µm and 2.3 µm (Adams 1974). The band depths and positions of these absorption features can be used as a diagnostic parameter for discriminating the lunar lithologies.
Integrated Band Depth (IBD) is a parameter used in the VIS-NIR spectroscopy for the spectral mapping of lunar mafic lithologies based on their ferrous absorption bands (e.g., Mustard et al. 2011; Besse et al. 2011; Isaacson et al. 2011; Staid et al. 2011). This parameter is sensitive to the abundances of pyroxenes, olivine, ilmenite, etc. in the surface lithologies. The Band Depth (BD) is the depth of an absorption band and is defined relative to the continuum (Clark and Roush 1984).
Band depth = 1-continuum removed reflectance
Where R
represents reflectance at a given wavelength, and Rc denotes reflectance relative to a local continuum defined between the inflection points on both sides of the absorption band.
IBD at 1000 nm and 2000 nm were generated to discriminate between mafic rich regions and anorthositic highland areas. IBD1000 parameter map has been generated by integrating the band depths between 789 nm and 1308 nm relative to the local continuum formed between 789 nm and 1308 nm. The IBD1000 parameter is sensitive to the presence of both olivines and pyroxenes. IBD2000 parameter map has been generated by summing up the band depths between 1658 nm and 2498 nm relative to a local continuum drawn between 1658 nm and 2498 nm and is commonly used to map pyroxenes occurrences.
An M3 color composite image was generated using integrated band depth parameter maps.
The IBD1000 parameter was assigned to the Red channel while Green and Blue channels were assigned the IBD2000 and R1578 bands, respectively. Reflectance spectra were collected from spectrally distinct regions using the color composite images generated for both the units. The soil spectra from each unit were extracted by averaging a number of pixels in that region. Apart from this, pyroxene-bearing spectra were also collected from smaller superposed craters within each unit. These spectra are obtained from single representative pixel in that location. The constituent mineral phases in the average soil spectra were identified based on their characteristic band parameters such as band center, relative band strengths, and the overall spectral pattern. The spectra are a convolution of multiple components present on the target surface. In the case of basaltsthe 1000 nm and 2000 nm absorption bands of pyroxene group minerals are the dominant features. The dominant pyroxene-related features will superimpose the effects of other
mixed components such as plagioclase and /or olivine on the reflectance spectra. However, the presence of mixed phases may also impart a slope to the spectra and cause a shift in the 1000 nm and 2000 nm apparent band minima. The wavelength-dependent scattering would also cause a greater continuum slope to the spectra, and consequently, the dominant 1000 nm and 2000 nm absorption bands would have negligible band minima (Clark and Roush 1984). Therefore, continuum removal of the spectra has to be performed to reduce these effects of continuum slope on the major absorption bands before their band parameter analysis (Clark and Roush 1984). For the continuum removal, the local maxima on both sides of the absorption bands were determined for each analyzed spectrum. And a straight line tangent was drawn between the local maxima points to define the continuum slope. Continuum removal of the spectra has been done by dividing the spectra by the straight-line continuum drawn between inflection points on both sides of the absorptions for the Band I and Band II (Suppl Fig. 1). The Band Centre (BC), Band Area (BA) and Band Strength (BS) are calculated for each endmember spectra based on the method described in Cloutis et al. 1986 and Gaffey et al. 2002 which was later adopted and successfully applied by Kaur et al. (2013) and Chauhan et al. (2018) for estimating the chemical composition of pyroxenes within the mare basalts on the Moon. The Band Center (BC) is calculated as the band minima after removal of the continuum slope. A 3rd-4th order polynomial function was fitted to the bottom of the absorption features, and the band center is calculated as the minimum point of the fitted polynomial. The error associated with the BC calculation was determined through an iterative process by changing the number of points on either side of a visually determined band minimum five to six times, and band centers are calculated each time. The calculated band center values are averaged, and the average BC value is used for further analysis. Standard deviation (STD) was also determined using the estimated band center values. BS is the depth of the absorption feature relative to the continuum. BA is calculated as the area between the continuum line and the data points in the absorption band of the spectra. The Band Area Ratio (BAR) is the ratio of Band II area to Band I area of pyroxenes. Band I is sensitive to the relative abundances and composition of pyroxenes and /or olivine, while Band II is sensitive to the abundance of pyroxenes in the spectra (Cloutis et al. 1986). BAR is calculated to determine the relative abundances of olivine and pyroxenes in the mare basalt spectra. Increased BAR value suggests the higher abundance of pyroxenes in the spectra, and lower values indicate the presence of mixed olivine phase in the spectra (Cloutis et al. 1986; Gaffey et al. 1993). The effect of olivine in the spectra was removed by using the calibration given in Cloutis et al. (1986) and Gaffey et al. (2002). A correction factor was applied to the Band I center to remove the potential contribution of olivine from the spectra before determining the pyroxene composition. The correction factor was derived by calculating the displacement in the Band I center using BAR vs Band I center calibration. The calculated Band I displacement was later applied for olivine correction of Band I
center. The estimated Band I center (olivine corrected) and Band II center values are applied for calculating the molar Ca, Fe and Mg content in pyroxenes using a set of equations given by Gaffey et al. (2002).
The estimated molar contents of endmember pyroxene compositions are projected on to a pyroxene quadrilateral plot to understand the relative abundances of endmember compositions. The crystallization trend of basaltic magma was determined based on the pyroxene compositional trend observed in the quadrilateral plot (Lindsley and Anderson 1983).
II.B.2. Datation with CSFD technique
CSFD technique has been adopted for determining the absolute model ages of the distinct basaltic units within Mare Grimaldi and Mare Riccioli. The CSFD method is a widely used technique to estimate the absolute and relative ages of the photogeological units on planetary surfaces (Neukum et al. 1983; Neukum and Ivanov 1994; Hiesinger et al. 2000; Neukum et al. 2001). The method primarily involves measurement of the surface area of the target unit as well as the diameter of each primary crater within the unit. The obtained crater diameters were plotted as cumulative distribution in Craterstats 2 software. Craters with diameters between 200
m to 2 km have been considered for age estimation. The age is estimated by fitting the lunar production function to the cumulative crater distribution (Neukum et al. 1975; Neukum 1983; Neukum and Ivanov 1994).
III. RESULTS
Mare Grimaldi and Mare Riccioli were previously mapped as two basaltic units emplaced during the Imbrian-Eratosthenian period (~3.25-3.48 Ga), consisting of low albedo units with superposed rays and Eratosthenian craters (Fig. 3; Wilhelms et al. 1987). Albedo variations and mineralogy is a widely used method for defining distinct geological units (e.g., Staid et al. 2011; Staid and Besse 2013; Kaur et al. 2013; Zhang et al. 2014). In the present study, the M3 R1578 albedo map has been used to understand the albedo variations in the Mare
Grimaldi and Mare Riccioli basaltic units while the M3 RGB composite highlight variations in
mineralogy (Fig. 3). Fresh impact craters which are found to have excavated these basaltic units exhibit spectral signatures of pyroxene group minerals. The albedo variations, chemical composition and mineralogy, FeO and TiO2 abundances, pyroxene crystallization trend, model
ages, and emplacement history of Mare Grimaldi and Mare Riccioli are discussed separately in the following sections.
III.A. Spectral and compositional diversity of the Mare Grimaldi and Mare Riccioli units III.A.1. Unit mapping from M3 albedo variations
Mare Grimaldi has occupied the low-lying regions of the basin interior. Within the Mare Grimaldi, notable variations in the R1578 albedo can be observed (Fig. 3A). Albedo variations result from the mafic mineral abundances as well as optical maturity of the surface. M3 R1578 albedo in the Mare Grimaldi ranges from ~0.01-0.12 (Fig. 3A). The measured albedo is
less compared to the bright surrounding highlands (>0.09) in the Grimaldi basin, due to the presence of mare basalts containing mafic minerals. The bright ejecta rays from the Grimaldi B crater located in the NNW of the Mare Grimaldi are seen to have partially blanketed the top layer of the mare basalt (Fig. 3A). The prominent albedo variations in the Mare Grimaldi is attributed to the distribution of ejecta rays from the Grimaldi B crater. The basaltic units towards the northern half of the Mare Grimaldi show higher reflectance because of its proximity to the Grimaldi B crater. The relatively younger superposed craters, which appear to have excavated the basaltic units in the Mare Grimaldi, also display relatively higher albedo values (0.07-0.12). Based on the prominent variations in the albedo, distinct basaltic units have been delineated within the Mare Grimaldi. Four major basaltic units have been defined, namely, G1, G2, G3, and
G4 (Fig. 3A). These units are labelled in the order of increasing albedo. The G1 unit, located in the SW part of the Mare Grimaldi, displays the lowest albedo values (~0.04) (Fig. 3A). The G1 unit is surrounded by the G2 unit having albedo values in the ~0.05-0.06 range. The albedo in the G3 unit ranges from ~0.06-0.07. G4 unit exhibits the highest albedo in the Mare Grimaldi ranging from ~0.08-0.09. However, the smaller craters within the Mare Grimaldi exhibits a longer range of albedo from 0.01-0.12. The lower albedo in these craters, ranging between 0.01-0.04, is a manifestation of the mafic mineral exposures on the crater wall while the higher values (~0.1) indicate less optical maturity of the crater. Mare Riccioli basalts exhibit a slightly varying albedo ranging from ~0.02-0.10 (Fig. 3B). The low-albedo regions (~0.04-0.05) are confined to the central portion of the Mare Riccioli as well as the inner walls of superposed craters. The surrounding regions show albedo values between 0.06-0.11. The intermediate to lw albedo regions in the central portion of the Mare Riccioli is designated as R1 unit. Within the R1 unit, few patches of distinctively lower albedo can also be seen towards the northern central region (Fig. 3B). These small patches of low albedo regions (0.02) might be attributed to a varying maturity of the surface units and /or later younger eruptions. The surrounding higher albedo region is labeled as R2 unit (Fig. 3B). The Mare Grimaldi units have slightly lower albedo values compared to the Riccioli basalts, possibly due to the more mafic-rich composition of the Mare Grimaldi basalts.
III.A.2. FeO and TiO2 abundance map
Kaguya-derived FeO and TiO2 abundances of the Mare Grimaldi and Mare Riccioli have
also been used to understand the chemical nature of these basaltic units (Fig. 4). In the Mare Grimaldi, the G1 unit shows higher FeO (>22.5 wt. %) and TiO2 (>9 wt. %) contents, indicating
the presence of high-Ti basalts in the region (Fig. 4A-B). The G2 unit shows FeO and TiO2 contents
between 20-22.5 wt. % and 6-10 wt. % respectively. The G3 unit exhibits relatively higher FeO abundance values (15-20 wt. %) than G4 unit and intermediate TiO2 contents ranging from 4-9 wt.
%. The outer unit, G4 towards the northern part of the Mare Grimaldi, displays medium FeO contents (12.5-15 wt. %) and low to intermediate TiO2 abundance values (2-5 wt. %). The varying
FeO and TiO2 contents are consistent with the spectrally defined distinct basaltic units in the Mare
Grimaldi. The intermediate to high-Ti basalts (G1 and G2 units) are seen to be surrounded by the low to intermediate-Ti basalts comprising the G2, G3, and G4 units (Fig. 4B). The G1 unit having the lowest albedo possess higher FeO and TiO2 abundance values. The boundary of the G1
unit is delineated based on the distinctly visible extents of the high TiO2 and FeO contents (Fig.
4A-B). It is apparent that the high TiO2 regions have a greater spatial extent and are seen as
lower albedo values in the spectrally defined units are linked with the higher TiO2 and FeO
abundance in those units. The mafic-rich composition (higher FeO and TiO2) of these units
causes the observed decrease in their albedo.
In the Mare Riccioli, the FeO content ranges from 12.5-22.5 wt. % and TiO2 contents between
2-8 wt. % (Fig. 4C-D). The R1 unit exhibits higher FeO (20-22.5 wt. %) and low to intermediate TiO2 (3-8 wt. %) abundance values while the R2 unit shows relatively lower FeO
(12.5-20 wt. %) and low to intermediate TiO2 (2-5 wt. %) abundance values. The R1 unit is
surrounded by the R2 unit of relatively low-TiO2 contents to the northwest. Small patches
of higher FeO and TiO2 concentrations are seen within the R1 unit towards the northern part (Fig.
4C-D). The intermediate-low albedo unit (R1) defined in Fig. 3B does not display a uniform distribution of FeO and TiO2 contents in the abundance map (Fig. 4C-D). The unit rather shows an
uneven distribution of FeO and TiO2 abundances.
III.A.3. Compositional variations from color composite images
M3 color composite images generated by assigning IBD1000, IBD2000, and R1578 to the
red, green, and blue channels, respectively, are shown in Fig. 5. In the color composite image, the basaltic units are displayed in the shades of yellow-orange. The varying color shades in the image are attributed to the differences in ferrous band strengths as well as band centers arising from the variations in the mineralogy and /or optical maturity (Staid et al. 2011; Cheek et al. 2011). Distinct basaltic units within Mare Grimaldi and Mare Riccioli were distinguished based on the color differences in the color composite image. The approximate boundary of the G1 unit was delineated based on the spectrally visible spatial extent of TiO2 abundance in the unit, as the
spectral contrast between G1 and surrounding G2 unit is not very obvious in the color composite image (Fig. 5A). The yellow, green, and orange shades represent compositional variations as well as the maturity of the mafic lithologies (Cheek et al. 2011). In the Mare Grimaldi, the G1 and G2 unit exhibits slightly brown-red hues (Fig. 5A). The surrounding low-Ti basaltic units, G3, and G4 exhibit yellow-blue shades. The smaller craters within the Mare Grimaldi shows brighter yellow tones representing the pyroxene-rich materials of underlying basaltic units exposed on these crater walls (Staid et al. 2011) (Fig. 5A). The surrounding highlands are displayed in the blue shades resulting from the high feldspathic contents and /or greater maturity of the highland soi(Cheek et al. 2011). Similarly, in the color composite image of the Mare Riccioli, the basaltic units are displayed in the yellow-orange shades (Fig. 5B). The R1 unit exhibits yellow shades consistent with the low to intermediate-Ti contents in the unit. The relatively low-Ti basalts, R2 unit is displayed in the light green-orange shades. The smaller craters having pyroxene-rich materials are shown in the bright yellow shades (Fig. 5B).
The brown to red-hued basaltic units (G1 and G2) in the Mare Grimaldi also exhibit high-FeO and high-TiO2 contents, as shown in Fig. 4A-B. The late-stage high-Ti basalts would have a
unique color, composition, and spectral characteristics, and they often represent the younger volcanic materials (Staid et al. 2011). In the Clementine color ratio image, the late-stage high-Ti basalts in the G1 and G2 units appear blue because of higher spectral reflectance in the blue region of the electromagnetic spectrum (e.g., McEwen et al. 1994; Pieters et al. 1998) (Fig. 5C). In the M3 color composite image, the high-Ti basalts in the central portion towards the southern half of
the Mare Grimaldi display brown-red hues and are, therefore, thought to represent late-stage younger basalts (Fig. 5A).
The brown-red hues of the high-Ti basalts of the Mare Grimaldi in the M3 color composite are likely caused by the increased band strengths in the 1000 nm region
relative to a weaker 2000 nm absorption band and might indicate the presence of olivine (Staid et al. 2011; Zhang et al. 2016) (Fig. 6A). The strong and broad absorption feature in the region of 1000 nm might also reflect the presence of FeO-rich glass in basalts (Pieters et al. 1980). In the Mare Grimaldi, the brown-red-hues are likely to be caused by a higher abundance of olivine. IBD 1000 nm parameter map has been used to estimate the olivine abundance in the Mare Grimaldi. The IBD1000 parameter is sensitive to the strengths of absorption features in the 1000 nm region of the spectra. Olivine has the diagnostic absorption band only in the 1000 nm region, unlike pyroxenes which have two major diagnostic bands both in the 1000 nm and 2000 nm regions. Therefore, the abundance of olivine in the basalts can be mapped based on the IBD1000 nm parameter. In the IBD1000 map, the central portion towards the southern half of the Mare Grimaldi exhibit higher abundance values (white and purple hues) (Fig. 6A). The higher values in this parameter map are consistent with the high Fe-Ti region of the Mare Grimaldi (G1 and G2) (Fig. 6A). This higher olivine abundance associated with the high-Ti basalts in the Mare Grimaldi is validated by the Kaguya MI-derived olivine abundance map (Fig. 6C). The MI olivine abundance map displays greater abundance values in the G1 (0.17-0.22 wt. %) and G2 (0.1-0.2 wt. %) units of the Mare Grimaldi (Fig. 6C). The low to intermediate-Ti basalts in the Mare Riccioli also show a higher IBD1000 value (Fig. 6B). However, the Riccioli units are not showing higher values (0.025-0.15 wt. %) in the MI olivine abundance map, which is contrary to the higher IBD1000 value (Fig. 6D). This discrepancy in the olivine abundance of Mare Riccioli units would have been caused by the contribution of other mixed phases to the 1000 nm band strengths that resulted in the increased band strength values in the 1000 nm region and thereby higher abundance values in the IBD III.A.4. Mineralogical signatures from M3 spectra
Exposure of lunar surface to space weathering reduces the overall reflectance, and spectral contrast weakens the absorption features of different chemical phases and increases the soil maturity (e.g., Staid and Pieters 2000). In the Grimaldi basin, materials of highly immature (e.g., the interior of the superposed craters), as well as mature soils, are distributed unevenly. Several soil spectra were obtained from individual basaltic units for understanding the spectral characteristics and identifying the mineralogy. Reflectance spectra of mare soils were obtained from mature locations while pyroxene-bearing spectra were obtained from immature regions in the interior of the superposed craters. These variations in the optical maturity of the mare units caused by the space-weathering effects are determined based on the relation of R950/R750 (ratio of the reflectances at 950 nm and 750 nm) vs 750 nm reflectance (R750). The reflectance at 750 nm indicates the variations in soil compositions and maturity. While, the R950/R750 ratio is linked to the mafic absorption band strength, which is sensitive to the optical maturity of the mare and highland soils (e.g., Wohler et al., 2006). Therefore, the linear relationship between 750 nm albedo and reflectance ratio on the ratio-reflectance plot allows us to distinguish the soil materials and the trends related to soil maturity can be evaluated (Lucey et al., 1995; 1998; 2000). On the ratio-reflectance plot, the pixels occupying low-ratio, brighter end belong to immature materials while high-ratio, dark end represents mature soils (Lucey et al., 1998; Staid and Pieters 2000). Relatively younger superposed craters within the Mare Grimaldi and Mare Riccioli expose materials of underlying basaltic units from depth. These smaller craters that appear to have excavated the basaltic units are subjected to space weathering effects for relatively less time and remain fresh or immature. Similar mature and immature regions have been distinguished based on the relation of R950/R750 vs R750. Representative soil spectra were extracted from each unit by averaging the reflectance of these immature pixels (Fig. 7, 8, & 9). Reflectance spectra from the surrounding highland soils are also shown for comparison (Fig. 7A-B). The locations from where the spectra have been obtained are marked as white polygons in Fig. 5A-B. Crystalline plagioclase exposures and pure anorthosite bearing spectra were identified from the wall of the Grimaldi S crater (Fig. 7E-F). This anorthosite exposure may represent primary crustal material from the PAN (Pure Anorthosite) layer (Ohtake et al. 2009; Donnaldson-Hanna et al. 2014). The soil spectra collected from the distinct basaltic units exhibit varying spectral slope and absorption characteristics. The soil spectra from the G1 unit display lower average albedo values and a relatively stronger absorption band in the 1000 nm region (Fig. 7A-B). A weaker absorption band has been observed in the 2000 nm region. Moreover, the band I absorption is observed to be shifted longward in response to the Fe2+ electronic transition absorption. The band strength in the
1000 nm region is higher relative to the 2000 nm band. The presence of olivine would increase the strength of the 1000 nm band relative to the Band II absorption and bring a longward shift in the Band I absorption. The presence of FeO-rich glass might also contribute to the longward shift
of Band I center (Besse et al. 2014). However, the presence of glass will additionally contribute to a shortward shift in Band II center and higher Band II strength relative to Band I, which is contrary to the G1 spectra. Therefore, the observed longward shift in Band I and greater band I strength is conclusively consistent with the olivine abundance in the G1 unit of Mare Grimaldi. This evidence favors the occurrence of olivine basalt in the Mare Grimaldi (Fig. 6). The soil spectra from the G2 unit exhibit relatively symmetric Band I and Band II absorptions (Fig. 7A-B). The Band I appear to be narrower compared to a broader Band II absorption. The spectra from the G2 unit is dominated by pyroxene-rich materials. The G3 unit soil spectra exhibit evident absorption features in the 1000 nm and 2000 nm regions (Fig. 7A-B). However, the Band II absorption is broader relative to a narrow Band I absorptions. The average soil spectra from the G4 unit also exhibits absorptions in the 1000 nm and 2000 nm regions with a relatively stronger and broader Band II absorption (Fig. 7A-B). The soil spectra from the R1 unit in the Mare Riccioli have spectral characteristics more or less similar to the G1 unit of Mare Grimaldi (Fig. 7C-D). The BanI absorption is relatively stronger and shifted slightly longward. The R2 spectra also show both the Band I and Band II absorptions with a stronger and broader absorption band in the 2000 nm region (Fig. 7C-D). The R2 unit is dominated by pyroxene-rich materials.
The pyroxene-bearing spectra obtained from the inner walls of superposed craters in Mare Grimaldi and Mare Riccioli were identified and found that the clinopyroxenes are the major component present in the spectra (Fig. 8 & 9). As discussed earlier, clinopyroxenes exhibit two major absorption bands at 1000 nm (Band I) and 2000 nm (Band II) in response to the electronic transition absorptions by Fe2+ ions in the M1 and M2 sites. The clinopyroxene-rich spectra in the
G1, G2, and G3 unit exhibit stronger Band I absorption relative to the Band II absorption, suggesting the presence of mixed phases in the spectra (Fig. 8A-F). However, the clinopyroxene-rich spectra from the G4 unit, as well as Riccioli units exhibit more or less symmetrical and stronger Band I and Band II absorptions, which indicate that clinopyroxene is dominating the reflectance spectra from these regions (Fig. 8G-H). The pyroxene spectra from the R1 and R2 units are also showing symmetrical Band I and Band II absorption bands (Fig. 9A-D).
III.A.5. Determining the composition of the pyroxenes based on their band parameter analysis
The ‘Elm’ basaltic units in the Mare Riccioli and Mare Grimaldi are dominated by clinopyroxenes. The Band I and Band II absorption features of the pyroxenes would enable us to retrieve relevant information about their chemistry as well as crystallization conditions (Bence and Papike 1972). Hence, the Band I and Band II parameters such as BC, BS, and BA have been calculated for the collected spectra based on the method described in the methodology
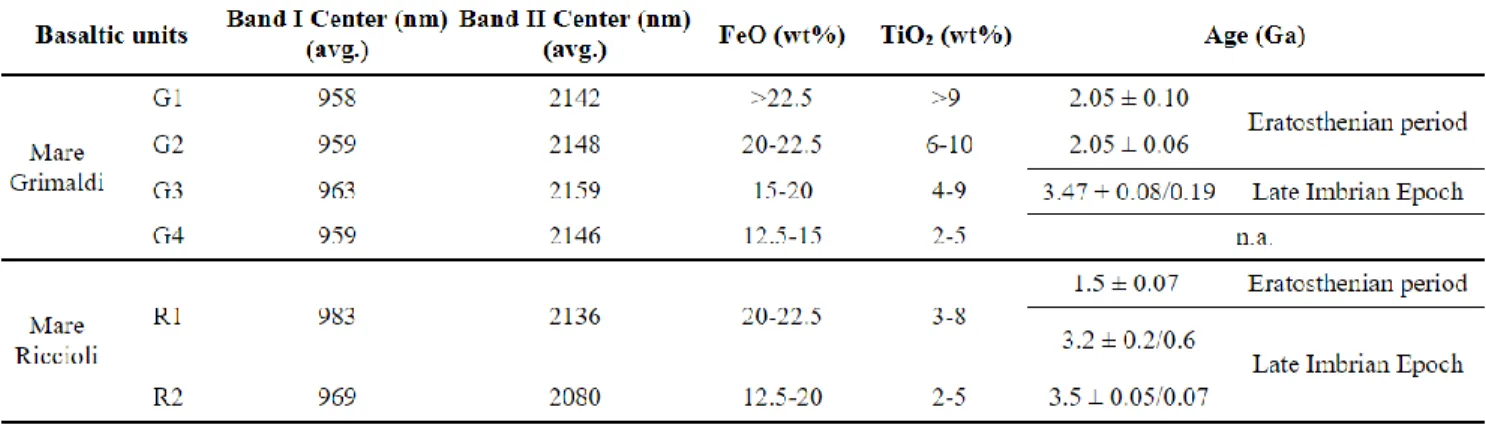
section. The Mare Grimaldi units show Band I centres between ~985 nm-991 nm while the Band II centres between ~2142 nm-2159 nm. On the other hand, the Mare Riccioli units show both the Band I and Band II centers at relatively shorter wavelengths (~969-983 nm, ~2074-2136 nm). The variations in the band centers are consistent with the TiO2 and FeO contents of different units. The
Band I and Band II centres are found to have shifted to somewhat longer wavelengths with the enhanced TiO2 abundances of the basaltic units.
BAR vs. B I center is plotted to understand the mixing of olivine and pyroxenes in the obtained spectra as the olivine abundance is noticeably higher in the high-Ti units (after Gaffey et al. 1993) (Fig. 10A). The Mare Grimaldi and Mare Riccioli compositions are falling in the region of clinopyroxenes and orthopyroxenes (Opx>Ol) in the BAR vs. Band I center plot. The BAR for the Mare Grimaldi compositions (fresh craters as well as soil samples) is between 0.4-2 (Fig. 10A). The Band I center ranges from ~963 nm - 1032 nm. The Mare Riccioli compositions have BAR in the 0.6-1.7 range, while the Band I center ranges from ~951 nm – 1016 nm (Fig. 10A). The BAR increases as the pyroxene component dominate the reflectance spectra (Cloutis et al. 1986). Mare Riccioli compositions have BAR values greater than the Mare Grimaldi compositions, suggesting the elative dominance of pyroxenes in the Mare Riccioli compositions (Fig. 10A). The Band I center shifts longward with the corresponding decrease in the BAR when the olivine content in the spectra increases (Cloutis et al. 1986). The soil sample from the Mare Grimaldi and Mare Riccioli showing lower BAR values and longer Band I centers indicate the mixed olivine content in the spectra. This mixed olivine content yet again validates the observed higher olivine abundance of the high-Ti basaltic units in the Mare Grimaldi. As most of the soil samples show evidence of mixed olivine component, these soil compositions are not included in the further band parameter analysis. Since the mixing of olivine and pyroxene phase in the reflectance spectra is noticed, the displacement in the Band I center of pyroxenes has to be corrected to remove the spectral effects of olivine (see Methods section). The estimated displacement in the Band I center is approximately 23 nm on average (Fig. 10B). The estimated Band I (corrected) and Band II parameters for the pyroxenes from each basaltic unit are given in Table 1. The corrected Band I centers and Band II centers have been used for the Band II vs. Band I plot. This Band II vs. Band I plot is used to understand the compositional variations among the pyroxenes (Fig. 10C). The reference data from Adams (1974), later modified by Cloutis and Gaffey (1991a) and synthetic pyroxene data from Klima et al. (2011) are also plotted for comparison (Fig. 10C). The Mare Grimaldi and Mare Riccioli pyroxene compositions are falling along with the main trend of the reference pyroxene data. The corrected Band I center of the Mare Grimaldi pyroxenes range from 937 nm - 983 nm, while the Band II center ranges between 2097 nm – 2199 nm (with average values of 959 nm and 2148 nm). Mare Riccioli pyroxene compositions exhibit Band I center
between 951 nm – 1004 nm and Band II center in the 1997 nm – 2180 nm range (with average values of 976 nm and 2108 nm). The systematic shift of Band II center to longer wavelengths is owing to the increase in the Ca2+ content (Cloutis and Gaffey 1991a; Klima et al. 2011). The band
center values indicate that the pyroxene compositions are mainly pigeonite and augite in the Mare Grimaldi and Mare Riccioli (Fig. 10C).
The estimated band parameters of pyroxenes can also be used to calculate the relative abundance of endmember pyroxene compositions (Gaffey et al. 2002; Kaur et al. 2013; Chauhan et al. 2018). The abundance of these pyroxenes is determined using the calibration equations described in the methodology section (Gaffey et al. 2002). The estimated pyroxene abundances have been projected onto a pyroxene quadrilateral plot (Suppl Fig. 2) to understand the relative proportions of Ca, Mg, and Fe (Lindsley and Anderson 1983). In the quadrilateral, the major pyroxene compositions in Mare Grimaldi and Mare Riccioli are pigeonite and augite (Suppl Fig. 2). However, most of the pyroxene compositions in the Mare Grimaldi and Mare Riccioli are falling in the ‘forbidden zone’ of the pyroxene quadrilateral (Fig. 10D). In the forbidden region, single pyroxene of intermediate composition is unstable at low pressures (Lindsley and Anderson 1983). However, Fe-rich pyroxene compositions, often zoned to pyroxferroite, falling in the forbidden region, were also observed in lunar basalts as a result of metastability and rapid crystallization (cf. Papike et al. 1976; Papike and Vaniman 1978). Typically, mare basalts contain a stable equilibrium three-phase assemblage of Ca Fe pyroxene-Fe olivine-silica that formed through crystallization from a Fe-enriched late-stage melt (cf. Papike et al. 1991). In some cases, extremely Fe-rich pyroxene or a silicate mineral called pyroxferroite (~Wo14En11Fs75) crystallizes metastably relative to the typical
pyroxene-olivine-silica assemblage due to rapid cooling of the late-stage melts. These metastable iron-rich pyroxenes occupy the “forbidden region” near the Hd-Fe join of the ‘pyroxene quadrilateral’ (Lindsley and Anderson 1983). Similar compositions formed metastably at low pressures in lunar basalts by the rapid cooling of magma (to below 990 °C at 2 °C per hour) at or near the surface were reported earlier, particularly in high-K basalts, olivine basalts, pigeonite basalts, ilmenite basalts, feldspathic basalts, and very high-Ti basalts in the Apollo 11, Apollo 12, Apollo 15, Apollo 17, and Apollo 14 samples (Lindsley and Burnham 1970; Lindsley 1972; Papike et al. 1991).
The Mare Riccioli pyroxenes are mostly subcalcic-augites to augites while the Mare Grimaldi pyroxenes comprise pigeonite and augites (Fig. 10D). The chemical trend of these compositions is commonly the reflection of a combination of factors such as melt composition, crystallization history, and late-stage to subsolidus cooling rate (cf. Bence and Papike 1972; Papike et al. 1976). The augites from R1 and R2 show a compositional cluster near the Di-Hd join (Fig. 10D). This kind of clustering is common in pyroxenes of quickly cooled
basalts. The subcalcic-augites from both these units show a clustering towards the forbidden zone. In the R1 and R2 units, the crystallization commences with primary Mg-rich augite compositions, representing the initial stage of crystallization of the magma. A sudden drop in the calcium content of augites is observed (Fig. 10D). This discontinuity in the trend has possibly resulted from the onset of crystallization of plagioclase that preferentially incorporated CaO into plagioclase and thereby depleted calcium content in the residual melt. The Fe-enriched late-stage reidual liquid might have crystallized iron-rich late-stage subcalcic-augites. The intermediate calcium content of these pyroxenes between pigeonite and augite suggests their crystallization metastably from an iron-rich residual melt that cooled rather quickly in the late-stage (e.g., Smith and Lindsley 1971). The extreme iron enrichment is also indicating a fairly fast cooling rate and thereby violated the ‘forbidden region’ of the pyroxene quadrilateral (Lindsley and Munoz 1969).
The compositions from G1, G2, G3, and G4 units exhibit a lower-Ca, and Fe-enrichment trend zoning to the metastable composition in the forbidden region along the Hd-Fs join (Fig. 10D). In the G1 unit, the Fe-rich subcalcic-augite compositions show tight clustering in the region of metastable pyroxenes in the quadrilateral. The extremely Fe-rich compositions in this unit might be indicative of crystallization from a highly fractionated magma at a fast cooling rate. This compositional clustering might also be the result of the mantling of the olivine by pyroxenes that hindered the former from reacting with the liquid. However, this scenario is beyond the scope of this study. Further, the G2 and G3 units are showing distinct chemical trends starting with the crystallization of Fe-rich pigeonite followed by subcalcic-augite (Fig. 10D). Although, few compositions from G2 and G3 units are seen to have crystallized at Mg-rich end of the quadrilateral. It is possible that crystallization in the G2 and G3 units started with primary Mg-ich augites in early stages followed by the incoming of plagioclase and subsequent rapid crystallization of iron-rich subcalcic late-stage augites and pigeonites from the residual melt. This iron-enrichment with constant Mg at the expense of Ca is reflected in their occurrence as a metastable phase in the ‘forbidden region’ of the quadrilateral. The compositions in the G4 unit also show calcium content intermediate between pigeonite and augite, suggesting that they crystallized metastably from a quickly cooled late-stage melt (Fig. 10D). The compositional break in the augite trend due to preferential incorporation of CaO into plagioclase is not very common in fast cooled rocks as the plagioclase nucleation is very late or not at all in such rocks. However, the late residual melt in a slowly cooled magma might experience a late-stage rapid cooling (quenching) and crystallize metastable pyroxene compositions which otherwise are not stable in the forbidden region of the quadrilateral. Therefore, the extremely Fe-rich pyroxenes in these basalts are possibly the result of the crystallization of a fractionated magma under the quenching conditions. The possibility of a subsolidus re-equilibration can also not be ruled out as augite-pigeonite exsolution is common in lunar basalts (Ross et al. 1970; Papike et al.
1971; Takeda et al. 1975). However, the remote spectrochemical analysis limits the scope of detection of subsolidus exsolution in pyroxenes and, therefore, this is not understandable using this pyroxene thermometer (e.g., Lindsley and Anderson 1983).
Based on the observations, it can be inferred that the high-Ti basalts in the Mare Grimaldi crystallized from a Fe-enriched highly fractionated late-stage magma at a fast cooling rate (~ 2 °C per hour) between ~1100°C-1000°C (Fig. 10D). Whereas, the low-Ti basalts in the Mare Grimaldi crystallized from a rather Mg and Ca-rich initial magma that underwent an ultra-late stage rapid cooling at a rate between 1200°C-1000°C. The chemical trend of low-Ti basalt in the Mare Riccioli conforms to a similar scenario where the cooling (1200°C-1000°C) of an initial high Ca- Mg magma followed a late-stage quenching through rapid crystallization. The intermediate-Ti basalts in the Mare Riccioli also suggest a quenching trend where an initial Ca, and Mg-rich magma experienced a late-stage fast cooling (1100°C-1000°C) resulting in a metastable crystal-liquid equilibration.
III.A.6. Model ages of Mare Grimaldi and Mare Riccioli using Crater-Size Frequency Distribution Technique (CSFD)
The model ages for the basaltic units in the Mare Grimaldi and Mare Riccioli have been determined based on the CSFD technique. The Mare Grimaldi and Mare Riccioli basalts were previously dated by Hiesinger et al. 2010 and reported ages of 3.48 Ga and 3.27 Ga, respectively. In the present study, the distinct basaltic units in the Mare Grimaldi and Mare Riccioli have been dated separately to understand the volcanic history of the basin (Fig. 11) (Table 1). The model age for the basaltic unit in G4 could not be determined based on the CSFD technique as the unit is more or less blanketed by ejecta from the Grimaldi B crater. The cumulative crater frequency plot of the G1 and G2 units revealed younger ages, ~2.05 Ga ± 0.06. Since both the units are showing similar ages, the crater counts of these areas have been merged, and the cumulative frequency plot along with the age isochron for these units are shown in a single plot displaying a common age of 2.05 Ga (Fig. 11A & C). The G3 unit in the Mare Grimaldi revealed a model age of 3.47 Ga ±0.08/0.19 (Fig. 11C). The R1 unit the Mare Riccioli revealed an older age of 3.2 Ga ± 0.2/0.6 and a younger age of 1.5 Ga ± 0.07 (Fig. 11B & D). These older and younger model ages suggest at least two volcanic events in the R1 unit. As discussed earlier, few patches of intermediate-Ti, high-Fe basalts are seen within the R1 unit. The younger age of 1.5 Ga ± 0.07 might be indicative of this late-stage intermediate-Ti magmatic event. It is speculated that the 3.2 Ga volcanic event that occurred in the R1 unit is followed by a younger 1.5 Ga event, identified as small patches of high-Ti basalts within the unit. The R2 unit revealed an age of 3.5 Ga ± 0.05/0.07 (11E). This older event of 3.5 Ga in the R2 unit is coinciding with
the age of low to intermediate-Ti basalts (G3) in the Mare Grimaldi. The age of the R1 unit in Mare Riccioli and G3 unit of Mare Grimaldi are consistent with the previous dates reported in the Hiesinger et al. 2010. In addition, new results show rather younger events of 1.5 Ga in the Mare Riccioli and ~2.05 Ga in the intermediate to the high-Ti basaltic units of Mare Grimaldi. These relatively younger volcanic events in the Grimaldi basin has important implications for the thermal and volcanic history of the basin.
IV. DISCUSSIONS
In the Mare Grimaldi, the low to intermediate-Ti basalts are widespread while the high-Ti olivine-bearing basalts are confined to the south-western part (Thesniya et al. 2020) (Fig. 4A-B and Fig. 6A & C). The intermediate-Ti basalts in the Mare Riccioli also appear to have limited spatial extends which has been observed as small patches within the R1 unit (Fig. 4C-D). The spectrally visible high-Ti basaltic units are considered to be relatively younger materials based on their intrusive relationship with the surrounding low to intermediate-Ti basalts (Fig. 4). The model ages revealed that at least two major volcanic events spanning ~3.5 Ga to ~1.5 Ga (Late Imbrian-Eratosthenian) have occurred in the Grimaldi basin (Fig. 11). The ages further emphasize that an older Late Imbrian volcanic event of ~3.47 Ga formed the low to intermediate-Ti basalts in the Mare Grimaldi, followed by the eruption of high-Ti magma at ~2.5 Ga ago (Eratosthenian period) (Fig. 11C). The Late Imbrian low to intermediate basalts in the G3 unit might have filled the entire low-lying region of the Mare Grimaldi and the Eratosthenian high-Ti basalts localized to the extents of G1 and G2 units. Also, the younger high and intermediate titanium basalts in the G1 and G2 units are seen intermixed with each other. This coalescing of high-Ti basalts in the G1 and G2 units with the intermediate-Ti basalts might be the result of impact-induced lateral mixing of high-Ti and underlying Late Imbrian low-Ti basalts (Giguere et al. 2000). The older event of ~3.5 Ga (Late Imbrian) in the Mare Riccioli is nearly coinciding with the formation age of the Late Imbrian (~3.47) low to intermediate-Ti basalt in the Mare Grimaldi (Fig. 11D-E). This low-Ti magma erupted at ~3.5 Ga have filled the entire Riccioli unit whereas the low to intermediate-Ti basalts formed at ~3.2 Ga ago are spatially limited to the extent of the R1 unit (Fig. 11D). The youngest volcanic event occurred in the Mare Riccioli is at ~1.5 Ga ago (Eratosthenian period) which erupted intermediate-Ti basalts within the R1 unit. It is plausible that these Eratosthenian intermediate-Ti basalts formed in the Mare Riccioli (R1 unit) were the result of impact mixing of younger high-Ti basalts with the underlying Late Imbrian low-Ti basalts in the Mare Riccioli (Giguere et al. 2000). Furthermore, a correlation between ages and titanium contents of basalts has been observed (Table 1). The late-stage Eratosthenian basaltic units show intermediate to high titanium contents whereas the low to intermediate basalts were
erupted during Late Imbrian Epoch. This progressive enrichment of TiO2 and FeO contents in the
Mare Grimaldi and Mare Riccioli with time is consistent with the similar observations from other regions on the Moon, particularly mare basalts in Procellarum KREEP Terrane (PKT) and Mare Imbrium (e.g., Giguere et al. 2000; Bugiolacchi et al. 2008). The crystallization history of the pyroxenes from distinct basaltic units in the Mare Grimaldi and Mare Riccioli also revealed signs of multiple volcanic events in the Grimaldi basin. This observation is consistent with the emplacement of distinct basaltic units that erupted at different periods in the basin (~3.5 Ga-1.5 Ga). Based on the results from Hiesinger et al. 2010, it was believed that the volcanic activity occurred at ~3.47 Ga and 3.27 Ga ago and ceased soon after the eruption of Mare Riccioli. However, the results from the present study indicate that volcanism was active in the Grimaldi basin until 1.5 Ga ago. The variations in the Ti-contents of mare basalts erupted over a long time span and its proportional correlation with time suggest lateral chemical heterogeneity of the lunar mantle (e.g., Morota et al. 2011). It is suggested that the high-Ti basalts in the Mare Grimaldi crystallized from a Fe-enriched highly fractionated late-stage magma at a fast cooling rate while the low-Ti basalts crystallized from a rather Mg and Ca-rich initial magma that underwent an ultra-late stage rapid cooling under disequilibrium conditions. The possible source regions and emplacement mechanism of the basaltic magma that erupted in the Grimaldi basin during Late Imbrian and Eratosthenian period are discussed in the following section.
IV.A. Possible origin and emplacement history of the Mare Grimaldi and the Mare Riccioli
A schematic model of the evolutionary history of the Grimaldi basin based on evidence from the present study and incorporating the current understanding of the thermal evolution of the lunar interior is proposed. The stages in the evolution of the Grimaldi basin involving the eruption of mare basaltic units are marked by three major events (Fig. 12).
I. Basin forming impact event (>3.9 Ga, Pre-Nectarian)
The basin-forming impact event induces pressure release melting and produces secondary convection following the selenotherm uplift, which causes the melting of the lunar crust and upper mantle to a depth greater than the depth of the transient crater (Fig. 12A) (Elkins-Tanton et al. 2004). Grimaldi basin forming impact event would also have generated impact heat and might have triggered the melting of the lunar crust and upper mantle to a considerably greater depth below the impact point. The basaltic magma produced by this pressure release melting might have caused the eruption of older basalts through the fractures in the Grimaldi basin. However, the eruption of the older low-Ti basaltic units presently identifiable in the Mare Grimaldi and Mare Riccioli must not be related to the magma generated by pressure release melting, because the
basin forming impact event occurred at >3.9 Ga ago, and the oldest visible basalts in the Grimaldi basin are ~3.5 Ga old. An age gap of approximately 700 Ma can be observed between the time of formation of the Grimaldi basin and the low-Ti basalts in the Mare Grimaldi and Mare Riccioli. The impact generated magma would persist for ~350 Ma following the impact-induced pressure release melting and associated secondary convection (Elkins-Tanton et al. 2004). If the older low-Ti basaltic units in the Mare Grimaldi and Mare Riccioli are formed as a result of the eruption of an impact-generated magma, the magma would not have persisted for such a long period (Whitten et al. 2011). Therefore, it can be inferred that the surface mare basaltic units present in the Mare Grimaldi and Mare Riccioli are not related to the impact-induced decompression melting and subsequent magma generation.
Given the above inferences, different models already proposed by previous workers for the source regions and evolution of the mare basalts on the Moon have been assessed here to understand the origin and emplacement history of the mare basaltic units in the Mare Grimaldi and Mare Riccioli. The magma ocean cumulate model suggests the remelting of Magma-Ocean cumulates, caused by the influx of a hot, deep (~1000 km) magma that formed during its thermal evolution post-LMO, for the generation of mare basaltic magmas in the lunar upper mantle (Taylor and Jakes 1974; Solomon and Longhi 1977). In another model by Wieczorek and Phillips (2000), the presence of higher KREEP levels causes the initiation of partial melting in lunar mantle directly beneath the KREEP basalt layer in the PKT and leads to the generation of mare basalts in the region. However, this model can be ruled out as the Mare Grimaldi and Mare Riccioli lie outside the boundary of the PKT, and they do not show any signatures of enhanced heat-producing elements. Further, the differences in crustal thickness would lead to the asymmetric spatial distribution of mare basalts on the nearside of the Moon (Solomon 1975; Head 1976; Head and Wilson 1992). Grimaldi basin is located on the boundary of the thicker farside and thinner nearside. Furthermore, crustal thickness estimates are ~8 km in the region of Mare Grimaldi and ~32 km in Mare Riccioli (Wieczorek et al. 2013, model 1) (Suppl Fig. 3). The observed differences in the crustal thickness between Mare Grimaldi and Mare Riccioli could have led to the non-uniform eruptions of basaltic magma at different periods in the basin. Another model explains that the instabilities in the lunar mantle, followed by large scale mantle overturn, affect the emplacement and evolution of mare basalts (Hess and Parmentier 1995). This model is independent of basin formation impact events. The mode of emplacement of Grimaldi basalts would rather support this model.
II. Emplacement of the older low to intermediate-Ti basalts during the first phase of volcanism in Late Imbrian Epoch (3.5 Ga – 3.2 Ga)
The petrological models suggest that a late-stage ilmenite-clinopyroxene rich layer (ilm-cpx) formed between the underlying olivine-orthopyroxene cumulate layer (ol-opx) and the primary floatation crust during the final stages of solidification of the Lunar Magma Ocean (e.g., Snyder et al. 1992; Shearer et al. 2006; Elardo et al. 2011). The ilm-cpx rich layer included a higher abundance of incompatible elements (radiogenic elements) owing to their formation in the later stages of the magma ocean crystallization, and has a relatively higher density than the underlying ol-opx cumulate layer. This gravitational instability in the early formed lunar mantle triggered a solid-state mantle overturn, causing the ilm-cpx cumulate layer to diapirically sunk to the bottom and correspondingly the ol-opx rich layer rose to the top of the mantle (Ringwood and Kesson, 1976; Hess and Parmentier, 1995; Shearer et al. 2006) (Fig. 12B). The mantle overturn occurred at around 4372 ± 35 Ma (Sm-Nd isochron age) during or soon after the solidification of the lunar magma ocean (Sio et al. 2020). As a result of the overturn, the descended ilm-cpx bearing cumulates formed a layer near the core-mantle boundary (e.g., Hess and Parmentier 1995; De Vries et al. 2010). It was suggested that small portions of the early ilm-cpx layer remained in the upper mantle in “pods” (~5-20 km dimensions) while several workers argued of a dynamic mixing of the descending ilm-cpx cumulates with the rising low-Ti ol-opx cumulates (e.g., Hess and Parmentier 1995; Giguere et al. 2000; Elkins-Tanton et al. 2002; De Vries et al. 2010). Petrological models also suggest lateral compositional heterogeneity in the lunar upper mantle compositions (up to 500 km depth) as reflected by the variations in titanium contents of mare basalts (Longhi 1992). This hybrid source region where primordial LMO cumulates mixed during the mantle overturn was suggested to be the source regions of the basaltic magmas (e.g., Shearer et al. 2006).
It was suggested that zones of partial melt, remained in the lunar mantle after initial global melting or generated by radioactive heating, have driven the early mare volcanism spanning Early-Nectarian to Late Imbrian Epoch. The buoyancy, crustal thickness, and impact basin topography were the factors that influence the ascent and eruption of these mare basaltic magmas (Head and Wilson 1992). Due to this mantle heating, magma could be produced at depths up to 400 km (Taylor 1982), and the buoyancy drives it to rise diapirically through the ductile regions of the lunar mantle. The buoyantly rising magma would be trapped at the base of the crust due to the relatively lower density of the lunar crustal materials. Due to the buoyancy trap, the magma diapirs stall at depths below the crust, and subsequent accumulation of excess pressures in the diapirs leads to the propagation of dikes to the surface and eruption (Head and Wilson 1992). The emplacement of low to intermediate-Ti basalts has occurred both in the Mare Grimaldi and Mare Riccioli in the Late Imbrian Epoch. The low to intermediate-Ti magma erupted at 3.47 Ga ago in the Mare Grimaldi might have been derived from the dynamically mixed hybrid source region in the mantle through partial melting of early cumulate materials at depths between