HAL Id: insu-01238228
https://hal-insu.archives-ouvertes.fr/insu-01238228
Submitted on 10 Jul 2020
HAL is a multi-disciplinary open access
archive for the deposit and dissemination of
sci-entific research documents, whether they are
pub-lished or not. The documents may come from
teaching and research institutions in France or
abroad, or from public or private research centers.
L’archive ouverte pluridisciplinaire HAL, est
destinée au dépôt et à la diffusion de documents
scientifiques de niveau recherche, publiés ou non,
émanant des établissements d’enseignement et de
recherche français ou étrangers, des laboratoires
publics ou privés.
Probing the Martian atmosphere with MAVEN/IUVS
stellar occultations
Hannes Gröller, Roger V. Yelle, T. T. Koskinen, Franck Montmessin, Gaetan
Lacombe, Nick M. Schneider, Justin Deighan, A. Ian F. Stewart, Sonal K.
Jain, Michael S. Chaffin, et al.
To cite this version:
Hannes Gröller, Roger V. Yelle, T. T. Koskinen, Franck Montmessin, Gaetan Lacombe, et al..
Prob-ing the Martian atmosphere with MAVEN/IUVS stellar occultations. Geophysical Research Letters,
American Geophysical Union, 2015, 42 (21), pp.9064-9070. �10.1002/2015GL065294�. �insu-01238228�
Probing the Martian atmosphere with MAVEN/IUVS
stellar occultations
H. Gröller1, R. V. Yelle1, T. T. Koskinen1, F. Montmessin2, G. Lacombe2, N. M. Schneider3,
J. Deighan3, A. I. F. Stewart3, S. K. Jain3, M. S. Chaffin3, M. M. J. Crismani3, A. Stiepen3, F. Lefèvre2, W. E. McClintock3, J. T. Clarke4, G. M. Holsclaw3, P. R. Mahaffy5, S. W. Bougher6, and B. M. Jakosky3 1Lunar and Planetary Laboratory, University of Arizona, Tucson, Arizona, USA,2LATMOS, Université Versailles
Saint-Quentin/CNRS, Guyancourt, France,3Laboratory for Atmospheric and Space Physics, University of Colorado Boulder,
Boulder, Colorado, USA,4Center for Space Physics, Boston University, Boston, Massachusetts, USA,5Goddard Space Flight
Center, Greenbelt, Maryland, USA,6Department of Atmospheric, Oceanic, and Space Sciences, University of Michigan,
Ann Arbor, Michigan, USA
Abstract
The first campaign of stellar occultations with the Imaging Ultraviolet Spectrograph (IUVS) instrument on board of Mars Atmosphere and Volatile EvolutioN (MAVEN) mission was executed between 24 and 26 March 2015. From this campaign 13 occultations are used to retrieve CO2and O2numberdensities in the altitude range between 100 and 150 km. Observations probe primarily the low-latitude regions on the nightside of the planet, just past the dawn and dusk terminator. Calculation of temperature from the CO2density profiles reveals that the lower thermosphere is significantly cooler than predicted by
the models in the Mars Climate Database. A systematically cold layer with temperatures of 105–120 K is seen in the occultations at a pressure level around 7 × 10⁻⁶Pa.
1. Introduction
Spacecraft observations of UV stellar occultations have proved to be a powerful technique for the study of upper atmospheric structure and composition. Stellar occultation observations by the Spectroscopy for Inves-tigation of Characteristics of the Atmosphere of Mars (SPICAM) spectrograph on Mars Express (MEX) have been used to map the distribution of CO2, O3, aerosols, and temperature [Montmessin et al., 2006b, 2006a; Lebonnois
et al., 2006; Forget et al., 2009; McDunn et al., 2010; Montmessin, 2013] in the Martian upper atmosphere providing important constraints on the circulation and physical processes controlling atmospheric structure. More recently, Sandel et al. [2015] identified the signature of O2in the SPICAM occultation measurement and
inferred O2mole fractions from 1 × 10⁻³to 5 × 10⁻³in the 90–120 km altitude range. One of the principal
results of these investigations is that the upper atmosphere of Mars is highly variable, requiring dense sam-pling in important geophysical variables (latitude, longitude, local time, solar activity, LS, etc.) to be adequately
understood.
The Imaging Ultraviolet Spectrograph (IUVS) on Mars Atmosphere and Volatile EvolutioN (MAVEN) mission is designed to observe stellar occultations in both the FUV and MUV channels. The FUV measurements are sensitive to CO2, O2, and potentially clouds and aerosols, while the MUV are sensitive to CO2, O3, and clouds
and aerosols. The first occultation campaign was carried out on 24–26 March 2015. We report here results from the FUV measurements. The stellar occultations are an important component of the overall MAVEN science goals because they are one of the two techniques (the other being limb profiles of UV emissions) that connect the upper atmosphere (around 110–200 km), probed by the in situ measurements on MAVEN, with the middle atmosphere (around 45–110 km). The IUVS FUV occultations probe altitudes of ∼100–150 km corresponding to pressures of 10−2to a few times 10−6Pa. This region is critical to an understanding of the Mars atmosphere
because it encompasses the upper mesosphere, the mesopause (∼100 km), the homopause (∼125 km), and the lower thermosphere. Eventually, if we are able to understand this region, we will have gone a long way toward understanding the processes that control the exospheric temperature. This is critical for atmospheric escape rates, the ultimate goal of the MAVEN investigation. A complete overview of the MAVEN mission can be found in Jakosky et al. [2015].
RESEARCH LETTER
10.1002/2015GL065294
Special Section:
First Results from the MAVEN Mission to Mars
Key Points:
• First results of FUV stellar occultations taken with the IUVS instrument onboard MAVEN
• Temperature profiles reveals that the lower thermosphere is significantly cooler than predicted
• Detection of CO2and O2number
densities
Correspondence to:
H. Gröller, [email protected]
Citation:
Gröller, H., et al. (2015), Prob-ing the Martian atmosphere with MAVEN/IUVS stellar occultations,
Geophys. Res. Lett., 42, 9064–9070,
doi:10.1002/2015GL065294.
Received 9 JUL 2015 Accepted 11 SEP 2015 Published online 5 NOV 2015
©2015. American Geophysical Union. All Rights Reserved.
Geophysical Research Letters
10.1002/2015GL065294
2. IUVS Stellar Occultations
The FUV channel of the IUVS covers the 110 to 190 nm spectral range with an intrinsic spectral resolution of 0.6 nm [McClintock et al., 2014]; however, to reduce the data volume, four spectral pixels are binned to produce an effective sampling of 0.33 nm. Spatial imaging is not necessary for occultations, but 20 spatial lines are returned with each line corresponding to 6 spatial pixels in order to characterize instrument performance and background levels. The stellar signal is strongly concentrated in the central line with the other lines providing a measurement of background signal levels due to stray light and emissions from Mars. The signal is recorded with a cadence of 2.6 s consisting of 2 s of integration time and 0.6 s of overhead (detector readout, etc.). This sampling rate corresponds to an altitude resolution between 1.5 and 4.5 km, depending on the geometry of the particular occultation.
The transmission of the atmosphere is calculated by dividing the spectra observed along lines of sight that penetrate the atmosphere by spectra recorded outside the atmosphere. Absorption signatures are present in the IUVS/FUV occultations up to altitudes of ∼160 km; therefore, we use the regions higher than 180 km to define an average unattenuated spectrum. Often, in the analysis of spacecraft occultations, it is necessary to shift the unattenuated spectrum before division to account for spectral shifts associated with changes in spacecraft inertial point during the occultation. The spectral shifts are best determined from the data itself, through the time dependence of wavelength shifts of features in the stellar spectrum. The MAVEN occulta-tions are quite stable, and only in rare cases do we see any evidence for a spectral shift between the reference spectrum and attenuated spectra; thus, this correction is unnecessary for most of the data shown here. The occultations are observed through the large “keyhole” at the end of the IUVS slit, which has an angular size of 0.69∘ by 0.90∘ [McClintock et al., 2014]. Because of the large size of the keyhole it admits significant radiation from the extended emissions from the Mars atmosphere, especially from the bright H Lyman α line at 121.6 nm. This contribution is easily recognized through its extended spatial signature and is subtracted off as background. As the H Lyman α background is also present at lower altitudes and constant with altitude, a mean value over altitudes where all the stellar signal is already absorbed is used for the correction. Background due to stray light and thermal noise on the detector is also subtracted from the data prior to calculation of the transmission, but these corrections are quite small.
The MAVEN stellar occultations are executed in dedicated campaigns that are scheduled to take place every other month. Each campaign lasts for five consecutive orbits, which is equivalent to one planetary rotation and provides complete longitudinal coverage. Different stars (see Table 1 for stars used in the first campaign) are targeted to obtain latitudinal and local time coverage. As they are periods of intense activity, the normal oper-ation of the MAVEN spacecraft is suspended during the execution of these campaigns. In this first campaign a total of 60 occultations during five orbits were attempted by targeting 12 stars during each orbit. Because of an unforeseen timing problem some of the occultations are compromised and only 13 occultations are used here to retrieve CO2and O2number densities. Only 10 occultations have sufficient altitude sampling to
per-mit calculation of temperature and pressure profiles. Stars, orbit number, and the corresponding geometry of the occultations in the first stellar campaign are listed in Table 1. The data can be found in the Planetary Data System (PDS:http://atmos.nmsu.edu/data_and_services/atmospheres_data/MAVEN/maven_iuvs.html) (PDS) with the filename identifier v02_r01. This occultation campaign probes the atmosphere primarily on the nightside of the planet, just past the terminator at equatorial and midlatitude regions. The signal-to-noise ratio (SNR) per spectral bin is ∼22 near 130 nm, where the IUVS sensitivity is a maximum and the CO2band
are detected, decreasing to ∼6 near 165 nm where the IUVS sensitivity has fallen to roughly half its peak value. Our analysis approach builds on previous experience with occultation analysis [Montmessin et al., 2006b; Koskinen et al., 2011; Capalbo et al., 2013; Sandel et al., 2015]. The measured transmission spectra is fitted at each altitude assuming absorption by CO2and O2and using the Levenberg-Marquardt algorithm to retrieve
the best fit column densities. We use CO2cross sections in the wavelength range from 106 nm to 192 nm
composed from measurements of Stark et al. [2007], Yoshino et al. [1996], and Parkinson et al. [2003]. For O2
we used again a composed absorption cross section from Ogawa and Ogawa [1975], Lu et al. [2010], Yoshino et al. [2005], and Minschwaner et al. [1992]. As no cross sections for the temperature of interest are available, a semilogarithmic extrapolation is used to get absorption cross sections for 130 K. A detailed description of the absorption cross sections and their small sensitivity to the temperature dependency can be found in Sandel et al. [2015]. Column density profiles obtained from spectral fits are inverted to get the corresponding local densities by using the Tikhonov regularization method [Quémerais et al., 2006; Sandel et al., 2015]. For the
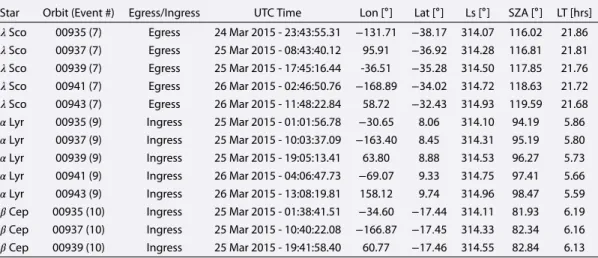
Table 1. Observation Geometry for Occultations Recorded During the First Stellar Campaigna
Star Orbit (Event #) Egress/Ingress UTC Time Lon [∘] Lat [∘] Ls [∘] SZA [∘] LT [hrs]
𝜆Sco 00935 (7) Egress 24 Mar 2015 - 23:43:55.31 −131.71 −38.17 314.07 116.02 21.86
𝜆Sco 00937 (7) Egress 25 Mar 2015 - 08:43:40.12 95.91 −36.92 314.28 116.81 21.81
𝜆Sco 00939 (7) Egress 25 Mar 2015 - 17:45:16.44 -36.51 −35.28 314.50 117.85 21.76
𝜆Sco 00941 (7) Egress 26 Mar 2015 - 02:46:50.76 −168.89 −34.02 314.72 118.63 21.72
𝜆Sco 00943 (7) Egress 26 Mar 2015 - 11:48:22.84 58.72 −32.43 314.93 119.59 21.68
𝛼Lyr 00935 (9) Ingress 25 Mar 2015 - 01:01:56.78 −30.65 8.06 314.10 94.19 5.86
𝛼Lyr 00937 (9) Ingress 25 Mar 2015 - 10:03:37.09 −163.40 8.45 314.31 95.19 5.80
𝛼Lyr 00939 (9) Ingress 25 Mar 2015 - 19:05:13.41 63.80 8.88 314.53 96.27 5.73
𝛼Lyr 00941 (9) Ingress 26 Mar 2015 - 04:06:47.73 −69.07 9.33 314.75 97.41 5.66
𝛼Lyr 00943 (9) Ingress 26 Mar 2015 - 13:08:19.81 158.12 9.74 314.96 98.47 5.59
𝛽Cep 00935 (10) Ingress 25 Mar 2015 - 01:38:41.51 −34.60 −17.44 314.11 81.93 6.19
𝛽Cep 00937 (10) Ingress 25 Mar 2015 - 10:40:22.08 −166.87 −17.45 314.33 82.34 6.16
𝛽Cep 00939 (10) Ingress 25 Mar 2015 - 19:41:58.40 60.77 −17.46 314.55 82.84 6.13 aThe given times and geophysical parameters are given for the beginning of the occultations. The used stars are Beta Cephei (𝛽Cep), Lambda Scorpii (𝜆Sco), and Alpha Lyrae (𝛼Lyr).
vertical inversion, convergence is achieved when the relative difference between the two latest iterations is lower than 10−3. A smoothing coefficient of 0.4 was chosen empirically to balance the smoothing of
measurement noise while preserving real atmospheric perturbations.
3. Results
An example of a measured transmission spectra obtained during the occultation of𝜆 Sco on orbit 00943 are shown in Figure 1 (top). The colored lines show the fitted model transmission spectra using CO2and O2as
possible absorbers. Figure 1 (bottom) shows the residuals between models and measurements. With the𝜒2
𝜈
statistics and the F test we are confident that O2can be detected. Visual examination of these spectra reveal
the presence of an O2absorption feature at 120.6 nm as well as the characteristic vibrational structure of
the CO2bands. The presence of the O2feature at 120.6nm confirms the detection of O2discussed in Sandel
et al. [2015] which was based only on the broadband spectral influence seen in the lower resolution SPICAM/ MEX spectra.
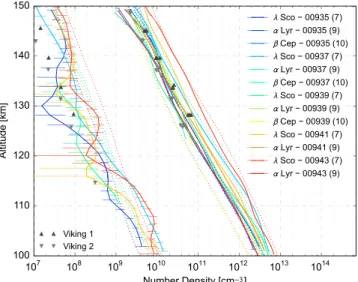
The CO2and the O2abundance can be measured for𝜆 Sco, the brightest star in this campaign, but only CO2 for𝛼 Lyr and 𝛽 Cep. For these fainter stars the H Lyman α airglow transmitted through the keyhole swamps the stellar signal near 120.6 nm and the O2absorption feature cannot be measured. The altitude dependent CO2 and O2number density profiles retrieved from the occultations are listed in Table 1 and shown in Figure 2. Figure 2 also shows densities obtained from the Mars Climate Database (MCD), version 5.2, for the same latitude, longitude, local time, and LS as for the observations. The MCD is a collection of model
predictions using the Laboratoire de Meteorologie Dynamique - General Circulation Model (LMD-GCM) [González-Galindo et al., 2009]. An overview of the Mars Climate Database can be found in Millour et al. [2014]. The F10.7 solar flux at the time of the first occultation campaign was 138. Because MCD
simu-lations for the current Mars year are not yet available, we compare our results to MCD profiles for the Martian Year (MY) 26 because the average F10.7index for this year (140–150) for the LS= 300–330 period is sim-ilar to that of the observations. Both observed and model CO2densities exhibit significant variability among the different occultations but are roughly consistent within this variability. Our results are also consistent with the Viking measurements [Nier and McElroy, 1977] and the recently published O2profiles obtained from stellar occultations taken with SPICAM/MEX [Sandel et al., 2015]. Our retrieved O2mixing ratios are between 1.5×10⁻³
and 5 × 10⁻³which is in agreement with the mixing ratios published recently in Sandel et al. [2015] and
previ-ous observations by Viking 1 and 2. The O2densities inferred from the occultation appear to be systematically lower than predicted by the MCD models, though the difference is smaller than the variability.
The temperature profile for each occultation is calculated by applying the hydrostatic equilibrium constraint to the local CO2densities and using the algorithm described in Snowden et al. [2013]. Results are shown
Geophysical Research Letters
10.1002/2015GL065294
Figure 1. (top) Measured transmission spectra (dots) including their uncertainties (vertical bars) and the model fits
(solid lines) for𝜆Sco orbit number 00943 for several values of the impact point/tangent altitude along the line of sight to the star. The inset indicates the position of the O2absorption feature at 120.6 nm. (bottom) The residuals between models and measurements for an altitude of 121.63 km. Including O2reduces the residuals where absorption is significant and the F test demonstrate the statistical significance in the residuals.
Calculation of the temperature profile from the density profile also requires specification of an upper bound-ary condition. We consider several choices. The green curves show calculations based on the assumption that the temperature at the upper boundary is equal to the temperature at the equivalent altitude for models in the MCD corresponding to the latitude, longitude, and local time for the particular occultation. The results are unsatisfactory because, for most profiles, there is a significant difference in slope between the retrieved tem-perature profile and the MCD profile at the upper boundary leading to large temtem-perature differences at lower
Figure 2. CO2and O2number densities obtained from IUVS (solid lines) including their uncertainties. For CO2some of the formal uncertainties are too small to be seen. In addition, there is a systematic uncertainty of∼10% due to the absorption cross section. Profiles are labeled by the star occulted and MAVEN orbit number the corresponding event number in parentheses. Viking 1 and 2 (gray upright and upside down triangles) measurements taken from Nier and
McElroy [1977] and modeled profiles from the Mars Climate Database (dotted lines) are also shown. More detail about
Figure 3. Temperature profiles inferred from the CO2densities. (a–j) Results from a single occultation. The red curves show temperature profiles calculated using the NGIMS profile [Mahaffy et al., 2015] (yellow line) as upper boundary conditions. The green curves show temperature profiles calculated using the MCD profile [Millour et al., 2014] (blue line) for the latitude, longitude, and local time of the occultation as upper boundary conditions. The shaded areas illustrate the uncertainties, calculated from the propagation of the errors from the density measurements.
altitudes. Better results are obtained by utilizing temperatures determined from NGIMS measurements during the first deep dip campaign to define the upper boundary [Mahaffy et al., 2015]. During a deep dip, the lowest altitude of MAVEN periapse is roughly 125 km; ∼25 km lower than during normal science mapping. The solar zenith angle during this deep dip was close to 110∘, roughly consistent with that for the occultations listed in Table 1. The NGIMS and IUVS occultation measurements are complimentary in the sense that NGIMS measures the atmosphere at lower pressures and IUVS occultations at higher pressures and, for the best occultations, the measurement regions nearly overlap. Using the NGIMS temperature as the upper boundary temperature produces the red curves in Figure 3. With either boundary conditions, most profiles exhibit significant departures from the MCD models.
To investigate this problem further, we show in Figure 4 the average temperature profiles for the𝜆 Sco and 𝛼 Lyr occultations and their uncertainties calculated as the standard deviation of the mean along with com-parable averages from the MCD database. Repeated observations of a star sample different longitudes but similar latitudes and local times. We can therefore calculate a rough longitude coverage by taking the mean of all occultations of a star. We calculate the means on a pressure grid rather than an altitude grid to account for possible variations in the lower atmosphere. The average IUVS profiles are calculated using the NGIMS upper boundary condition. The averaging procedure removes longitude variations and much of the small-scale, wave-like structure in the profiles. The mean profiles obtained using the MCD upper boundary are quite similar (differences smaller than measurement uncertainty) and so are not shown in Figure 4.
The temperature profiles exhibit several interesting features. There is a temperature minimum at around 110 km, equivalent to ∼10−3Pa, which is at a slightly higher pressure than the mesopause predicted by the
MCD models. Throughout this region, from 100–125 km (from 10−2to 10−4Pa in pressure space), the
mea-sured and predicted temperatures are in fairly good agreement, with the measurements slightly colder, by less than 10–20 K, than the models. This difference is comparable with or even smaller than the variability in the
Geophysical Research Letters
10.1002/2015GL065294
Figure 4. The average temperature profile for the𝜆Sco (blue) and𝛼Lyr (green) occultations calculated using NGIMS (solid) to define the upper boundary temperature along with the average of the MCD (version 5.2) profiles [Millour et al., 2014] (dashed) for this set of occultations. The blue and green shaded areas represent the uncertainties calculated as the standard deviation of the mean. NGIMS results [Mahaffy et al., 2015] are shown as the red curve.
measured profiles. The standard deviation in this altitude range is between 10 and 25 K for the𝜆 Sco occulta-tions (latitude of −35∘N) and around 10 K for𝛼 Lyr occultations (latitude of 9∘N). Larger differences develop at higher altitudes. The model temperatures increase steadily from the mesopause, eventually reaching an exo-spheric temperature of 150 K and 190 K for mean latitudes of around −35∘N and 9∘N, respectively, while the measured temperatures decrease at pressures less than 3.5×10⁻⁵Pa (around 135 km) reaching another
mini-mum near 7×10⁻⁶Pa (around 145 km). The difference between the average of the data and the average of the
model at this level reaches 50 K, which corresponds to a difference up to 50% of the measured temperature. A similar temperature difference was noted by McDunn et al. [2010], Figure 8, in their comparison of MEX/SPICAM occultation results to MGCM-MTGCM model [Bougher et al., 2004, 2006, 2008]; however, the McDunn et al. [2010] analysis was limited to pressures greater than 10−4Pa. Our results show that the difference
continues to increase with decreasing pressure to the large values mentioned above. Eventually, as shown in the NGIMS profile, the atmospheric temperature increases to values of ∼275 K, which is significantly higher than the exospheric temperature in the model, while the temperature rise occurs at significantly lower pres-sures than predicted by the MCD models. The differences shown here are similar in shape but much larger in magnitude than that between GCM predictions and temperatures derived from accelerometer measurements on the Mars Reconnaissance Orbiter [Keating et al., 2008].
4. Summary and Discussion
The results reported here suggest that there is considerable variability in the temperature gradient in the lower thermosphere and that we do not yet adequately understand this region of the Mars atmosphere. The failure of the models to predict the structure of the thermosphere indicates that the energy balance in the models does not represent that of the Martian thermosphere. With the limited observations to date it is difficult to pinpoint the reason for the disagreement. This first campaign probed only the nightside. The tem-peratures in this region are maintained by the transport of heat from the dayside to nightside. The fact that the observed temperatures are cooler than predicted may indicate that the day-night flow is overestimated in the models. Alternatively, the radiative cooling rates in the atmosphere may be larger than that contained in the models causing the lower thermosphere to cool faster than predicted [McDunn et al., 2010]. A more recent study by Medvedev et al. [2015] showed that enhanced CO215 μm cooling due to elevated O densities together
with gravity wave-induced cooling leads to temperature decreases of ∼20 K at high latitudes and ∼5 K at equatorial latitudes. Although significantly smaller than the discrepancies found here our results suggest that these mechanisms deserve further investigation. An important question is whether these cool nightside temperatures imply large day/night temperature differences at these levels or whether the lower thermo-sphere on the dayside is likewise surprisingly cool at these levels. If large day/night temperature differences do exist, they imply strong pressure forces that should alter the circulation of the upper atmosphere.
Finally, there is the question of whether the temperatures derived here are stable long-term features of the Martian atmosphere. Fortunately, future occultation campaigns will both probe the dayside atmosphere and further investigate the nightside, and we can look forward to observations shedding new light on this interesting discovery.
References
Bougher, S. W., S. Engel, D. P. Hinson, and J. R. Murphy (2004), MGS Radio Science electron density profiles: Interannual variability and implications for the Martian neutral atmosphere, J. Geophys. Res., 109, E03010, doi:10.1029/2003JE002154.
Bougher, S. W., J. M. Bell, J. R. Murphy, M. A. López Valverde, and P. G. Withers (2006), Polar warming in the Mars thermosphere: Seasonal variations owing to changing insolation and dust distributions, Geophys. Res. Lett., 33, L02203, doi:10.1029/2005GL024059.
Bougher, S. W., P.-L. Blelly, M. Combi, J. L. Fox, I. Mueller-Wodarg, A. Ridley, and R. G. Roble (2008), Neutral upper atmosphere and ionosphere modeling, Space Sci. Rev., 139(1), 107–141.
Capalbo, F. J., Y. Bénilan, R. V. Yelle, T. T. Koskinen, B. R. Sandel, G. M. Holsclaw, and W. E. McClintock (2013), Solar occultation by Titan measured by Cassini/UVIS, Astrophys. J. Lett., 766(2), L16, doi:10.1088/2041-8205/766/2/L16.
Forget, F., F. Montmessin, J.-L. Bertaux, F. González-Galindo, S. Lebonnois, A. Reberac, E. Dimarellis, and M. A. López-Valverde (2009), Density and temperatures of the upper Martian atmosphere measured by stellar occultations with Mars Express SPICAM, J. Geophys. Res., 114, E01004, doi:10.1029/2008JE003086.
González-Galindo, F., F. Forget, M. A. López-Valverde, M. Angelats i Coll, and E. Millour (2009), A ground-to-exosphere Martian general circulation model: 1. Seasonal, diurnal, and solar cycle variation of thermospheric temperatures, J. Geophys. Res., 114, E04001, doi:10.1029/2008JE003246.
Jakosky, B. M., et al. (2015), The Mars Atmosphere and Volatile Evolution (MAVEN) mission, Space Sci. Rev., doi:10.1007/s11214-015-0139-x. Keating, G., S. Bougher, R. A. M. Theriot, and R. Tolson (2008), Properties of the Mars upper atmosphere derived from accelerometer
measurements, paper presented at 37th COSPAR Scientific Assembly, 1478 pp., Montréal, Canada, 13–20 Jul. [Available at http://adsabs.harvard.edu/abs/2008cosp...37.1478K.]
Koskinen, T. T., R. V. Yelle, D. S. Snowden, P. Lavvas, B. R. Sandel, F. J. Capalbo, Y. Benilan, and R. A. West (2011), The mesosphere and lower thermosphere of Titan revealed by Cassini/UVIS stellar occultations, Icarus, 216(2), 507–534.
Lebonnois, S., E. Quémerais, F. Montmessin, F. Lefèvre, S. Perrier, J.-L. Bertaux, and F. Forget (2006), Vertical distribution of ozone on Mars as measured by SPICAM/Mars Express using stellar occultations, J. Geophys. Res., 111, E09S05, doi:10.1029/2005JE002643.
Lu, H. C., H. K. Chen, H. F. Chen, B. M. Cheng, and J. F. Ogilvie (2010), Absorption cross section of molecular oxygen in the transition E3Σ−uv = 0 − X3Σ−
gv = 0at 38 K, Astron. Astrophys., 520, A19, doi:10.1051/0004-6361/201013998.
Mahaffy, P. R., M. Benna, M. Elrod, R. V. Yelle, S. W. Bougher, S. W. Stone, and B. M. Jakosky (2015), Structure and composition of the neutral upper atmosphere of Mars from the MAVEN NGIMS investigation, Geophys. Res. Lett., 42, doi:10.1002/2015GL065329.
McClintock, W. E., N. M. Schneider, G. M. Holsclaw, J. T. Clarke, A. C. Hoskins, I. Stewart, F. Montmessin, R. V. Yelle, and J. Deighan (2014), The Imaging Ultraviolet Spectrograph (IUVS) for the MAVEN Mission, Space Sci. Rev., doi:10.1007/s11214-014-0098-7.
McDunn, T. L., S. W. Bougher, J. Murphy, M. D. Smith, F. Forget, J.-L. Bertaux, and F. Montmessin (2010), Simulating the density and thermal structure of the middle atmosphere (∼80–130 km) of Mars using the MGCM-MTGCM: A comparison with MEX/SPICAM observations,
Icarus, 206(1), 5–17.
Medvedev, A. S., F. González-Galindo, E. Yi ˘git, A. G. Feofilov, F. Forget, and P. Hartogh (2015), Cooling of the Martian thermosphere by CO2 radiation and gravity waves: An intercomparison study with two general circulation models, J. Geophys. Res. Planets, 120, 913–927, doi:10.1002/2015JE004802.
Millour, E., et al. (2014), A new Mars Climate Database v5.1, in The Fifth International Workshop on the Mars Atmosphere: Modelling and
Observation, held in Oxford, 13–16 January, edited by F. Forget and E. Millour, 1301 pp.
Montmessin, F. (2013), Transport-driven formation of a polar ozone layer on Mars, Nat. Geosci., 6(11), 1–4.
Montmessin, F., F. Forget, J.-L. Bertaux, E. Quémerais, O. I. Korablev, S. Perrier, D. Fussen, S. Lebonnois, A. Reberac, and E. Dimarellis (2006a), Subvisible CO2ice clouds detected in the mesosphere of Mars, Icarus, 183(2), 403–410.
Montmessin, F., E. Quémerais, J.-L. Bertaux, O. Korablev, P. Rannou, and S. Lebonnois (2006b), Stellar occultations at UV wavelengths by the SPICAM instrument: Retrieval and analysis of Martian haze profiles, J. Geophys. Res., 111, E09S09, doi:10.1029/2005JE002662.
Minschwaner, K., G. P. Anderson, L. A. Hall, and K. Yoshino (1992), Polynomial coefficients for calculating O2Schumann-Runge cross sections at 0.5 cm−1resolution, J. Geophys. Res., 97(D9), 10,103–10,108.
Nier, A. O., and M. B. McElroy (1977), Composition and structure of Mars’ upper atmosphere—Results from the neutral mass spectrometers on Viking 1 and 2, J. Geophys. Res., 82(28), 4341–4349.
Ogawa, S., and M. Ogawa (1975), Absorption cross sections of O2(a1Δg)and O2(X3Σ−
g)in the region from 1087 to 1700 Å, Can. J. Phys.,
53(19), 1845–1852.
Parkinson, W. H., J. Rufus, and K. Yoshino (2003), Absolute absorption cross section measurements of in the wavelength region 163–200 nm and the temperature dependence, Chem. Phys., 290(2–3), 251–256.
Quémerais, E., J.-L. Bertaux, O. Korablev, E. Dimarellis, C. Cot, B. R. Sandel, and D. Fussen (2006), Stellar occultations observed by SPICAM on Mars Express, J. Geophys. Res., 111, E09S04, doi:10.1029/2005JE002604.
Sandel, B. R., H. Gröller, R. V. Yelle, T. Koskinen, N. K. Lewis, J.-L. Bertaux, F. Montmessin, and E. Quémerais (2015), Altitude profiles of O2 on Mars from SPICAM stellar occultations, Icarus, 252, 154–160.
Snowden, D., R. V. Yelle, J. Cui, J. E. Wahlund, N. J. T. Edberg, and K. Ågren (2013), The thermal structure of Titan’s upper atmosphere. I: Temperature profiles from Cassini INMS observations, Icarus, 226(1), 552–582.
Stark, G., K. Yoshino, P. L. Smith, and K. Ito (2007), Photoabsorption cross section measurements of CO2between 106.1 and 118.7 nm at 295 and 195 K, J. Quant. Spectros. Radiat. Transfer, 103(1), 67–73.
Yoshino, K., Y. Sun, J. R. Esmond, W. H. Parkinson, K. Ito, and T. Matsui (1996), Absorption cross section measurements of carbon dioxide in the wavelength region 118.7–175.5 nm and the temperature dependence, J. Quant. Spectros. Radiat. Transfer, 55(1), 53–60.
Yoshino, K., W. H. Parkinson, K. Ito, and T. Matsui (2005), Absolute absorption cross-section measurements of Schumann-Runge continuum of O2at 90 and 295 K, J. Mol. Spectrosc., 229(2), 238–243.
Acknowledgments
The MAVEN project is supported by NASA through the Mars Exploration Program. A. Stiepen is supported the Belgian American Educational Founda-tion and the Rotary District 1630. The data used are archived in the Planetary Atmospheres Node of the Planetary Data System. The authors wish to thank Francisco González-Galindo and an anonymous reviewer, whose constructive comments helped to improve the paper.
The Editor thanks Francisco Gonzalez Galindo and an anonymous reviewer for their assistance in evaluating this paper.