HAL Id: hal-00299166
https://hal.archives-ouvertes.fr/hal-00299166
Submitted on 3 Mar 2005
HAL is a multi-disciplinary open access
archive for the deposit and dissemination of
sci-entific research documents, whether they are
pub-lished or not. The documents may come from
teaching and research institutions in France or
abroad, or from public or private research centers.
L’archive ouverte pluridisciplinaire HAL, est
destinée au dépôt et à la diffusion de documents
scientifiques de niveau recherche, publiés ou non,
émanant des établissements d’enseignement et de
recherche français ou étrangers, des laboratoires
publics ou privés.
Morphometry and kinematics of landslides inferred from
precise DTMs in West Belgium
O. Dewitte, A. Demoulin
To cite this version:
O. Dewitte, A. Demoulin. Morphometry and kinematics of landslides inferred from precise DTMs in
West Belgium. Natural Hazards and Earth System Science, Copernicus Publications on behalf of the
European Geosciences Union, 2005, 5 (2), pp.259-265. �hal-00299166�
SRef-ID: 1684-9981/nhess/2005-5-259 European Geosciences Union
© 2005 Author(s). This work is licensed under a Creative Commons License.
and Earth
System Sciences
Morphometry and kinematics of landslides inferred from precise
DTMs in West Belgium
O. Dewitte and A. Demoulin
Department of Physical Geography and Quaternary, University of Li`ege, All´ee du 6 Aoˆut, 2, Sart Tilman (Bˆat. B11), 4000 Li`ege, Belgium
Received: 17 September 2004 – Revised: 8 February 2005 – Accepted: 21 February 2005 – Published: 3 March 2005 Part of Special Issue “Landslides and debris flows: analysis, monitoring, modeling and hazard”
Abstract. The Flemish Ardennes (W Belgium) are known to
be affected by deep-seated landslides. The assessment of the landslide reactivation hazard requires understanding the driv-ing processes and delimitdriv-ing precisely not only the landslide boundaries but especially that of their most active parts.
Precise 3D models of 13 landslides were produced by dig-ital stereophotogrammetry using aerial photographs of dif-ferent dates. Dealing with photographs at the scale 1:25 000 or larger, we obtained for each model an accuracy better than 0.5 m.
As a first result, the main size parameters of the landslides (width, length, depth, volume, ...) are easily computed.
Moreover, the obtained DTMs may be subtracted from each other in order to determine the apparent vertical dis-placement of each pixel during the interval of time consid-ered. Provided that more than 2 epochs are documented, such DTMs not only supply precise information about distribution and style of the landslide activity but may also point to tem-poral variations in this activity.
The subtraction of DTMs allows us to give an estimation of the volume of the “uplifted” and “collapsed” terrains be-tween two epochs.
1 Introduction
The assessment of the landslide (re)activation hazard re-quires understanding the driving processes and delimiting precisely not only their boundaries and but especially that of their most active parts.
The first step of this study consisted in producing precise DTMs of 13 landslides of the Flemish Ardennes (W Bel-gium) in order to determine their morphometric parameters (length, height, volume).
In order to include some kinematic information within a landslide hazard susceptibility map, we also tried to estimate
Correspondence to: O. Dewitte
landslide motion in the medium term (i.e. a few decades) by comparing precise landslide topography reconstructions at different epochs. Moreover, this technique allows us to estimate the mass volumes involved in reactivation.
As shown by Kerle (2002) it is very important to use reli-able DTMs. This is why we had to produce our own DTMs, since the accuracy of the available topographical maps and commercial DTMs of the area is not sufficient.
2 Study area
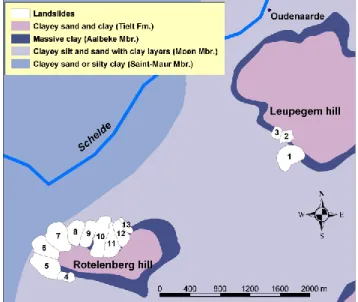
Two hilly regions are known to be affected by deep-seated landslides in Belgium, respectively the Pays de Herve to the east (Demoulin and Pissart, 2001; Demoulin et al., 2003) and the Flemish Ardennes to the west of Belgium (Vanmaercke-Gottigny, 1980; Vanpaemel et al., 2000; Ost et al., 2003; Van Den Eeckhaut et al., 2005). The Flemish Ardennes (Fig. 1) is a landslide-prone area of about 420 km2in which 135 deep-seated landslides have been mapped by Ost et al. (2003) and Van Den Eeckhaut et al. (2005). The Flemish Ardennes has altitudes ranging between 20 and 150 m. This study focuses on two hills situated along the river Schelde close to the town of Oudenaarde (Figs. 1 and 2). These 60-m-high hills culmi-nate between 75 and 85 m. In the north, the Leupegem hill is affected by 3 landslides. To the south, 10 landslides devel-oped on the slopes of the Rotelenberg hill.
These 13 landslides extend in subhorizontal (dip to the north <1◦)Eocene sediments composed of alternating clays and clayey sands on which a perched water table can develop. Within these formations, the Aalbeke Member consists of 10-m-thick homogeneous blue massive clays, and has been recognized as the layer most sensitive to landsliding (Fig. 2).
3 Methodology
Several morphological features (fresh scarps, tilted trees) point to recent reactivations of the landslides. However, the displacements generally do not exceed a few meters, so that
260 O. Dewitte and A. Demoulin: Morphometry and kinematics of landslides
Fig. 1. Location map of the study area.
Table 1. Main characteristics of the photograph negatives used for the digital photogrammetry and overall RMS error at each DTM.
Aerial photographs 1996 1973 1952
Date 15 April 27 April 17 April
Scale ∼1:20 500 ∼1:18 500 ∼1:25 000
DTMs RMS error (cm) 48 39 64
DTMs with a vertical accuracy better than 1 m are needed to map them correctly.
Precise DTMs of the 13 landslides have been obtained by digital stereophotogrammetry using aerial photographs at various image scales between 1:18 500 and 1:25 000 of three different periods (Table 1). The system used to construct the DTMs is the LH Systems SOCET SET digital photogram-metric software. The photograph negatives were scanned with an LH Systems DSW 300 precision scanner with a pixel resolution of 12.5 µm that corresponds to a ground resolution of approximately 20 to 30 cm. The interior orientation was performed by using the parameters of the camera established by the geometric calibration. These include the location of the principal point, the focal length and the radial distortion. We used the fiducial marks imaged on each photo to relate an image point to this calibrated geometry. The final accuracy of the interior orientation is higher than 10 cm, so that the RMS error of this orientation will not act significantly upon the final accuracy of the stereomodels.
The aerotriangulation of the obtained digital photos was carried out by using the bundle block adjustment method. It is an iterative method based on the use of photo coordinates as observations thanks to what the relative orientation and the absolute orientation are obtained simultaneously (Kraus and Waldh¨ausl, 1994). The absolute orientation of the block adjustment requires the use of ground control points. More-over, it must be accurate enough to reflect the actual state of the ground surface. The block adjustment accuracy was
Fig. 2. Location of the landslides of the Leupegem and Rotelenberg. The boundaries of the 13 landslides are shown in white with the lithology.
evaluated using check points with known coordinates, but not used as control in the solution. About 25 ground control points and check points acquired by global positioning sys-tem (GPS) were used for the adjustment. The measurements were carried out by differential GPS in rapid static mode in-volving baselines of a few km length. The uncertainty on the baseline components (N, E, and Up) is of ∼2–3 cm. Abso-lute positioning of the control and check points relies on the inclusion of five IGN points of known coordinates within the GPS network. The final uncertainty on the coordinates of the control and check points do not exceed 10 cm, thus remain-ing far below that of the block adjustment. We built firstly the stereomodel of the epoch 1996. The two other stereomodels were then constructed by including the orientation parame-ters of 1996. The global RMS error obtained range between
∼20 cm and 55 cm for the three stereomodels.
Since the automatic terrain extraction methods within SOCET SET were not able to provide sufficiently accurate DTM in many places, especially in the numerous forested areas of the study area, the stereoscopic data capture of spot heights (ground points) and breaklines (scarps, roads, wa-ter bodies) on the landscape surface was performed by eye, by manually adjusting a floating mark until it touched the surface viewed in stereo. The spot heights were extracted approximately every 5 to 10 m. These spot heights and breaklines (which depict abrupt changes in elevation and in-crease the accuracy of the DTMs) were interpolated with SURFER 8.0 by kriging for a DTM generation in the form of a 2 m×2 m grid. The kriging parameters used to interpo-late the DTMs were determined on the basis of variograms. The mean errors of the kriging interpolations are ∼40 cm.
The DTMs were then measured and subtracted from each other to describe the morphology and the kinematics of the landslides.
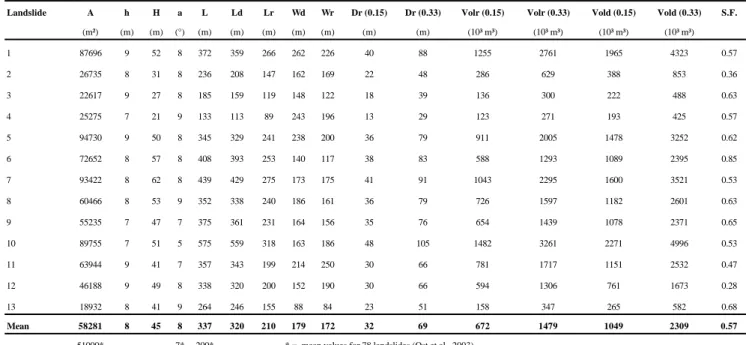
Table 2. Morphometric measurements obtained from the 1996 DTM for the 13 landslides of the Leupegem and Rotelenberg hills.
Landslide A h H a L Ld Lr Wd Wr Dr (0.15) Dr (0.33) Volr (0.15) Volr (0.33) Vold (0.15) Vold (0.33) S.F.
(m²) (m) (m) (°) (m) (m) (m) (m) (m) (m) (m) (10³ m³) (10³ m³) (10³ m³) (10³ m³) 1 87696 9 52 8 372 359 266 262 226 40 88 1255 2761 1965 4323 0.57 2 26735 8 31 8 236 208 147 162 169 22 48 286 629 388 853 0.36 3 22617 9 27 8 185 159 119 148 122 18 39 136 300 222 488 0.63 4 25275 7 21 9 133 113 89 243 196 13 29 123 271 193 425 0.57 5 94730 9 50 8 345 329 241 238 200 36 79 911 2005 1478 3252 0.62 6 72652 8 57 8 408 393 253 140 117 38 83 588 1293 1089 2395 0.85 7 93422 8 62 8 439 429 275 173 175 41 91 1043 2295 1600 3521 0.53 8 60466 8 53 9 352 338 240 186 161 36 79 726 1597 1182 2601 0.63 9 55235 7 47 7 375 361 231 164 156 35 76 654 1439 1078 2371 0.65 10 89755 7 51 5 575 559 318 163 186 48 105 1482 3261 2271 4996 0.53 11 63944 9 41 7 357 343 199 214 250 30 66 781 1717 1151 2532 0.47 12 46188 9 49 8 338 320 200 152 190 30 66 594 1306 761 1673 0.28 13 18932 8 41 9 264 246 155 88 84 23 51 158 347 265 582 0.68 Mean 58281 8 45 8 337 320 210 179 172 32 69 672 1479 1049 2309 0.57
51000* 7* 200* * = mean values for 78 landslides (Ost et al., 2003)
4 Results
Six DTMs (3 different dates for each investigated hill) have been produced with an overall RMS error of ∼50 cm (Ta-ble 1). Figures 3 and 4 show the morphology of the 13 coa-lescent deep-seated landslides in 1996.
4.1 Morphometry and static data
The morphometric parameters presented in Table 2 were ei-ther measured directly on the 1996 DTMs, or derived from other parameters.
The landslide area A, the maximum h height of the main scarp and H the height of the landslide (difference in ele-vation between the crown and the tip of the landslide) were first obtained. As exemplified for a particular landslide of the Leupegem hill (Fig. 5), the morphometric parameters L, Ld,
Lr, Wd, Wr were measured according to the definitions of
the IAEG Commission on Landslides (1990).
The travel angle α of a landslide (Cruden and Varnes, 1996) was computed as:
α =arctan H
Lh
(1) The total length Lhis the horizontal component of the
over-all runout (or travel distance) of the landslide. The measure-ment is taken to approximate best the centre-line of the mass movement. H is the vertical component of the overall runout. The travel angle is related to the mobility and the volume of the landslide (Hutchinson, 1988; Corominas, 1996).
The ground-surface dimensions Wd and Ld of the
dis-placed material, and Wr of the surface of rupture were
mea-sured directly on the DTM. The measurements of Lr present
more difficulties and are less accurate because the toe of the
surface of rupture is not exposed. Cruden (1986) showed that its position could sometimes be estimated from graphical ex-trapolation of the main scarp supported by measurements of displacements within the slipped mass. This technique as well as another proposed by Carter and Bentley (1985) also provide and estimation of Dr, the depth of the rupture
sur-face, and Dd, the depth of the displaced mass. However, site
investigations provide generally a more precise location of slip surfaces (Hutchinson, 1983). Due to lack of informa-tion, Lr was directly estimated on the DTMs by taking the
original slopes around the landslides into account.
The ratio between depth and length of the surface of rup-ture (Dr/Lr)is one of the most used indexes to describe
land-slide processes (Skempton and Hutchinson, 1969; Crozier, 1973; Soeters and Van Westen, 1996). The Dr calculation
is based on the Skempton and Hutchinson (1969)’s results showing that rotational soil slides generally exhibit a ratio,
Dr/Lr, between 0.15 and 0.33.
The initial volume of material before the landslide moved, Volr (Table 2) was computed as (Cruden and Varnes, 1996):
Volr=
1
6π Dr×Wr×Lr (2)
The post-motion volume of the displaced material, Vold
could not be computed with the same accuracy because Dd
was not known. Vold values (Table ) were obtained by
con-sidering that Dd=Dr. Therefore, the volume of the displaced
material is given here by
Vold=
1
6π Dr×Wd×Ld (3)
262 O. Dewitte and A. Demoulin: Morphometry and kinematics of landslides
Fig. 3. The 1996 DTM of the Leupegem hill with location of the landslides 1, 2 and 3.
Volr and Vold were computed with the two extremes
values of Dr found by Skempton and Hutchinson (1969):
Dr=0.15 Lr and 0.33 Lr.
Mass movement is usually associated with dilation and volume increase of the displaced material. The percentage of increase in the volume is called swell factor (S.F. in Ta-ble 2).
The average values of A and of α in Table 2 are similar to those found by Ost et al. (2003) for 78 landslides. However, the total length L of the landslides selected for this study is greater than the average L of all landslides of the Flemish Ardennes.
Several studies (Hutchinson, 1988; Nicoletti and Sorriso-Valvo, 1991; Corominas, 1996) showed that, whatever the mechanism of motion, all movements experience a reduc-tion of travel angle with an increasing volume. Moreover, Corominas (1996) showed that rotational slides display the lowest travel angle values. The travel angle values computed here correspond to those found by Corominas (1996) for ro-tational slides with similar volumes. We also observe that the biggest landslide of our dataset, landslide 10, has the lowest travel angle and that two of the smallest landslides (landslides 4 and 13) show the highest values.
Comparing the volumes before and after landsliding, a
64% swell factor is obtained. This mean value is slightly lower than the 67% proposed by Church (1981) for solid rocks that have been mechanically excavated but is over the Nicoletti and Sorriso-Valvo (1991) 33% for rock avalanches. Unfortunately, as already stated by Cruden and Varnes (1996), more precise information on swell factors is as yet unavailable. In addition, the method used for estimating landslide volumes is inaccurate in the case topography di-verts the displaced material from rectilinear path. Then, more elaborated surveys and analysis are necessary (Nicoletti and Sorriso-Valvo, 1991).
Our results require several comments:
– Some parameters values such as Lr, L and Ld are to
some extent questionable since they depend on the pre-cise location of particular points in the landslide (ob-tained by DTM interpretation coupled with field obser-vations).
– All comments rely on the hypothesis that the
land-slides are single rotational land-slides. However, landland-slides 7, 8, 9 are more probably multiple rotational land-slides. Slopes of rotational movements generally range between 13◦and 40◦(Skemton and Hutchinson, 1969; Crozier, 1973; Soeters and Van Westen, 1996). With a mean value of 8◦, the slopes of our landslides are more typical of successive slides (Skemton and Hutchinson, 1969; Hutchinson, 1988; Buma and Van Ash, 1996). However, the other dimensions of successive slides are generally much lower than what we compute here. For example, in gentle slopes of ∼8◦in stiff London Clay coastal cliffs, Hutchinson (1988) reported individual slip units with a ground slope length mostly around 10 to 20 m and with failure surface depths ≤5 m. Simi-lar slopes are also reported for slab slides (Hutchinson, 1988; Ibsen et al., 1996). The parameter values cal-culated for the 13 landslides of the Leupegem and the Rotelenberg hills indicate that they are probably com-pound slides with a Dr/Lr ratio smaller than that of
ro-tational slides, whereas their width would be generally greater (Hutchinson, 1988; Soeters and Van Westen, 1996)
However, we clearly need to measure more landslides be-fore drawing firm conclusions especially since no geophysi-cal investigation has been performed to locate the slip surface (Hutchinson, 1983; McGuffy et al., 1996).
4.2 Kinematic data
The obtained DTMs may be subtracted from each other in order to determine the vertical displacement of each pixel during the considered time interval (Figs. 6 and 7). At the head of the landslides, large apparent vertical motion values generally correspond to the height of the scarps actually re-treating. There, the amount of scarp retreat may be fairly approximated by the width of the band of “collapsed” ter-rains.
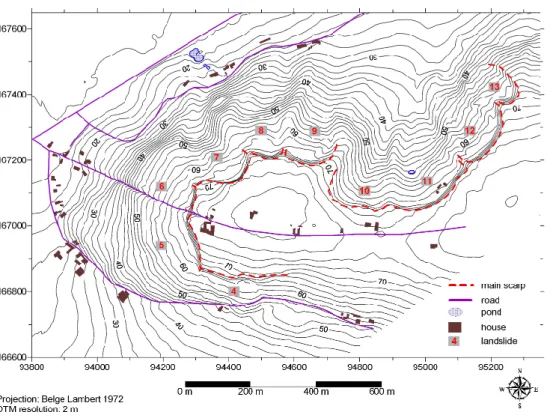
Fig. 4. The 1996 DTM of the Rotelenberg hill with location of the landslides 4 to 13.
Fig. 5. Definition of five dimensions of the landslide 1. L, total length; Ld, length of the displaced mass; Lr, length of the rupture
surface; Wd, width of the displaced mass; Wr, width of the rupture
surface.
From 1952 to 1996, landslide 6 was active (Fig. 6), with an observed mass movement typical of a rotational slide. During the 1952–1973 interval (Fig. 6A), the downslope up-lifted part was more important than the upslope collapsed part. In the time from 1973-1996, the relation becomes
op-posite (Fig. 6B). This could be related perhaps with inertia phenomena (Van Westen and Getahun, 2003) associated with the long-lasting evolution of the landslide since before 1952. At the head of the landslide (Fig. 6C), apparent vertical mo-tions of up to 4 m correspond mainly to lateral displacement of the scarp. The two collapsed parts 1 and 2 (Fig. 6C) in the zone of depletion suggest multiple rotational landsliding. This landslide is presently still active (Dewitte, 2004).
In favourable cases, locating the moving areas allows the identification of the stable slopes around a landslide. They can be then interpolated in order to recreate the original slope on which the landslide has developed. For instance, elevation changes within landslide 1 between 1996 and the time before landsliding show again a typical rotational process (Fig. 7). This is significant especially owing to the representativeness of landslide 1 for all landslides of the Flemish Ardennes (De-witte and Demoulin, 2003; Ost et al., 2003). Moreover, the total motion since the onset of landsliding is considered here. As already stressed by Weber and Hermann (2000) a DTM subtraction between two epochs cannot provide the overall volume of the displaced mass as measured in Sect. 4.1 but, this difference allows an estimation of the volume of the “up-lifted” or “collapsed” terrain between the two epochs (Ta-ble 3).
The difference between the DTMs of 1996 and 1952 ex-hibits a slightly positive volume balance for landslide 1 (Ta-ble 3.1) whereas a negative balance is observed for the whole of the 13 landslides (Table 3.2). The volume increase of land-slide 1 is probably due to the combination of episode of in-tense reactivation in 1995 (Ost et al., 2003) and the deposi-tion of 50 trucks load of soil (Dewitte and Demoulin, 2003).
264 O. Dewitte and A. Demoulin: Morphometry and kinematics of landslides
Fig. 6. Elevation changes within the landslide 6. (A): from 1952 to 1973; (B): from 1973 and 1996; (C): from 1952 to 1996. The movements in excess of 1σ uncertainty are represented.
Subtracting the DTM with the original slope from that of 1996 provides an estimation of the total volume of the “up-lifted” and the “collapsed” terrains (Fig. 7 and Table 3.3). These volumes are two times bigger than for the period 1952–1996, suggesting that a ground movement of at least the same importance that the one observed between 1952 and 1996 had already taken place before 1952.
The volume increase associated with motion-dependent dilation of the displaced material is not observed here for most landslides (Table 3.2). This may be explained by the old age, probably many hundreds of years, of the landslides, which left enough time for the compaction of the slipped masses. By comparison, Brueckl et al. (2004) interpreted a loss of volume as resulting from the compaction of a moving rock mass by 1.5% during a period of 34 years. Moreover, erosion of the “uplifted” volume in the downslope part of the landslide, notably through active suffusion, must induce a net loss of volume within the landslide.
Fig. 7. Elevation changes within the landslide 1 between 1996 and the time before landsliding. The movements in excess of 1σ uncer-tainty are represented.
Table 3. Positive (“uplifted”) and negative (“collapsed”) volumes relating to various epochs obtained by subtraction of DTMs. Row 1: Evolution of landslide 1 from 1952 to 1996. Row 2: Same for the sum of all landslides of the Leupegem and Rotelenberg hills. Row 3: Volume differences in landslide 1 between 1996 and the time before landsliding occurred.
1 Landslide 1 (1996–1952) (m3) Positive volume 46 838 Negative volume 45 848 Net volume 990 2 Landslides 1–13 (1996–1952) (m3) Positive volume 133 562 Negative volume 142 421 Net volume −8859
3 Landslide 1 (1996 – orignal slope) (m3)
Positive volume 101 127
Negative volume 105 559
Net volume −4432
5 Conclusions
Thanks to the use of precise DTMs, the main morphomet-ric parameters of the landslides have been measured with a high accuracy and so we were able to understand better their structure and driving processes. Moreover, by subtracting the DTMs from each other, we also localised the active parts of the landslides between 1952 and 1996 and estimated the volume of the “uplifted” and “collapsed” parts.
The field observations show that some of the reactivation movements are due to the development of cultivated areas upstream of the main scarps. Mainly in winter, the bare soils favour flow concentration toward the landslides. It has been observed that the reactivation of the landslide 1 (Figs. 3 and
7) in February 1995 was partly caused by such an important runoff. A detailed study of the various causes of landslide reactivation in the Flemish Ardennes is currently in progress. Finally, as a next step of the research, we will need now to define a standardized representation of such kinematic data in order to use them in the production of landslide suscepti-bility maps focusing on the hazard related to reactivation of existing landslides.
Acknowledgements. We thank A. Carrara for his useful comments on the first draft of the article.
Edited by: G. B. Crosta Reviewed by: A. Carrara
References
Brueckl, E., Brunner, F. K., and Kraus, K.: The kinematic of deep-seated mass movement derived from geophysical, GPS and pho-togrammetric data, Geophys. Res. Abstr., 6, 2004.
Buma, J. and van Asch, T.: Slide (rotational), in: Landslide Recog-nition, edited by: Dikau, R., Brunsden, D., Schrott, L., and Is-ben, M.-L., Identification, Movement and Causes, John Wiley & Sons, Chichester, 42–61, 1996.
Carter, M. and Bentley, S. P.: The geometry of slip surfaces be-neath landslides: prediction from surface measurements, Can. Geotech., 22, 234–238, 1985.
Church, H. K.: Excavation Handbook, McGraw-Hill, New-York, N. Y., 1024, 1981.
Corominas, J.: The angle of reach as a mobility index for small and large landslides, Can. Geotech., 33, 260–271, 1996.
Crozier, M. J.: Techniques for the morphometric analysis of land-slips, Z. Geomorph., 17, 78–101, 1973.
Cruden, D. M.: Discussion of Carter, M. and Bentley, S. P., 1985, The geometry of slip surfaces beneath landslides: prediction from surface measurements, Can. Geotech., 23, 94, 1986. Cruden, D. M. and Varnes, D. J.: Landslide Types and Processes,
in: Landslides: Investigation and Mitigation, Transportation Re-search Board, edited by: Turner, A. K. and Schuster, R. L., Spe-cial Report 247, National Research Council, National Academy Press, Washington D. C., 36–75, 1996.
Demoulin, A. and Pissart, A.: Past landslides in the Verviers (E Bel-gium) area: climate- or earthquake-induced features?, Cahiers du Centre europ´een de g´eodynamique et de s´eismologie, 18, 203– 216, 2001.
Demoulin, A., Pissart, A., and Schroeder, C.: On the origin of late Quaternary paleolandslides in the Li`ege (E Belgium) area, Int. J. E. Sci., 92, 795–805, 2003.
Dewitte, O.: Construction and analysis of precise DTMs of land-slides in Belgium, Geohys. Res. Abstr., 6, 2004.
Dewitte, O. and Demoulin, A.: Combined digital photogrammetry and GPS approaches of landslides evolution in Belgium, Geo-phys. Res. Abstr., 5, 2003.
Hutchinson, J. N.: Methods of locating slip surfaces in landslides. Bulletin of the Association of Engineering Geologist, 20, 3, 235– 252, 1983.
Hutchinson, J. N.: General Report: Morphological and geotechni-cal parameters of landslides in relation to geology and hydroge-ology, in: Proceedings of the Fifth International Symposium on Landslides, edited by: Bonnard, C., Balkema, Rotterdam, 3–35, 1988.
IAEG Commission on Landslides: Suggested nomenclature for landslides. Bulletin of the International Association of Engineer-ing Geology, 41, 13–16, 1990.
Ibsen, M.-L., Brunsden, D., Bromhead, E., and Collison. A.: Slide (translational), Slab slide, in: Landslide Recognition, edited by: Dikau, R., Brunsden, D., Schrott, L., and Isben, M.-L., Identifi-cation, Movement and Causes, John Wiley & Sons, Chichester, 78–84, 1996.
Kerle, N.: Volume estimation of the 1998 flank collapse at Casita volcano, Nicaragua: a comparison of photogrammetric and con-ventional techniques, Earth. Surf., 27, 759–772, 2002.
Kraus, K. and Waldh¨ausl. P.: Photogrammetrie, band 1: Grundla-gen und Standardverfahren, 5thedition, D¨ummlers Verlag, Bonn, 1994, French translation: Grussenmeyer, P. and Reis, O.: Manuel de photogramm´etrie: principes et proc´ed´es fondamentaux, Her-mes, Paris, 407, 1998.
McGuffy, V. C., Modeer, V. A. and Turner, A. K.: Subsurface ex-ploration, in: Landslides: Investigation and Mitigation, Trans-portation Research Board, edited by: Turner, A. K. and Schuster, R. L., Special Report 247, National Research Council, National Academy Press, Washington D.C., 231–277, 1996.
Nicoletti, P. G. and Sorriso-Valvo, M.: Geomorphic controls of the shape and mobility of rock avalanches, Geol. S. Am. B., 103, 10, 1365–1373, 1991.
Ost, L., Van Den Eeckhaut, M., Poesen, J., and Vanmaercke-Gottigny, M. C.: Characteristics and spatial distribution of large landslides in the Flemish Ardennes (Belgium), Z. Geomorph., 47, 329–350, 2003.
Skepton, A. W. and Hutchinson, J. N.: Stability of natural slopes and embankment foundations, in: Proceedings of the Seventh In-ternational Conference on Soil Mechanics and Foundation Engi-neering, Sociedad Mexicana de Mec´ana de Suelos, Mexico City, State of the Art Volume, 291–340, 1969.
Soeters, R. and Van Westen, C. J.: Slope instability recognition, analysis, and zonation, in: Landslides: Investigation and Mit-igation, Transportation Research Board, edited by: Turner, A. K. and Schuster, R. L., Special Report 247, National Research Council, National Academy Press, Washington D.C., 129–177, 1996.
Van Den Eeckhaut, M., Poesen, J., Verstraeten, G., Vanacker, V., Moeyersons, J., Nyssen, J., and van Beek, L. P. H.: The effective-ness of hillshade maps and expert knowledge in mapping gold deep-seated landslides, Geomorphology, in press, 2005. Vanmaercke-Gottigny, M. C.: Landslides as a morphogenetic
phe-nomenon in a hilly region of Flanders (Belgium), in: Assessment of erosion, edited by De Boodt, M. and Gabriels, D., John Wiley and Sons, Chichester, 475–484, 1980.
Vanpaemel, L., Poesen, J., and Vanmaercke-Gottigny, M. C.: Mas-satransport in de Vlaamse Ardennen: ruimtelijke en temporele dynamiek, De Aardrijkskunde, 3, 51–60, 2000.
Van Westen, C. J. and Getahun, F. L.: Analyzing the evolution of the Tessina landslide using aerial photographs and digital elevation models, Geomorphology, 54, 77–89, 2003.
Weber, D. and Herrmann, A.: Contribution de la photogramm´etrie num´erique `a l’´etude spatio-temporelle de versants instables: l’exemple du glissement de Super-Sauze (Alpes-de-Haute-Provence), B. Soc. Geol., 171, 6, 637–648, 2000.
WP/WLI: A suggested method for reporting a landslide. Bulletin of the International Association of Engineering Geology, 41, 5–12, 1990.