HAL Id: hal-00331121
https://hal.archives-ouvertes.fr/hal-00331121
Submitted on 18 Nov 2004HAL is a multi-disciplinary open access
archive for the deposit and dissemination of sci-entific research documents, whether they are pub-lished or not. The documents may come from teaching and research institutions in France or abroad, or from public or private research centers.
L’archive ouverte pluridisciplinaire HAL, est destinée au dépôt et à la diffusion de documents scientifiques de niveau recherche, publiés ou non, émanant des établissements d’enseignement et de recherche français ou étrangers, des laboratoires publics ou privés.
The reliability of grazing rate estimates from dilution
experiments: Have we over-estimated rates of organic
carbon consumption?
J. R. Dolan, K. Mckeon
To cite this version:
J. R. Dolan, K. Mckeon. The reliability of grazing rate estimates from dilution experiments: Have we over-estimated rates of organic carbon consumption?. Ocean Science Discussions, European Geo-sciences Union, 2004, 1 (1), pp.21-36. �hal-00331121�
OSD
1, 21–36, 2004 The reliability of grazing rate estimates from dilution experiments J. R. Dolan and K. McKeon Title Page Abstract Introduction Conclusions References Tables Figures J I J I Back CloseFull Screen / Esc
Print Version Interactive Discussion
Ocean Science Discussions, 1, 21–36, 2004 www.ocean-science.net/osd/1/21/
SRef-ID: 1812-0822/osd/2004-1-21 European Geosciences Union
Ocean Science Discussions
The reliability of grazing rate estimates
from dilution experiments: Have we
over-estimated rates of organic carbon
consumption?
J. R. Dolan and K. McKeon
Marine Microbial Ecology Group, Laboratoire O ´eanographique de Villefranche, CNRS UMR 7093, Universit ´e Paris VI, Station Zoologique, F-06230 Villefranche-Sur-Mer, France
Received: 4 November 2004 – Accepted: 17 November 2004 – Published: 18 November 2004 Correspondence to: J. R. Dolan (dolan@obs-vlfr.fr)
OSD
1, 21–36, 2004 The reliability of grazing rate estimates from dilution experiments J. R. Dolan and K. McKeon Title Page Abstract Introduction Conclusions References Tables Figures J I J I Back CloseFull Screen / Esc
Print Version Interactive Discussion
Abstract
According to a recent global analysis, microzooplankton grazing is surprisingly invari-ant, ranging only between 59 and 74% of phytoplankton primary production across systems differing in seasonality, trophic status, latitude, or salinity. Thus an important biological process in the world ocean, the daily consumption of recently fixed carbon,
5
appears nearly constant. We believe this conclusion is an artefact because dilution experiments are 1) prone to providing over-estimates of grazing rates and 2) unlikely to furnish evidence of low grazing rates. In our view the overall average rate of micro-zooplankton grazing probably does not exceed 50% of primary production and may be even lower in oligotrophic systems.
10
1. Introduction
Recently Calbet and Landry (2004) presented a global analysis of the impact of mi-crozooplankton grazing based on the results of ’dilution’ grazing experiments. They found that microzooplankton grazing was surprisingly invariant, ranging only between 59 and 74% of phytoplankton primary production across systems differing in
seasonal-15
ity, trophic status, latitude, or salinity. If 64% of the carbon fixed photosynthetically per day is consumed by microzooplankton there appears to be little left for any forms of carbon export or fueling whatever type of food web co-occurs with the microzooplank-ton, from bacteria to nekton. We believe this conclusion is an artefact because dilution experiments are 1) prone to providing over-estimates of grazing rates and 2) unlikely
20
to furnish evidence of low grazing rates.
The dilution approach relies on the reduction of encounter rates between phyto-plankton and their microzoophyto-plankton grazers. Natural water samples are amended with varying proportions of filtered seawater creating a dilution series, and grazing rate is estimated as the increase in apparent phytoplankton growth rate with dilution factor.
25
OSD
1, 21–36, 2004 The reliability of grazing rate estimates from dilution experiments J. R. Dolan and K. McKeon Title Page Abstract Introduction Conclusions References Tables Figures J I J I Back CloseFull Screen / Esc
Print Version Interactive Discussion
phytoplankton growth in the various dilutions against dilution factor. Growth rate of the phytoplankton is estimated as apparent growth rate extrapolated to 100 % dilution (growth in the absence of grazers).
While elegant, the method is not without problems. Results are often uninterpretable, judging from the fact that publications commonly report instances of uninterpretable
re-5
sults, i.e. plotting apparent phytoplankton growth against dilution factor does not yield a significant regression. Published “failure rates” range from 6 to 74% of the experi-ments run (Caron and Dennett, 1999; Caron et al., 2000; Gaul et al., 1999, Gifford et al., 1995; Kamiyama, 1994; Kuipers and Witte, 1999; Landry et al., 1995; Lessard and Murrell, 1998; Murrell and Hollibaugh, 1998; Reckermann and Veldhuis, 1997).
10
Some non-significant results are likely due to the fact that slight slopes, or low graz-ing rates, are difficult to detect with regression analysis using the small “n” values commonly employed (8–15 bottles). Compounding this difficulty is the fact that de-tecting low grazing rates necessitates distinguishing slight differences in start and end chlorophyll concentrations which is especially difficult in the highly dilute treatments.
15
Another problem which has received some attention is the possibility that grazing pressure may not be linearly related to dilution factor because 1) per-capita consump-tion rates of microzooplankton may differ in the different dilution treatments (Gallegos, 1989; Evans and Paranjape, 1992) and/or 2) grazer concentration may not be linearly related to dilution factor throughout the incubation time. Data exists with regard to the
20
response of the grazer community to dilution in terms of apparent growth and mortality (Dolan et al., 2000). It has been stated that the combined effects of grazer mortality in dilute treatments and growth in undiluted treatments (Gallegos, 1989) can result in an over-estimation of grazing rate and the that the over-estimation may be common, especially in low chlorophyll waters (Dolan et al., 2000).
25
Given the surprising results of Calbet and Landry concerning the near-constancy of microzooplankton grazing, and its apparent magnitude, it is worthwhile examining the results of dilution experiments for evidence of over-estimation of grazing rates. To this end, we analyzed results from dilution experiments which included data on the
OSD
1, 21–36, 2004 The reliability of grazing rate estimates from dilution experiments J. R. Dolan and K. McKeon Title Page Abstract Introduction Conclusions References Tables Figures J I J I Back CloseFull Screen / Esc
Print Version Interactive Discussion
grazer population, more precisely initial ciliate concentrations. We considered ciliate concentration as reasonable proxy estimate of grazing activity. The basic approach was to determine if a reported grazing rate was ’reasonable’ with regard to the initial ciliate concentrations. For each experiment which reported ciliate abundance we cal-culated the average individual ciliate grazing rate (µl ciliate−1 h−1) based on grazing
5
rate and ciliate abundance. This experimental parameter was then be compared to a maximum filtration rate for ciliates, artificially inflated to account for the activity of heterotrophic dinoflagellates and other herbivorous flagellates. We also examined the effect of dilution on ciliate microzooplankton from a low chlorophyll environment, the N. W. Mediterranean to verify the results found with ciliates from a eutrophic estuary.
10
We conclude that grazing rates estimated using the dilution approach have probably been over-estimated, especially in low chlorophyll waters.
2. Methods
Literature reports were used to assemble a data base of parameters from individual dilution experiments consisting of: 1) initial concentration of chlorophyll, 2)
concentra-15
tion of ciliate microzoooplankton (cells ml−1), 3) chlorophyll-based grazing rate (g d−1) and 3) chlorophyll-based phytoplankton growth rate (k d−1). Only experiments with sig-nificant regression relationships (p<0.05) were included. The data base consisted of a set of 185 corresponding values, for the most part a subset of the 788 experiments analyzed by Calbet and Landry (2004). Data from 2 studies not considered in the
Cal-20
bet and Landry analysis, Verity and Vernet (1992) and Olson and Strom (2002) were included. It should be noted that the overwhelming majority of reports of dilution exper-iments contain no data on grazer abundance; a few gave data on grazer biomass but not cell abundance.
Apparent ciliate clearance rates were calculated by a) dividing reported per day
graz-25
ing rate by 24, to obtain an hourly rate, g h−1, b) dividing g h−1by ciliates ml−1to obtain ml cleared per ciliate per hour, c) multiplying the ml clearance rate by 1000 to obtain
OSD
1, 21–36, 2004 The reliability of grazing rate estimates from dilution experiments J. R. Dolan and K. McKeon Title Page Abstract Introduction Conclusions References Tables Figures J I J I Back CloseFull Screen / Esc
Print Version Interactive Discussion
clearance as µl ciliate−1 h−1. These calculations assign all grazing activity exclusively to ciliates.
First, simple scatter plots and linear regression of log-transformed values was used to investigate possible inter-relationships. Further analysis was conducted separat-ing data from individual experiments associated with very high ciliate clearance rates
5
(>20 µl ciliate−1 h−1) from those yielding acceptable clearance rates (≤20 µl ciliate−1 h−1). A limit of 20 µl was chosen as it is twice the rate of 10 µl h−1very rarely exceeded by ciliates (see Capriuolo et al., 1991). The maximum average ciliate filtration rates was doubled to account for grazing by heterotrophic dinoflagellates, which can be as abundant as ciliates, but generally have maximum clearance rates of less than 1 µl h−1
10
(see Jeong, 1999) and herbivorous nanoflagellates, commonly present at abundances of about 1000 times that of ciliates, but with filtration rates of about 10 nl h−1(see Dolan and Simek, 1999).
The effects of dilution on ciliate microzooplankton from a low chlorophyll environment were examined as part of experiments investigating the effects of turbulence on natural
15
ciliate communities. We monitored changes in ciliate concentrations over a 24 h period in whole seawater compared to seawater diluted 9:1 with filtered water and then left undisturbed or subjected to turbulence. Water from a standard observation station in the Rade de Villefranche, Pt. B was obtained from 10 m depth. Chlorophyll concen-tration was approximately 0.3 µg l−1. Water for diluting the plankton community was
20
prepared by filtering through GFF filters and used to create a solution of 90% GFF filtered seawater and 10% whole water. Samples were incubated in 2 l Plexiglas con-tainers; 3 containers were filled with whole seawater and 9 containers filled with 90% diluted seawater. Time zero samples of 100 ml were taken and preserved with acid Lu-gols (2% final concentration) from each whole seawater container; the entire contents
25
of 3 of the 90% diluted containers were preserved to estimate beginning ciliate ciliate abundance in the dilute treatment and check for immediate dilution effects.
The containers were incubated in a temperature controlled room at 17◦C under con-stant illumination provided by ceiling mounted fluorescent fixtures. An oscillating grid
OSD
1, 21–36, 2004 The reliability of grazing rate estimates from dilution experiments J. R. Dolan and K. McKeon Title Page Abstract Introduction Conclusions References Tables Figures J I J I Back CloseFull Screen / Esc
Print Version Interactive Discussion
device, (described in Dolan et al., 2003) was used to generate small-scale turbulence estimated as about 0.5 cm2s−3, for 3 of the 6 dilute water containers. The remaining 3 dilute water containers and the whole seawater containers were left undisturbed. After 24 h, the entire contents of the dilute water containers and 100 ml samples from the whole seawater containers was preserved with acid Lugols.
5
Ciliate concentrations were determined in 50 ml aliquots using standard settling cham-bers and inverted microscopy for the whole water samples. For the diluted community a 2-step concentration procedure was used. The entire volume of the container was settled in a graduated cylinder for 72 h and then the top 1900 ml removed though care-ful siphoning. The remaining water was examined in 50 ml aliquots following standard
10
procedures. Ciliates enumerated were categorized in various size-shape categories. Here only total concentrations are reported as no distinct trends were evident with regard to any particular category of ciliate.
3. Results
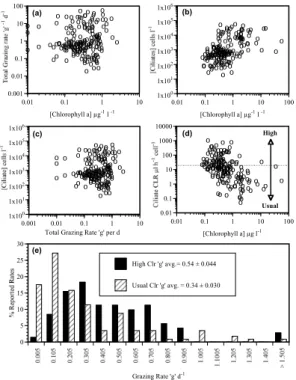
Plots of data from the 185 experiments which included ciliate data showed that
graz-15
ing rates were relatively invariant across a large gradient of chlorophyll concentrations, ranging over 4 orders of magnitude (Fig. 1a). In contrast, ciliate grazer and chloro-phyll concentration were positively related, r=0.51; p<0.0001, (Fig. 1b). Thus, data from dilution experiments suggests that grazing rates are independent of grazer abun-dance (Fig. 1c). Based on reported grazing rates and ciliate concentrations, calculated
20
ciliate clearance rates ranged from 103–10−1µl ciliate−1 h−1 and declined with chloro-phyll concentration, r=−0.49; p<0.0001 (Fig. 1d). Most high clearance rates (>20µl ciliate−1h−1) were derived from experiments in low chlorophyll waters. The average grazing rate from experiments yielding acceptable or “usual” clearance rates (account-ing for the presence of herbivores other than ciliates) was 0.34 d−1 (n=114, sd=0.32),
25
significantly different (p<0.002) from the average of experiments yielding unrealistically high clearance rates, 0.54 d−1 (n=71, sd=0.044). The higher average of the grazing
OSD
1, 21–36, 2004 The reliability of grazing rate estimates from dilution experiments J. R. Dolan and K. McKeon Title Page Abstract Introduction Conclusions References Tables Figures J I J I Back CloseFull Screen / Esc
Print Version Interactive Discussion
rates associated with high clearance rates was not due to larger or more frequent oc-currences of high “g” values, but rather to a lack of low “g” values (Fig. 1e). Thus, data from experiments derived largely from studies in low chlorophyll waters apparently in-flates the overall average grazing rate. Using only the data from experiments which generated “usual” or acceptable clearance rate estimates, grazing rate is correlated
5
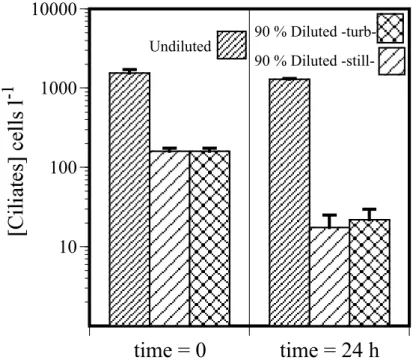
with grazer abundance in the form of “g” and ciliate concentration (r=0.43, p<0.0001). Results of the experiment examining the effect of dilution on a Mediterranean com-munity of ciliates are shown in Fig. 2. The ciliate comcom-munity, dominated by small (15×20 µm) oligotrichs, showed no significant change in concentration over the 24 h period in the whole seawater containers. In contrast, the ciliates displayed a very
sim-10
ilar decrease in concentration when diluted in both the still and turbulence treatments. Calculating an “apparent growth rate” for the diluted containers yields a rate of about −2 d−1.
4. Discussion
We reasoned that over-estimates of grazing would be detectable as high grazing rates
15
associated with low ciliate concentrations, and that such rates could be identified as those yielding unrealistically high clearance rates (grazing rate divided by ciliate grazer concentration): those exceeding 20 µl ciliate−1h−1. The limit of 20 µl was based on a likely over-estimate of maximum average (oligotrichs and tintinnids) clearance of 10 µl ciliate h−1, and then doubled to account for the grazing activity of co-occurring
het-20
erotrophic dinoflagellates and herbivorous nanoflagellates. Separating the grazing rate estimates using the independent criterion of clearance rate (≤20 vs. >20 µl), gave two significantly different sets of estimates based on a comparison of means. The set of grazing rates associated with acceptable or “usual” clearance rates gave a lower av-erage rate of 0.34 d−1 compared to 0.54 d−1 for experiments in which calculated
clear-25
ance rates were ≥20 µl ciliate−1h−1. Of these latter experiment, identified as likely over-estimating grazing, most were run in low chlorophyll waters (Fig. 1d).
OSD
1, 21–36, 2004 The reliability of grazing rate estimates from dilution experiments J. R. Dolan and K. McKeon Title Page Abstract Introduction Conclusions References Tables Figures J I J I Back CloseFull Screen / Esc
Print Version Interactive Discussion
The analysis relies on identifying and removing high grazing rates associated with the presence of relatively few ciliates. Clearly this is inappropriate if a) ciliates in olig-otrophic systems are resistant to dilution effects and/or exhibit very high average clear-ance rates, or b) microzooplankton communities in oligotrophic systems are fundamen-tally different in that ciliates are a minor component (i.e. exhibit very different ratios of
5
ciliates to heterotrophic dinoflagellates or herbivorous nanoflagellates).
We found that dilution effects on ciliates from an oligotrophic system were similar to those found in ciliates from a eutrophic estuary; high dilution factors are associ-ated with high mortality rates of ciliates over a 24 h period. In both cases (Fig. 2 and Dolan et al., 2000: Fig. 4) declines yield an apparent growth rate of about −2 d−1when
10
food levels are diluted down to 10–20% of in situ concentrations. With regard to “olig-otrophic” ciliate clearance rates, little data is available to assess the possibility of high clearance rates. However, data on populations found in the oligotrophic eastern basin of the Mediterranean, suggests average ciliate clearance rates closer to 1 than 10µl cell−1h−1, based on food vacuole content (Pitta et al., 2001) and prey availability for
15
natural populations (Christaki et al., 2001). Similarly, clearance rates of heterotrophic nanoflagellates from the same waters, about 8 µl cell−1h−1, appear close to “normal” rates (Christaki et al., 2001). Thus,there appears little reason to assume that ciliates and flagellates in oligotrophic waters exhibit unusually high clearance rates.
The second possible explanation for grazing rates to appear disproportionately large
20
with a given ciliate concentration is that ciliates are a poor proxy measure of the grazer community, especially in oligotrophic waters. To evaluate this possibility we plotted ciliate concentrations versus those of heterotrophic nanoflagellates and heterotrophic dinoflagellates using reports from a wide variety of systems (Fig. 3). There is consid-erable scatter in the data, as to be expected when plotting abundances of predators
25
and prey (ciliates and heterotrophic nanoflagellates) or competitors (ciliates and het-erotrophic dinoflagellates). Furthermore, the different fixatives employed may have ef-fected abundance estimates. However, it does appear that ciliate concentration is poor predictor of the abundance of heterotrophic nanoflagellates and dinoflagellates. Ciliate
OSD
1, 21–36, 2004 The reliability of grazing rate estimates from dilution experiments J. R. Dolan and K. McKeon Title Page Abstract Introduction Conclusions References Tables Figures J I J I Back CloseFull Screen / Esc
Print Version Interactive Discussion
abundance appears to be particularly unrelated to the concentration of heterotrophic nanoflagellates when ciliate concentrations are low. Nonetheless, it is difficult to as-cribe moderate to high grazing rates (g>5 d−1) in the presence of few ciliates (<500 ciliates l−1) without assigning unusually high clearance rates to heterotrophic flagel-lates.
5
We believe that dilution experiments can yield data suggesting grazing patterns quite different from those of natural communities due to changes in the grazer community during the experiment. and this is especially probable for experiments conducted in low chlorophyll waters. Dilution can expected to effect oligotrich ciliates based on experi-mental data (Fig. 2) and consideration of known threshold prey concentrations (Dolan
10
et al., 2000). Clearly, data is lacking for heterotrophic dinoflagellates and nanoflagel-lates on the possible effects of prey dilution. Generally speaking, high maximum growth rates are associated with high mortality rates. As both ciliates and nanoflagellates ex-hibit high growth rates there appears no a priori reason to expect starvation resistance to be higher in nanoflagellates compared to ciliates. On the other hand, heterotrophic
15
dinoflagellates, with their relatively low maximum growth rates compared to ciliates and nanoflagellates, may be overall a relatively starvation-resistant group.
The magnitude of grazing rates can clearly influence the conclusions one draws with regard to the importance of the grazers. Calbet and Landry (2004) state that microzooplankton grazing accounts for an a cross-system average of 64% of primary
20
production within a range of 59 to 74%. Based on an analysis of, in our view, the most reliable data, and using the same methods as Calbet and Landry (2004), the overall average rate of microzooplankton grazing does not exceed 50% of primary production. However, more importantly, this may reflect a low rate of phytoplankton consumption by micro and nanozooplankton in oligotrophic systems.
25
It may be time to re-evaluate our methods. Consider the recent exchange of views concerning the14C method (Banse, 2002; Marra, 2003; Moigis, 2004). The old ar-guments were never settled. Carbon fixation rates, estimated as rates of particulate carbon production are likely underestimates because DOC production by
phytoplank-OSD
1, 21–36, 2004 The reliability of grazing rate estimates from dilution experiments J. R. Dolan and K. McKeon Title Page Abstract Introduction Conclusions References Tables Figures J I J I Back CloseFull Screen / Esc
Print Version Interactive Discussion
ton as well as grazing in the incubation bottles are ignored (recall that according to Calbet and Landry about 64% of production is consumed per day by microzooplankton in bottle incubations). If dilution experiments overestimate carbon consumption and
14
C methods under-estimate carbon fixation, more carbon may be available for export from the surface layer than presently appreciated.
5
References
Ayukai, T., and Miller, D.: Phytoplankton biomass, production and grazing mortality in Exmouth Gulf, a shallow embayment on the arid, tropical coast of Western Australia, J. Exp. Mar. Biol. Ecol., 225, 239–251, 1998.
Banse, K.: Should we continue to measure14C uptake by phytoplankton for another 50 years?,
10
Limnol. Oceanogr. Bull., 11, 45–46, 2002.
Burkill, P. H., Edwards, E. S., and Sleigh, M. A.: Microzooplankton and their role in controlling phytoplankton growth in the marginal ice zone of the Bellinghausen Sea, Deep-Sea Res. II, 42, 1277–1290, 1995.
Calbet, A. and Landry, M. R.: Phytoplankton growth, microzooplankton grazing and carbon
15
cycling in marine systems, Limnol. Oceanogr., 49, 51–57, 2004.
Capriulo, G. M., Sherr, E. B., and Sherr, B. F.: Trophic behaviour and related community feeding activities of heterotrophic marine protists, in Protozoa and their role in marine processes, edited by Reid, P. C., Turley, C., and Burkill, P. H., Springer-Verlag, Berlin, 219–279, 1991. Caron, D. A. and Dennett, M. R.: Phytoplankton growth and mortality during the 1995 Northeast
20
Monsoon and Spring Intermonsoon in the Arabian Sea, Deep-Sea Res. II, 46, 1665–1690, 1999.
Caron, D. A., Dennett, M. R., Lonsdale, D. J., Moran, D. M., and Shalapyonok, L.: Micrzoo-plankton herbivory in the Ross Sea, Antarctica, Deep-Sea Res. II, 47, 3249–3272, 2000. Christaki, U., Giannakourou, A., Van Wambeke, F., and G ´erald Gr ´egori, Nanoflagellate
preda-25
tion on auto- and heterotrophic picoplankton in the oligotrophic Mediterranean Sea, J. Plank. Res., 23, 1297–1310, 2001.
Dolan, J. R. and Simek, K.: Diel periodicity in Synechococcus populations and grazing by heterotrophic nanoflagellates: analysis of food vacuole contents, Limnol. Oceaongr., 44, 1565–1570, 1999.
OSD
1, 21–36, 2004 The reliability of grazing rate estimates from dilution experiments J. R. Dolan and K. McKeon Title Page Abstract Introduction Conclusions References Tables Figures J I J I Back CloseFull Screen / Esc
Print Version Interactive Discussion
Dolan, J. R., Gallegos, C. L., and Moigis, A.: Dilution effects on microzooplankton in dilution grazing experiments, Mar. Ecol. Prog. Ser., 200, 127–139, 2000.
Dolan, J. R., Sall, N., Metcalfe, A., and Gasser, B.: Effects of turbulence on the feeding and growth of a marine oligotrich ciliate, Aquat. Microb. Ecol., 31, 183–192, 2003.
Evans, G. T. and Paranjape, M. A.: Precision of estimates of phytoplankton growth and
micro-5
zooplankton grazing when funtional response of grazers may be non-linear, Mar. Ecol. Prog. Ser., 80, 285–290, 1992.
Fileman, E. and Burkill, P.: The herbivorous impact of microzooplankton during two short-term Lagrangian experiments off the NW coast of Galacia in summer 1998, Prog. Oceaonogr., 51, 361–383, 2001.
10
Froneman, P. W. and Perissinoto, R.: Microzooplankton grazing and protozooplankton com-munity structure in the South Atlantic and in the Atlantic sector of the Southern Ocean, Deep-Sea Res. I, 43, 703–721, 1996a.
Froneman, P. W. and Perissinoto, R.: Structure and grazing of the microzooplankton commu-nities of the Subtropical Convergence and a warm-core eddy in the Atlantic sector of the
15
Southern Ocean, Mar. Ecol. Prog. Ser., 135, 237–245, 1996b.
Froneman, P. W. and Perissinoto, R.: Microzooplankton grazing in the Southern Ocean: Impli-cations for the carbon cycle, P.S.Z.N. I. Mar. Ecol., 17, 99–115, 1996c.
Gallegos, C. L.: Microzooplankton grazing on phytoplankton in the Rhode River, Maryland: nonlinear feeding kinetics, Mar. Ecol. Prog. Ser., 57, 23–33, 1989.
20
Gaul, W., Antia, A. N., and Koeve, W.: Microzooplankton grazing and nitrogen supply of phy-toplankton growth in the temperate and subtropical northeast Atlantic, Mar. Ecol. Prog. Ser., 189, 93–104, 1999.
Gifford, D. J.: Impact of grazing by microzooplankton in the Northwest Arm of Halifax Harbour, Nova Scotia, Mar. Ecol. Prog. Ser., 47, 249–258, 1988.
25
Gifford, D. J., Fessenden, L. M., Garrahan, P. R., and Martin, E.: Grazing by microzooplank-ton and mesozooplankmicrozooplank-ton in the high-latitude North Atlantic Ocean: spring versus summer dynamics, J. Geophys. Res., C4, 100, 6665–6675, 1995.
Hansell, D. A.: DOC in the global ocean carbon cycle, in Biogeochemistry of marine dissolved organic matter, edited by Hansell, D. A. and C. A. Carlson, C. A., New York, Academic Press,
30
685–715, 2002.
James, M. R. and Hall, J. R.: Microzooplankton grazing in different water masses associated with the Subtropical Convergence round the South Island, New Zealand, Deep-Sea Res. I,
OSD
1, 21–36, 2004 The reliability of grazing rate estimates from dilution experiments J. R. Dolan and K. McKeon Title Page Abstract Introduction Conclusions References Tables Figures J I J I Back CloseFull Screen / Esc
Print Version Interactive Discussion
45, 1689–1707, 1998.
Jeong, H. J.: The ecological role of heterotrophic dinoflagellates in marine planktonic commu-nity, J. Euk. Microbiol., 46, 390–396, 1999.
Kamiyama, T.: The impact of grazing by microzooplankton in northern Hiroshima Bay, the Seto Inland Seam, Japan, Mar. Biol., 119, 77–88, 1994.
5
Kuipers, B. R. and Witte, H. J.: Grazing impact of microzooplankton on different size classes of algae in the North Sea in early spring and mid-summer, Mar. Ecol. Prog. Ser., 180, 93–104, 1999.
Landry, M. R. and Hassett, R. P.: Estimating the grazing impact of marine microzooplankton, Mar. Biol., 67, 283–288, 1982.
10
Landry, M. R., Constantinou, J., and Kirshtein, J.: Microzooplankton grazing in the central equatorial Pacific during February and August 1992, Deep-Sea Res. II, 42, 657–671, 1995. Lessard, E. J. and Murrell, M. C.: Microzooplankton herbivory and phytoplankton growth in the
northwestern Sargasso Sea, Aquat. Microb. Ecol., 16, 173–188, 1998.
Marra, J.:14C uptake by phytoplankton, now and in the future. Limnol. Oceanogr. Bull., 12, 1–3,
15
2003.
Moigis, A. G.: A comment on Marra’s14C uptake now and in the future, Limnol. Oceanogr. Bull., 13, 4–6, 2004.
Mostajir, B., Dolan, J. R., and Rassoulzadegan, F.: Seasonal variations of pico- and nano-detrital particles (DAPI Yellow Particles, DYP) in the Ligurian Sea (NW Mediterranean),
20
Aquat. Microb. Ecol., 9, 267–277, 1995.
Murrell, M. C. and Hollibaugh, J. T.: Microzooplankton grazing in northern San Francisco Bay measured by the dilution method, Aquat. Microb. Ecol., 15, 53–63, 1998.
Neuer, S. and Cowles, T. J.: Protist herbivory in the Oregon upwelling system, Mar. Ecol. Prog. Ser., 113, 147–162, 1994.
25
Olson, M. B. and Strom, S. L.: Phytoplankton growth, microzooplankton herbivory and com-munity structure in the southeast Bering Sea: insight into the formation and temporal persis-tence of an Emiliania huxleyi bloom, Deep-Sea Res. II, 49, 5969–5990, 2002.
Paranjape, M.: Grazing by microzooplankton in the esatern Canadian arctic in summer 1983, Mar. Ecol. Prog. Ser., 40, 239–246, 1987.
30
Pitta, P., Giannakourou, A., and Christaki, U.: Planktonic ciliates in the oligotrophic Mediter-ranean Sea: longitudinal trends of stading stocks, distributions and analysis of food vacuole contents, Aquat. Microb. Ecol., 24, 297–311, 2001.
OSD
1, 21–36, 2004 The reliability of grazing rate estimates from dilution experiments J. R. Dolan and K. McKeon Title Page Abstract Introduction Conclusions References Tables Figures J I J I Back CloseFull Screen / Esc
Print Version Interactive Discussion
Putland, J. N.: Microzooplankton herbivory and bactivory in Newfoundland coastal waters dur-ing sprdur-ing, summer and winter, J. Plank. Res., 22, 253–277, 2000.
Reckermann, M. and Veldhuis, M. J. W.: Trophic interactions between picophytoplankton and micro-and nanozooplankton in the western Arabian Sea during the NE monsoon 1993, Aquat. Microb. Ecol., 12, 263–273, 1997.
5
Rivkin, R. B., Putland, J. N., Anderson, M. R., and Deibel, D.: Microzooplankton bacterivory and herbivory in the NE subarctic Pacific, Deep-Sea Res. II, 46, 2579–2618, 1999.
Safi, K. A. and Hall, J. A.: Factors influencing autotrophic and heterotrophic nanoflazgellate abundance in five water masses surrounding New Zealand, N. Z. J. Mar. Freshwat. Res., 31, 51–60, 1997.
10
Stoecker, D. K., Sieracki, M. E., Verity, P. G., Michaels, A. E., Haugen, E., Burkill, P. H., and Edwards, E. S.: Nanoplankton and protozooplankton during the JGOFS North Atlantic Bloom Experiment: 1989 and 1990, J. Mar. Biol. Assoc. UK, 74, 427–443, 1994.
Tamigneaux, E., Mingelbier, M., Klein, B., and Legendre, L.: Grazing by protists and sea-sonal changes in the size structure of protozooplankton and phytoplankton in a temperate
15
nearshoe environment (western Gulf of St. Lawrence, Canada), Mar. Ecol. Prog. Ser., 146, 231–247, 1997.
Verity, P. G. and Vernet, M.: Microzooplankton grazing, pigments, and composition of plankton communities during late summer in two Norwegian fjords, Sarsia, 77, 263–274, 1992. Verity, P. G., Stoecker, D. K., Sieracki, M. E., and Nelson, J. R.: Grazing, growth and mortality
20
of microzooplankton during the 1989 North Atlantic spring bloom at 47◦N, 18◦W, Deep-Sea Res. I, 40, 1793–1814, 1993.
Verity, P. G., Stoecker, D. K., Sieracki, M. E., and Nelson, J. R.: Microzooplankton grazing of primary production at 140◦W in the equatorial Pacific, Deep-Sea Res. II, 43, 1227–1255, 1996.
OSD
1, 21–36, 2004 The reliability of grazing rate estimates from dilution experiments J. R. Dolan and K. McKeon Title Page Abstract Introduction Conclusions References Tables Figures J I J I Back CloseFull Screen / Esc
Print Version Interactive Discussion o o o o o o oooooo ooo o o o o o o o o o o o o oooo o o ooooooo o o o o oo o ooo o o o o o o o o o o ooo o o o o o ooo oooooo o o o o o ooo o o o oooooooo o o o o o o o o o o o o o o o ooo oo o oo oo o o o o oooo o ooo o o o o o oo ooooo o o oo o o o o o o o o o oo o oo oo o o o ooo o o o o o o o o o o o o oo 1x100 1x101 1x10² 1x10³ 1x10⁴ 1x10⁵ 1x10⁶ 0.01 0.1 1 10 100 [Chlorophyll a] µg-1 l -1 (b) oo o o o oooooooooo o ooo o o o o o o ooo o o o o o o ooooo o o o o o o o o oo o oo oo o o o o o ooo oooooo oo o o o oo o o o o ooo oooo oooooo o o oo o o o o o o o o o o o oo oo o oooo o oooo ooooo oo o oo o o oo o oo o ooo ooo oo o oo o oo o o o o o o o o o oo o o o oo o o o o o o o oo o o o o ooo 1x100 1x101 1x10² 1x10³ 1x10⁴ 1x10⁵ 1x10⁶ 0.001 0.01 0.1 1 10 Total Grazing Rate 'g' per d
(c) E 0 5 10 15 20 25 30 Grazing Rate 'g' d-1 High Clr 'g' avg.= 0.54 ± 0.044 Usual Clr 'g' avg. = 0.34 ± 0.030 o o o o oo o o o o oo ooo o o oo o o o o o o o o oo o o o o oo oooo o oo o o o o o o o o o o o o o o o o o o o o o o o o o o o o o oo oo o o o o o o o oo o o o o o o o o o oooo o o o o o o o o o o oo o o ooo o oooooo o ooo oo o o o ooo o o o o o o o oo o o o o o o o o o o o o o o ooo o o o o o ooo o o o o o o o o o o o o o o o o oo 0.01 0.1 1 10 100 1000 10000 0.01 0.1 1 10 100 [Chlorophyll a] µg l-1 High Usual (d) oo o o oo o o o ooo ooo o ooo o o o o o o o o o o o o o o o ooooo o o o o o o o o oo o oo o o o o o o o oo ooo o o oooo oo oo oo o o o oo ooooo oo o oo o o o oo o o o o o o o o o o o o o oo o ooo o o o o o o oo o o o ooo oo o o o o o oo ooo oooo oo ooo o o o o o o o o o o o o o o o o o o o o o o o o o o o o o o o o ooo 0.001 0.01 0.1 1 10 100 0.01 0.1 1 10 [Chlorophyll a] µg-1 l -1 (a) (e)
Fig. 1. Graphical presentation of data from dilution grazing experiments which reported initial
chlorophyll a and ciliate concentrations (Ayukai and Miller, 1998; Caron and Dennett, 1999; Dolan et al., 2000; Fileman and Burkill., 200; Froneman and Perissinoto, 1996a, b; Gifford, 1988; Gifford et al., 1995; James and Hall, 1998; Landry and Hassett, 1982; Neuer and Cowles, 1994; Olson and Strom, 2002; Putland, 2000; Rivkin et al., 1999; Tamigneaux et al., 1997; Verity and Vernet, 1992; Verity et al., 1993, 1996;). (a) Grazing rate as function of chlorophyll
a concentration. (b) Ciliate concentration as a function of chlorophyll concentration. (c) Ciliate
concentration as a function of grazing rate. (d) Calculated average ciliate clearance rate as
a function of chlorophyll concentration. Dotted line divides the rate estimates in two fields of “Usual” and “High” clearance rates; (e) shows the frequency distributions of the two sets of
OSD
1, 21–36, 2004 The reliability of grazing rate estimates from dilution experiments J. R. Dolan and K. McKeon Title Page Abstract Introduction Conclusions References Tables Figures J I J I Back CloseFull Screen / Esc
Print Version Interactive Discussion
time = 0
time = 24 h
10
100
1000
10000
Undiluted 90 % Diluted -turb-90 % Diluted-still-Fig. 2. Results of the experiment examining the effects of dilution on a ciliate community from
the NW Mediterreanean Sea. Average concentrations (±sd) of ciliates, all morphotypes pooled, before and after 24 h of incubation of undisturbed whole seawater (Undiluted), seawater diluted 9:1 with GFF-filtered seawater and left undisturbed (90% Diluted -still-) or subjected to small-scale turbulence (90% -turb-. Note that high mortality of ciliates was associated with dilution in both still and turbulent treatments.
OSD
1, 21–36, 2004 The reliability of grazing rate estimates from dilution experiments J. R. Dolan and K. McKeon Title Page Abstract Introduction Conclusions References Tables Figures J I J I Back CloseFull Screen / Esc
Print Version Interactive Discussion 1x100 1x101 1x10² 1x10³ 1x10⁴ 1x10⁵ 1x10⁶ 1x10⁷ 1x100 1x101 1x10² 1x10³ 1x10⁴ 1x10⁵ [Ciliates] cells l-1 (b) 1 : 1 1x101 1x10² 1x10³ 1x10⁴ 1x10⁵ 1x10⁶ 1x10⁷ 1x10⁸ Arabian Sea Eq. Pacific South Pacific (NZ) Southern Ocean N. Atlantic Bloom N.W. Mediterranean N. E. Atlantic N.W. Atlantic 1 : 1000 (a)
Fig. 3. Plots of reported ciliate concentrations versus heterotrophic nanoflagellate
concentra-tions(a) and versus heterotrophic dinoflagellate concentrations (b) from a variety of systems:
the Arabian sea (Caron and Dennett, 1999), equatorial Pacific (Verity et al., 1996), the south Pacific off New Zealand (Safi and Hall, 1997), the Southern Ocean (Froneman and Perissinotto, 1996); the N central Atlantic-N. Atlantic Bloom (Stoecker et al., 1994), the NNW Mediterranean (Mostajir et al., 1995); the N. E. Atlantic (Fileman and Burkill, 2001); the N. W. Atlantic (Put-land, 2000). The line in (a) indicates the presumed 1:1000 relationship between ciliate and heterotrophic nanoflagellate concentrations and the cline in (b) the presumed 1:1 relationship between the abundance of ciliates and heterotrophic dinoflagellates.