HAL Id: hal-00299451
https://hal.archives-ouvertes.fr/hal-00299451
Submitted on 13 Sep 2007
HAL is a multi-disciplinary open access
archive for the deposit and dissemination of
sci-entific research documents, whether they are
pub-lished or not. The documents may come from
teaching and research institutions in France or
abroad, or from public or private research centers.
L’archive ouverte pluridisciplinaire HAL, est
destinée au dépôt et à la diffusion de documents
scientifiques de niveau recherche, publiés ou non,
émanant des établissements d’enseignement et de
recherche français ou étrangers, des laboratoires
publics ou privés.
Pre-earthquake signals ? Part II: Flow of battery
currents in the crust
F. T. Freund
To cite this version:
F. T. Freund. Pre-earthquake signals ? Part II: Flow of battery currents in the crust. Natural Hazards
and Earth System Science, Copernicus Publications on behalf of the European Geosciences Union,
2007, 7 (5), pp.543-548. �hal-00299451�
www.nat-hazards-earth-syst-sci.net/7/543/2007/ © Author(s) 2007. This work is licensed under a Creative Commons License.
and Earth
System Sciences
Pre-earthquake signals – Part II: Flow of battery currents in the
crust
F. T. Freund
Ames Associate, NASA Ames Research Center, 242-4, Moffett Field, CA 94035, USA
Principal Investigator, Carl Sagan Center, SETI Institute, 515 N. Whisman Road, Mountain View, CA 94043, USA Adjunct Professor, Department of Physics, San Jose State University, San Jose, CA 95192-0106, USA
Received: 13 June 2007 – Revised: 3 September 2007 – Accepted: 3 September 2007 – Published: 13 September 2007
Abstract. When rocks are subjected to stress, dormant
elec-tronic charge carriers are activated. They turn the stressed rock volume into a battery, from where currents can flow out. The charge carriers are electrons and defect electrons, also known as positive holes or pholes for short. The bound-ary between stressed and unstressed rock acts as a potential barrier that lets pholes pass but blocks electrons. One can distinguish two situations in the Earth’s crust: (i) only pholes spread out of a stressed rock volume into the surrounding un-stressed rocks. This is expected to lead to a positive surface charge over a wide area around the future epicenter, to per-turbations in the ionosphere, to stimulated infrared emission from the ground, to ionization of the near-ground air, to cloud formation and to other phenomena that have been reported to precede major earthquakes. (ii) both pholes and electrons flow out of the stressed rock volume along different paths, sideward into the relatively cool upper layers of the crust and downward into the hot lower crust. This situation, which is likely to be realized late in the earthquake preparation pro-cess, is necessary for the battery circuit to close and for tran-sient electric currents to flow. If burst-like, these currents should lead to the emission of low frequency electromagnetic radiation. Understanding how electronic charge carriers are stress-activated in rocks, how they spread or flow probably holds the key to deciphering a wide range of pre-earthquake signals. It opens the door to a global earthquake early warn-ing system, provided resources are pooled through a con-certed and constructive community effort, including seismol-ogists, with international participation.
Correspondence to: F. T. Freund
1 Introduction
There are primarily two reasons why pre-earthquake signals have “gotten a bad name” in the geophysical community: (i) not every earthquake is preceded by the reported precursory signals, and (ii) there is no consensus as to the mechanism or mechanisms that might explain the different reported precur-sory signals.
The unreliability of pre-earthquake signals, even before major seismic events, is of great concern. On one hand it is a consequence of the complexity of the Earth’s crust, on the other hand seismologists face the same unreliability when dealing with foreshocks. In some cases main shocks are pre-ceded by one or several smaller events, which are recognized retrospectively as “foreshocks”, e.g. after the main shock has occurred. In other cases there is no recognizable foreshock activity and main shocks seem to happen “out of the blue”.
At the same time it is inconceivable – from a physics view-point – that earthquakes should NOT be preceded by some kind of precursory signals. The reason is simple: any earth-quake represents the end stage of a drawn-out process, in the course of which rocks at depth experience increasing levels of stress. Eventually the rocks may snap, generating seismic waves. During the progressive stress build-up the rocks MUST pass through a series of physical changes, less dramatic than the catastrophic rupture but nonetheless real. These changes MUST manifest themselves in changes in var-ious properties of the rocks. The challenge is to (i) recognize these changes and (ii) to understand them.
In the seismological community attention focuses on me-chanical processes of rocks, how rocks deform as a macro-scopic body, when and where microcracks appear, what role is played by pore water and intergranular water films, when and how aseismic slip may occur. Changes in electrical con-ductivity in the Earth’s crust are discussed in terms of the de-gree of water penetration into cracks and microfissures that open or close.
544 F. T. Freund: Pre-earthquake signals – Part II 1.1 Activating electronic charge carriers
In Part I (Freund, 2007) a fundamentally different approach was presented, one that focuses on the microscopic processes that take place in rocks at the level of atoms and ions. It was reported that most of the constituent minerals of igneous and high-grade metamorphic rocks contain a population of cer-tain crystallographic defects. The fact that these defects exist and appear to be ubiquitous in those rocks had not previously been recognized.
These defects consist of pairs of oxygen anions that have changed their valence from the usual 2- state to the 1- state. Two O− come together to form a peroxy link. The 1-
oxy-gen anions are introduced through the dissolution of small amounts of H2O into the matrix of minerals that crystallize from H2O-laden magmas or recrystallize in H2O-laden meta-morphic environments. The dissolved H2O forms hydroxyl, O3X-OH where X = Si4+, Al3+ etc. Upon cooling, some-where below 600◦C, hydroxyl pairs rearrange electronically
to form peroxy links plus molecular H2. Intact peroxy links
H2O + O3Si-O-SiO3 O3Si-OHHO-SiO3 O3Si/OO\SiO3 H 2 H2 O3Si/OO\SiO3 e– e–
Water splits Si-O-Si bond
Dissolved H2O = Hydroxyl pair
Redox conversion to peroxy bond plus H2
Peroxy bond = Positive hole pair
Escape
are dormant, e.g. electrically inactive. The situation changes when peroxy links dissociate. Two scenarios arise: (A) a small fraction of peroxy links will always be in a dissociated state due, for instance, to radiation damage by radioactive decay or other processes, and (B) when deviatoric stresses are applied, dislocations move through the matrix of min-eral grains which undergo an ever so slight plastic deforma-tion, causing dissociation of the peroxy links. In the process electron-hole pairs are generated: weakly bound electrons and defect electrons or “holes”, also known as positive holes or pholes for short.
1.2 Battery Concept
A rock volume in which electron-phole pairs are activated becomes a “source” of electronic charge carriers. In Part I the battery concept was introduced (Freund, 2007). To de-scribe the flow of electrons and pholes within a “source” and out of a “source” we now combine the battery concept with elements of semiconductor physics. For this we have to intro-duce two widely used terms: n-type and p-type conductivity.
O
3Si/
OO\SiO
3+ [SiO
4]
4–two oxygens
any oxygen in valence 1- in valence
{
O
3Si/
O••O/SiO
3}
+ [SiO
4]
4–O
3Si/
O•
O/SiO
3+ [SiO
4]
3–Electron – Phole Pair
Dormant
Transitory
Activated
By definition, any semiconductor material that carries electric current primarily by electrons (which can travel in the conduction band or on high-lying energy levels) is called n-type. Conversely, any semiconductor material where tric current is carried along the valence band by defect elec-trons or holes is called p-type. Whether the conductivity response is n-type or p-type depends on the ratio n’µ’/nµ, where n’ is of the number density of electrons and µ’ their mobility and n is the number density of holes and µ their mo-bility. If n’µ’/nµ<1, the material is p-type. If n’µ’/nµ>1, it is n-type.
Igneous and high-grade metamorphic rocks seem to al-ways contain small concentrations of pholes that are in a per-manently or temporary mobile state. These rocks are slightly p-type. This p-type conductivity is crucial to understand why, when the end of a slab of rock is subjected to deviatoric stress as depicted in Fig. 3 of Part I (Freund, 2007), pholes can flow out of the source: they can access energy levels as-sociated with existing hole states in the valence band and use them to spread into the unstressed rock. Since rocks don’t provide similar energy levels for electrons to use, at least not at low to moderately high temperatures, up to around 600◦C,
the electrons cannot follow suit. In other words, the bound-ary between stressed and unstressed rock acts as a potential barrier (similar to a diode) that rejects electrons while letting pholes pass.
The pholes have the capability to spread from the stressed rocks into the surrounding unstressed rocks. They travel in the mineral matrix on energy levels at the upper edge of the valence band. Because of this they can cross grain bound-aries and cross boundbound-aries between different rocks. They can thus travel far, at least over the distance of 1 m in laboratory rock samples, probably over distances on the order of kilo-meters to tens of kilokilo-meters in Earth’s crust. Importantly, the current carried by pholes is not stopped by intergranular water films. It even flows through centimeter-thick layers of water, though the charge carriers change in the water.
As long as electrons cannot flow out of the stressed rock volume, the situation is analogous to a charged battery when the circuit is not closed, i.e. where the plus and minus poles
are not electrically connected. Similar to a charged bat-tery, the outflow of pholes causes a positive charge in the surrounding unstressed rocks, hence a potential difference. The outflow stops when the potential reaches an equilibrium value.
In order for electrons to also flow out, both the source and the unstressed rocks need to be in contact with an n-type ma-terial. In the laboratory, this contact is easily established as demonstrated in Part I (Freund, 2007) by placing a Cu tape on the stressed rock or using the steel pistons as electrical connection and by running a wire from the “source” to a Cu tape on the unstressed rock. Then the circuit closes and the battery current can flow its course.
In Nature, in a pre-earthquake situation where stresses build up deep in the crust, this closure of the battery circuit is not easily established. How to overcome this hurdle will be discussed in the next section.
2 Modeling pre-earthquake signals
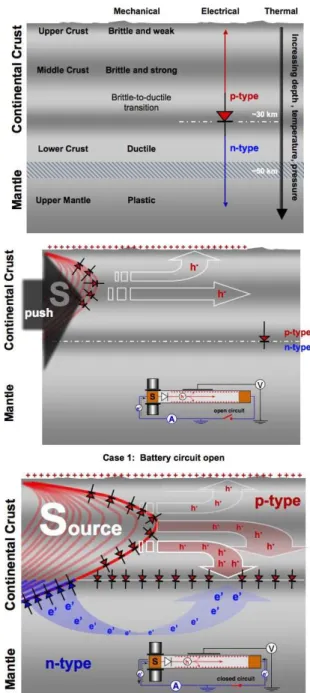
We begin with a schematic cross section through the Earth’s crust down to the upper mantle as depicted in Fig. 1a. The temperature increases with increasing depth along the geotherm. We divide the crust into “upper”, “middle” and “lower” zones and assign the beginning of the upper mantle to a depth of about 50 km. We classify the mechanical prop-erties of the crust with increasing depth as “brittle and weak”, “brittle and strong”, “ductile” and “plastic” with transitions between these zones. Electrically, we divide the crust into a p-type conductive upper and middle layer, underlain by an n-type conductive lower crust and upper mantle. To place the p-n junction at the appropriate depth we assume that the temperature reaches around 600◦C at a depth around 30 km
(e.g. Russell, 1999). Experimental observation indicates that this temperature range marks the transition from p-type to n-type conductivity in laboratory experiments at 1 bar pressure (Freund, 2003). The p-n transition is believed to be caused by the thermal activation of electrons from the valence band to the conduction band or some high-lying energy levels. Since electrons always have much higher mobilities than de-fect electrons or holes, a relatively small number of electrons on these electron-conductive levels is enough to change the n’m’/nm ratio from <1 (p-type) to >1 (n-type).
In Fig. 1b we illustrate how we can use this idealized model to transpose the set-up from the experiment depicted in Fig. 3 of Part I (Freund, 2007) onto the Earth’s crust (in-sert). We assume that the tectonic stress, symbolized by the large arrow on the upper left, acts over the entire cross section and at a constant strain rate. Because rocks become ductile with increasing depth they will yield under the onslaught of stress. At low stress rates, the ductile rocks yield as fast as the stresses are applied, meaning that dislocations anneal as fast as they are generated, preventing the source S from expand-ing downward very far. As a result, in the beginnexpand-ing of the
Fig. 1. Schematic representation of Earth’s crust. (a):
Subdivi-sion into brittle/weak upper, brittle/strong mid-crust, p-type conduc-tive, overlying the ductile n-type conductive lower crust and upper mantle. (b): Stress causes the stressed rock volume becomes the “source” in which both electrons and holes are activated, i.e. they “wake up” from a dormant state and become mobile charge carriers. The boundary between stressed and unstressed rock acts as a Schot-tky barrier letting holes pass but rejecting electrons. (c): When the circuit closes, large currents are expected passing though the n-type lower crust. The flow of electrons and holes may be coupled giv-ing rise to fluctuations and, hence, to low to ultralow frequency EM emissions.
546 F. T. Freund: Pre-earthquake signals – Part II process modeled here, the source S will be confined mostly
to the upper portion of the crust where rocks are brittle. However, when confined rocks are loaded at a constant strain rate, the stresses grow nonlinearly with time. As a result the source increases in size and extends downward into the ductile zone. This is indicated by the set of skewed parabolas. Inside the source S electrons and pholes are co-activated. The boundary to the surrounding unstressed rocks is marked in Fig. 1b by a series of diode symbols to indicate that phole charge carriers h can flow out of the source vol-ume and spread into the surrounding unstressed rocks, while electrons cannot. The spreading of pholes is indicated by the thin-line arrows.
The insert in Fig. 1b illustrates that there is no electrical connection between the source S (left) and the end of the slab (right), meaning that the battery circuit is open. While this does not prevent an outflow of pholes into the unstressed rock, it limits their outflow. The reason is that, if electrons cannot follow suit, the phole outflow sets up a polarization electric field, which counteracts the outflow. At the same time the pholes, which do flow out, set up a positive charge on the surface of the Earth as indicated by a series of + signs. In Fig. 1c we illustrate what is expected to happen when loading continues at a constant strain rate and, hence, non-linearly increasing stress rate. At high stress rates the source S will expand downward, into the ductile zone, overriding the ongoing annealing. Eventually the source volume will reach the boundary labeled p-n junction in Figs. 1a/b. Within the framework of the model discussed here the battery circuit then closes, allowing electrons to flow out of the source vol-ume into the n-type conductive lower parts of the crust and upper mantle.
Of course the real conditions in the Earth’s crust will be much more complex than outlined here but the basic idea is to describe the flow of electric charges, both pholes and electrons, as a function of time under non-linearly increas-ing stress levels prior to large-scale seismic events. What our model does not address is the possible role of faults filled with water- or brine-saturated gouges. Such faults can poten-tially short-circuit or redirect the phole current in ways that have not yet been sufficiently explored (Freund et al., 2004). 2.1 IR Emission, EM Emission, Ionospheric Perturbations Stress-activation of phole charge carriers in the Earth’s crust should lead to a positive charge on the surface. This is schematically depicted in Fig. 1b emphasizing the flow of phole charge carriers to the surface. This surface charge has been theoretically predicted (King and Freund, 1984) and confirmed in laboratory experiments (Freund, 2002, 2003; Freund et al., 1993). One predictable consequence of the build-up of a positive charge is recombination of phole charge carriers at the surface. It should lead to vibrationally highly excited O-O bonds, which are expected to radiatively de-excite by emitting narrow bands in the thermal infrared
(IR) window. These non-thermal IR emission bands have been experimentally observed (Freund et al., 2007). They may be responsible for the reported “thermal anomalies” but more work is needed.
The ionosphere is a plasma region that begins about 100 km above the Earth’s surface and is highly dynamic. When a regional positive ground potential develops, the ionosphere is expected to be perturbed. Perturbations have been widely observed and tentatively correlated with earthquake activ-ity. The build-up of a positive ground potential seems to be consistent with most observations, including changes in the Total Electron Content, though the release of radon from the ground has been discussed as an alternative pro-cess (e.g. Hayakawa, 1999; Liu et al., 2000, 2001, 2004; Molchanov et al., 1998; Pulinets and Boyarchuk, 2004; Reinisch et al., 2005).
Given that every km3of stressed rock can potentially de-liver battery currents on the order of 10 000–100 000 A or more, these transient currents may be very powerful, even if large losses occur during propagation. Because the cur-rents are linked via their respective electric fields, they are expected to fluctuate, similar to the coupled outflow currents observed in the laboratory (Freund et al., 2006). If large vol-umes of rocks subjected to increasing stresses deep in the Earth’s crust generate powerful current pulses, those pulses will lead to bursts of low frequency electromagnetic (EM) ra-diation. Though we are still a long way from understanding the details of the current flow, we are gaining insight into the basic physical process that can explain low-frequency EM emissions widely reported both on account of satellite and ground station data (Biagi et al., 2001; Dea et al., 1997; Ef-taxias et al., 2003; Enomoto et al., 2006; Ismaguilov et al., 2001; Kushwah et al., 2005; Ohta et al., 2001; Parrot, 1994; Parrot et al., 2006).
2.2 Air ionization, corona discharges, atmospheric effects Not shown in Figs. 1a/b are other processes expected to re-sult from the accumulation of phole charge carriers at the surface. When the local electric fields reach values high enough to cause ionization of the air, corona discharges can occur, hence, visible light emission. Corona discharges have been observed in the laboratory (Freund, 2002). If the elec-tric fields are not high enough to cause corona discharges, they will still be able to cause “silent” ionization of the air and injection of ions into the near-surface air. Injection of charges into the lower atmosphere has been widely discussed in connection with ionospheric perturbations. The source of the charges is generally assumed to radon released prior to earthquakes (Liperovsky et al., 2000; Ondoh, 2003; Pulinets and Boyarchuk, 2004; Pulinets et al., 1997; Sorokin et al., 2001), but the stress-activation of pholes at depth and their appearance at the Earth’s surface offers a much broader in-terpretation. It removes the uncertainty that, while changes in radon emission are quite often observed, they are not a
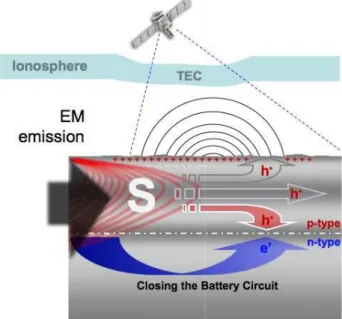
Fig. 2. Concept of a satellite-based earthquake early warning system designed to monitor several precursory phenomena: iono-spheric perturbations, low-frequency EM emissions, and “thermal anomalies”.
“safe” indicator (Igarashi et al., 1993; Planinic et al., 2001; Plastino et al., 2002).
Under the right atmospheric conditions, airborne ions will act as condensation nuclei of water vapor, leading to fog, haze or clouds with concurrent release of latent heat. This latent heat effect has been hypothesized at the cause of the “Thermal Anomalies” in the context of the postulated radon release from the ground (Dey and Singh, 2003). The airborne positive ions are implicated in physiological reactions in an-imals and humans and may provide a gateway to understand the often reported, but highly controversial abnormal animal behavior before major earthquakes (Ikeya, 2004; Kirschvink, 1992; Tributsch, 1984).
3 Conclusions
Seismology is based primarily on information obtained from the propagation of seismic waves after earthquakes have struck. Seismologists use – in principle – a retroactive ap-proach where earthquakes are the “flash lights” that illumi-nate the inner structures of the Earth. Seismologists have pieced together an amazing body of knowledge about our dy-namic planet. However, their tools are blunt when it comes to extract information about the time before earthquakes, often seismically quiet, while stresses build up progressively deep in the Earth’s crust. Other tools are needed, tools that can provide information before the rocks reach the critical point of rupture.
The geophysical community at large has been uncon-vinced that non-seismic pre-earthquake signals are useful or even real. The lack of understanding of the underlying pro-cesses has spawned controversies. This situation may change as a result of the discovery that stresses activate electronic charge carriers in rocks. We now know that electrons and holes exist in rocks in a dormant, electrically inactive form. We begin to understand how these charge carriers are “awak-ened”, how they behave, and how they can lead to a range of different precursory phenomena. We also begin to have in-sight into why some earthquakes produce measurable or even strong pre-event signals but others do not. The alleged “un-reliability” of pre-earthquake signals can now be addressed in a more rational way.
The important point, which emerges from this work, is that a wide range of pre-earthquake signals seem to be traceable to the same basic physical process: activation of electrons and phole charge carriers in and their propagation through the Earth’s crust. We can now begin looking at different pre-cursory signals, not as disjointed transient phenomena but as a hierarchical family of signals.
Figure 2 shows the concept of a satellite-based earthquake early warning system that is currently under consideration at NASA and countries that are part of CEOS, the Committee on Earth Observing Satellites.
Acknowledgements. This work has evolved over many years. It
has been supported in part by the NASA Ames Research Center Director’s Discretionary Fund and by a Goddard Earth Science and Technology (GEST) Fellowship from the NASA Goddard Space Flight Center, Planetary Geodynamics Laboratory. I thank my students and my coworkers A. Takeuchi, supported by a fellowship from the Japan Society for the Promotion of Science (JSPS), and B. W. S. Lau, supported through a grant from the National Geospatial-Intelligence Agency (NGA).
Edited by: M. Contadakis
Reviewed by: M. Lazarus and another anonymous referee
References
Biagi, P. F., Piccolo, R., Ermini, A., et al.: Possible earthquake precursors revealed by LF radio signals, Nat. Hazards Earth Syst. Sci., 1, 99–104, 2001,
http://www.nat-hazards-earth-syst-sci.net/1/99/2001/.
Dea, J. Y., Hansen, P. M., and Boerner, W.-M.:l ULF/ELF po-larimetry: observations of anomalous ULF signals preceding the Northridge earthquake of January 17, 1994, in Wideband Inter-ferometric Sensing and Imaging Polarimetry, edited by: Mott, H. and Woerner, W.-M., 195–206, SPIE, 1997.
Dey, S., and Singh, R. P.: Surface latent heat flux as an earthquake precursor, Nat. Hazards Earth Syst. Sci., 3, 749–755, 2003, http://www.nat-hazards-earth-syst-sci.net/3/749/2003/.
Eftaxias, K., Kapiris, P., Phylogiannakis, J., et al.: Experience of short term earthquake precursors with VLF-VHF electromag-netic emissions, Nat. Hazards Earth Syst. Sci., 3, 217–228, 2003, http://www.nat-hazards-earth-syst-sci.net/3/217/2003/.
548 F. T. Freund: Pre-earthquake signals – Part II
Enomoto, Y., Hashimoto, H., Shirai, N., et al.: Anomalous geoelec-tric signals possibly related to the 2000 Mt. Usu eruption and 2003 Tokachi-Oki earthquakes, Phys. Chem. Earth, 31, 319–324, 2006.
Freund, F.: Charge generation and propagation in rocks, J. Geody-namics, 33, 545–572, 2002.
Freund, F., Freund, M. M., and Batllo, F.: Critical review of electri-cal conductivity measurements and charge distribution analysis of magnesium oxide, J. Geophys. Res., 98, 22 209–22 229, 1993. Freund, F. T.: On the electrical conductivity structure of the stable
continental crust, J. Geodynamics, 35, 353–388, 2003.
Freund, F. T.: Understanding pre-earthquake signals, Part I: Rocks turn into a battery, paper presented at SEE-5, Tehran, Iran, 2007. Freund, F. T., Takeuchi, A., Lau, B. W. S., et al.: Stress-induced changes in the electrical conductivity of igneous rocks and the generation of ground currents, Terrestrial, Atmos. Oceanic Sci. (TAO), 15, 437-468, 2004.
Freund, F. T., Takeuchi, A., and Lau, B. W.: Electric currents streaming out of stressed igneous rocks – A step towards un-derstanding pre-earthquake low frequency EM emissions, Phys. Chem. Earth, 31, 389–396, 2006.
Freund, F. T.: Stimulated IR emission from rocks: Assessing a stress indicator, eEarth, 2, 1–10, 2007.
Hayakawa, M.: Atmospheric and ionospheric electromagnetic phe-nomena associated with earthquakes, Terra Scientific Publ., Tokyo, 1999.
Igarashi, G., Tohjima, Y., and Wakita, H.: Time-variable response characteristics of groundwater radon to earthquakes, Geophy. Res. Lett., 20, 1807–1810, 1993.
Ikeya, M.: Earthquakes and Animals: from Folk Legends to Sci-ence, 295 pp., World Scientific, London, 2004.
Ismaguilov, V. S., Kopytenko, Yu. A., Hattori, K., et al.: ULF mag-netic emissions connected with under sea bottom earthquakes, Nat. Hazards Earth Syst. Sci., 1, 23–31, 2001,
http://www.nat-hazards-earth-syst-sci.net/1/23/2001/.
King, B. V. and Freund, F.: Surface charges and subsurface space charge distribution in magnesium oxide containing dissolved traces of water., Phys. Rev., B29, 5814–5824, 1984.
Kirschvink, J. L.: Comment on “Constraints on biological effects of weak extremely-low-frequency electromagnetic fields”, Physical Review A (Atomic, Molecular, and Optical Physics), 46, 2178– 2184, 1992.
Kushwah, V., Singh, B., and Hayakawa, M.: Ultra low frequency (ULF) magnetic field anomalies observed at Agra and their re-lation to moderate seismic activity in Indian region, J. Atmos. Sol.-Terr. Phys., 67, 992–1001, 2005.
Liperovsky, V. A., Pokhotelov, O. A., Liperovskaya, E. V., et al.: Modification of sporadic E-layers caused by seismic activity, Surveys in Geophysics, 21, 449–486, 2000.
Liu, J. Y., Chen, Y. I., Chuo, Y. J., and Tsai, H. F.: Variations of ionospheric total electron content during the Chi-Chi earthquake, Geophys. Res. Lett., 28, 1383–1386, 2001.
Liu, J. Y., Chen, Y. I., Pulinets, S. A., et al.: Seismo-ionospheric signatures prior to M=6.0 Taiwan earthquakes, Geophys. Res. Lett., 27, 3113–3116, 2000.
Liu, J. Y., Chuo, Y. J., Shan, S. J., et al.: Pre-earthquake ionospheric anomalies, Annales Geophysicae, 22, 1585–1593, 2004. Molchanov, O. A., Hayakawa, M., Oudoh, T., and Kawai, E.:
Pre-cursory effects in the subionospheric VLF signals for the Kobe earthquake, Phys. Earth Planet. Interiors, 105, 239–248, 1998. Ohta, K., Umeda, K., Watanabe, N., and Hayakawa, M.: ULF/ELF
emissions observed in Japan, possibly associated with the Chi-Chi earthquake in Taiwan, Nat. Hazards Earth Syst. Sci., 1, 37– 42, 2001,
http://www.nat-hazards-earth-syst-sci.net/1/37/2001/.
Ondoh, T.: Anomalous sporadic-E layers observed before M 7.2 Hyogo-ken Nanbu earthquake; Terrestrial gas emanation model, Adv. Polar Upper Atmos. Res., 17, 96–108, 2003.
Parrot, M.: Statistical study of ELF/VLF emissions recorded by a low-altitude satellite during seismic events, J. Geophys. Res, 99, 23 339–23 347, 1994.
Parrot, M., Berthelier, J. J., Lebreton, J. P., et al.: Examples of un-usual ionospheric observations made by the DEMETER satellite over seismic regions, Phys. Chem. Earth, 31, 486–495, 2006. Planinic, J., Radolic, V., and Lazanin, Z.: Temporal variations of
radon in soil related to earthquakes, Appl Radiat Isot., 55, 267– 272, 2001.
Plastino, W., Bella, F., Catalano, P. G., and Di Giovambattista, R.: Radon groundwater anomalies related to the Umbria-Marche, September 26, 1997, earthquakes, Geofisica Internacional, 41, 369–375, 2002.
Pulinets, S. and Boyarchuk, K.: Ionospheric Precursors of Earth-quakes, 350 pp., Springer, Heidelberg, 2004.
Pulinets, S. A., Alekseev, V. A., Legen’ka, A. D., and Khegai, V. V.: Radon and metallic aerosols emanation before strong earth-quakes and their role in atmosphere and ionosphere modification, Adv. Space Res., 20, 2173–2176, 1997.
Reinisch, B. W., Huang, X., Galkin, L. A., et al.: Recent advances in real-time analysis of ionograms and ionospheric drift mea-surements with digisondes, J. Atmos. Sol.-Terr. Phys., 67, 1054– 1062, 2005.
Russell, J. K. K. and Maya G.: A steady state conductive geotherm for the north central Slave, Canada: Inversion of petrological data from the Jericho Kimberlite pipe, J. Geophys, Res., 104, 7089– 7102, 1999.
Sorokin, V. M., Chmyrev, V. M., and Yaschenko, A. K.: Electro-dynamic model of the lower atmosphere and the ionosphere cou-pling, J. Atmos. Solar-Terrestr. Phys., 63, 1681–1691, 2001. Tributsch, H.: When the Snakes Awake: Animals and Earthquake
Prediction, 264 pp., MIT Press, Cambridge, Mass, 1984.