HAL Id: hal-00299529
https://hal.archives-ouvertes.fr/hal-00299529
Submitted on 30 May 2008
HAL is a multi-disciplinary open access
archive for the deposit and dissemination of
sci-entific research documents, whether they are
pub-lished or not. The documents may come from
teaching and research institutions in France or
abroad, or from public or private research centers.
L’archive ouverte pluridisciplinaire HAL, est
destinée au dépôt et à la diffusion de documents
scientifiques de niveau recherche, publiés ou non,
émanant des établissements d’enseignement et de
recherche français ou étrangers, des laboratoires
publics ou privés.
The predictability of the ”Voyager” accident
L. Bertotti, L. Cavaleri
To cite this version:
L. Bertotti, L. Cavaleri. The predictability of the ”Voyager” accident. Natural Hazards and Earth
System Science, Copernicus Publications on behalf of the European Geosciences Union, 2008, 8 (3),
pp.533-537. �hal-00299529�
www.nat-hazards-earth-syst-sci.net/8/533/2008/ © Author(s) 2008. This work is distributed under the Creative Commons Attribution 3.0 License.
and Earth
System Sciences
The predictability of the “Voyager” accident
L. Bertotti and L. Cavaleri
Institute of Marine Sciences, Castello 1364/A, 30122 Venice, Italy
Received: 16 January 2008 – Revised: 13 May 2008 – Accepted: 13 May 2008 – Published: 30 May 2008
Abstract. On 14 February 2005 a severe mistral storm caused substantial damage to the passenger cruiser “Voy-ager” between Balearic Islands and Sardinia. The storm had been well predicted. However, the ship was hit by one or more, apparently unexpected, large waves. Our aim was to understand if this was a freak event or it was within the ex-pectable probability. At this aim we use our best estimate of the local wave conditions, obtained combining modelling and measured data. Starting from these we derive the proba-bility of large waves, considering both linear and non-linear cases. Notwithstanding a correction towards the worse of the, otherwise inconsistent, available reports, on the basis of the data at disposal we conclude that, given the local conditions, the event was within the range of the potentially expectable wave heights. This turns out to be even more the case on the basis of recent results based on theoretical and experimental data.
1 The fact
On 14 February 2005 the passenger cruiser “Voyager” with about 800 people on board was on route between Tunis (Tunisia) and Barcelona (Spain), when it came across a se-vere mistral storm. In particular, at about 08:00 UTC the ship was struck by one or more major waves. From the various re-ports following the accident we have:
“A passenger ship, the Voyager . . . radioed a distress call earlier today after getting into difficulties in heavy seas. A huge wave shattered a bridge window, damaging control systems inside.”
While not in immediate danger, the ship suffered substan-tial damage. A general sudden shudder was reported, and the
Correspondence to: L. Cavaleri
shattered window(s) in the upper control room led to flood-ing of the general control system and brought all the engines to a halt. Eventually, after a few hours an engine was set in motion again and the ship carried on limping towards the Cagliari harbour in Sardinia.
The onboard report mentions waves between 9 and 14 m height. This corresponds to a severe, although not excep-tional, mistral storm (see Medatlas Group, 2004). Also, the storm was not unexpected, being fully described, although slightly underestimated, in the previous day forecasts, e.g. by the European Centre for Medium-Range Weather Fore-casts (ECMWF, Reading, UK). It is then natural to think to a freak wave, i.e. a wave whose height substantially exceeds what can be expected on the basis of the probability derived from linear theory (see, e.g., Longuet-Higgins, 1952). Using the available information and a careful hindcast, Bertotti and Cavaleri (2008, henceforth referred to as BC) have estimated the local wind and wave conditions in the area. Starting from their results, we analyse the wave conditions at the time and location of the accident to understand if what happened was within the realm of the expectable events or could be classi-fied as a freak wave.
To this end, after summarising the available information, in Sect. 2 we describe the wave conditions in the area of the accident as derived in BC. Allowing for a certain uncertainty on the actual figures, associated to an uncertainty on the exact location of the ship, in Sect. 3 we discuss first the probability of such a storm, and then the possible encounter with one or more wave heights capable to produce the reported damage. Our conclusions are drawn in Sect. 4.
534 L. Bertotti and L. Cavaleri: The predictability of the “Voyager” accident
Fig. 1. The wave fields in the Western Mediterranean Sea at 09:00 UT 14 February 2005, as reproduced running the WAM wave model with the COAMPS meteorological model winds. Isolines at 1 m intervals (after Bertotti and Cavaleri, 2008).
2 Available information
We consider modelled and measured data. Beginning with the latter ones, in principle we have available satellite and buoy data. In the present case no data are available from buoys, at least in the area of the peak conditions or close by. The storm had a strong southerly component (see Fig. 1), and it was directed from the gulf of Lion towards the Alge-rian coast. An interesting buoy, part of the Italian national network (see De Boni et al., 1993, for its description), was potentially available off Alghero, on the north-western cor-ner of Sardinia. However, the buoy was not working at the time of the storm.
Estimates of the significant wave heights Hs are
poten-tially available from the altimeters of the Topex, Jason and Envisat satellites. In the present case there was the lucky pass of Jason along a descending path directed along the axis of the storm only half an hour after the accident. Although not exactly on the vertical of the ship, its data allowed a thor-ough verification of the wave modelled data. These were obtained running the WAM model (Komen et al., 1994) with 0.25 degree resolution driven by two different wind sources: ECMWF and COAMPS, available as short term forecasts at three and one hour intervals respectively. The latter is the high resolution limited area version of the coarser, but global, NOGAPS model, both run at the Fleet Numerical Meteorol-ogy and Oceanography Center (FNMOC, Monterey, Califor-nia, USA). BC have carried out a careful verification of the two sets of wind fields using the scatterometer data avail-able from QuikSCAT. A pass was availavail-able in the morning of
14 February, and the large swath wind field at 25 km resolu-tion allowed a thorough comparison with the corresponding model data. Based also on the following comparison between wave model and Jason altimeter data, it turned out that, while the best-fit slope of the scatter diagram between COAMPS and QuikSCAT wind speeds was very close to unity, the ECMWF winds in the area of the storm required a 10% en-hancement. After this correction, both the wave hindcasts, with ECMWF and COAMPS winds, provided very similar significant wave heights Hs in the area of the accident. The
resulting modelled wave field, as derived using the COAMPS winds, is shown in Fig. 1. The ellipse indicates the uncer-tainty about the actual position of the ship, which implies that the estimate of the Hs value at the ship position varies
between 8 and 10 m. These are the figures on which to base the following estimate of the probability of freak waves.
3 The encounter probability
The storm of 14 February 2005 was severe, but not excep-tional. The wind and wave atlas for the Mediterranean Sea produced by the Medatlas Group (2004) provides an exten-sive statistics of the wind and wave conditions throughout the basin. The atlas has been derived from a ten year dataset obtained calibrating the ECMWF wind and wave model re-sults on the basis of a point by point comparison with ERS1-2 and Topex data. Although with some approximations, keenly discussed by Cavaleri and Sclavo (2006), the atlas provides a very good estimate of the wind and wave conditions, and related statistics, in the Mediterranean Sea. In particular, in the area of the Voyager accident the atlas suggests that an 8–9 m significant wave height can be expected a few times every year. Therefore we can conclude that, albeit severe, the storm was within the range of the practical local possibil-ities. In any case it had been properly forecast.
Given this range of significant wave heights, we discuss now the encounter probability of a 14 m high wave (crest to trough). According to linear theory (Longuet-Higgins, 1952), for a given Hs, the wave height statistics in a storm
is given by the Rayleigh distribution. A straightforward ap-plication shows that, in the conditions of the Voyager storm, such a wave height would be ridiculously frequent. A 14 m wave would appear on the average once every 1.5 and 0.18 h respectively for 8 and 10 m Hs. It is hard to believe that a
large cruiser can be heavily affected by such a relatively com-mon event. Therefore BC suggest that the reports were in-correct, and that the ship was hit by a 14 m wave crest (above mean sea level). This sounds like a more serious event, capa-ble to smash windows at the level of the control room deck.
We represent the linear theory encounter probability of a wave crest ηc higher than η (Longuet-Higgins, 1952) as
exp(−8(η/Hs)2). It is immediately evident that
consider-ing η=14 m leads to probabilities practically close to 0 (once every about 30 000 h for Hs=10 m, and much smaller for
Fig. 2. Record of the wave that hit the Draupner tower in the North
Sea on 1 January 1995.
Hs=8 m). On the other hand, it is clearly rather inappropriate
to rely on linear theory to describe such an event and, follow-ing Tayfun (1980) and Forristall (2000), we move to second order theory where, as reported in Tucker (1991), we have
P (ηc> η) = exp(−(8/R2)((1 + 2Rη/Hs)1/2−1)2) (1)
with R=kHs and k the wave number. Using Hs=10 m and
a wavelength L=225 m (deep water conditions), as derived from the hindcast (Tp=12 s), we find a 14 m high crest every
(about) 100 000 waves, i.e. once every 14 days. The proba-bility is about 500 times smaller if Hs=8 m.
The second order theory, on which (1) is based, does take a certain degree of nonlinearity into account, practically en-hancing the crests and flattening the troughs. However, it does not consider the highly non linear processes that leads to the formation of freak waves. These waves, so called because their characteristics seem to be well beyond what can be reasonably expected from linear theory, represent rare events, but still frequent enough to be in certain situations a real danger to the encountered vessels. Apart from enhanc-ing conditions due to bottom or current interactions, they seem to arise when a certain, already steep, wave starts bor-rowing energy from the close by companions reaching very large heights (more than twice or 2.2 times the local signifi-cant wave height) before releasing back the energy to the sur-rounding waves. So a freak wave is a transient situation, and this makes it very difficult to have related measured data. Of-ficially the first documented case of a large freak wave, 26 m high in an about 12 m Hsfield, was measured on the
Draup-ner oil platform in the North Sea off the coast of Norway on the 1 January 1995 (Fig. 2). Note that this wave had an 18.5 m crest height within an 11.5 m significant wave height field. Good descriptions of the event can be found in Sunde (1995) and Hagen (2002).
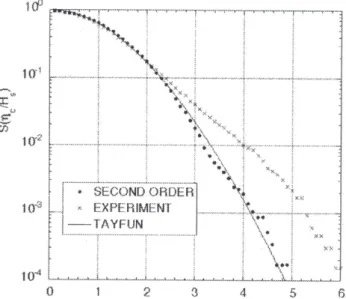
It is intrinsically difficult to verify the statistics of a rare natural phenomenon. It is much more convenient to rely of controlled experiments supported by a suitable theory. Ono-rato et al. (2006) have carried out a series of controlled ex-periments in a very large wave tank where, starting from
pre-Fig. 3. Encounter probability of a wave crest expressed (abscissa) as
multiple of the standard deviation of the sea surface (after Onorato et al, 2006).
defined controlled conditions, they let the waves evolve natu-rally along the wave flume. If the conditions were sufficiently nonlinear, i.e. if the initial waves were steep enough, but still within the range expected in nature, e.g. Hs/L=0.044, the
re-sults clearly showed that the wave height and crest statistics was well beyond what is suggested by linear and second or-der theories. For our present concern the relevant results are reported in Fig. 3, showing the statistical distribution of the crest heights with respect to the standard deviation of the sea surface, i.e. Hs/4., according to linear (Rayleigh) and second
order theories, and as shown by the experiments. In the range of the large crests, i.e. for abscissas larger than 4, we see that the experimental results indicate a frequency, hence probabil-ity, of large wave crests at least an order of magnitude larger than the indicated theories. Nonlinear theory, based on the nonlinear Schr¨odinger equation and the modulational insta-bility mechanism, fully support these results (see Dysthe and Trulsen, 1999, and Onorato et al., 2001).
Indeed, analysing the wave conditions in the area of the “Voyager”, BC have shown that, mutatis mutandis, the lo-cal wave spectra were similar to the ones of the experi-ment whose results are shown in Fig. 3, i.e. Hs/L=0.044
(Hs=10 m, Tp=12 s, hence L=225 m). It follows (see Fig. 3)
that a 14 m crest, i.e. a 5.6 value on the horizontal scale, cor-responds to an encounter probability of 1/6000. Given the lo-cal 12 s wave period, this corresponds to an event every 20 h. All the above results are summarised in Table 1, including the nonlinear one for Hs=8 m.
536 L. Bertotti and L. Cavaleri: The predictability of the “Voyager” accident
Table 1. Encounter probability of a 14 m high wave crest for different significant wave heights Hs and according to different theories. Tayfun is second order theory, NLS is modulational instability based on nonlinear Schr¨odinger equation. N is the average number of waves = 1/Probability between two encounters. Time is the corresponding elapsed time. Based on the wave conditions present at the time and location of the “Voyager” accident. The available data do not cover the case NLS – 8.
theory Hs(m) Probability N waves Time linear 8 0.23×10⁻¹⁰ 0.44×10¹¹ 10 000 years linear 10 0.15×10⁻⁶ 0.65×10⁷ 3 years Tayfun 8 0.45×10⁻⁷ 0.22×10⁸ 7 years Tayfun 10 10−5 105 14 days NLS 8 – – – NLS 10 0.17×10⁻³ 6000 20 hours 4 Discussion
The analysis of the wave conditions in the area of the “Voy-ager” accident, based both on modelled and measured data, indicates a local significant wave height between 8 and 10 m, the uncertainty deriving from the one on the actual position of the ship. Definitely we assume that the onboard report, as reported by the media, was wrong and, consistently with the reported damage, we stick to the hypothesis that she was hit by a 14 m wave crest.
The actual probability of such an event critically depends on the local Hsvalue, i.e. on the real position of the ship. If in
the Hs=8 m area, the probability, even considering the
non-linear theory, was indeed very low. This was not the case in the Hs=10 m area. The local strongly generative conditions,
with consequent steep and high waves, were very favourable to a highly nonlinear behaviour of the sea surface. Indeed, while the linear and second order theories provide a respec-tively very low and low probability of the considered event, the nonlinear, state-of-the-art approach, fully supported by experimental data, strongly suggests that a 14 m crest was a substantial possibility (once every 20 h). It is worthwhile to stress that the wave steepness that prepared the ground for possible freak waves is typical of strongly generative wave conditions. Obviously the wave or crest heights to deal with depend on the local significant wave height. The wave period is relevant only as determining the number of waves encoun-tered in a given period, which the encounter probability of given heights depends on.
We have asked ourselves the question if, assuming to be in the ten metres area, the person in charge had to consider this, nonlinear, possibility. The two older theories (Longuet-Higgins, 1952; Tayfun, 1980), which are probably well un-derstood by sea-farers, suggested very low probabilities (still a possibility of course, however more or less remote). The nonlinear approach changes drastically this result, indicat-ing the event as practically a daily one (in those conditions). The crucial point is if a published result, or better, a set of published papers, should be considered as public knowledge,
and therefore as background information for the persons in charge or the decision makers. This is a question that we cannot reply and leave to a more specialised audience.
Acknowledgements. We have much appreciated and enjoyed the
discussions with and suggestions from our friend and colleague Miguel Onorato.
Edited by: F. Guzzetti
Reviewed by: J. Wolf and another anonymous referee
References
Bertotti, L. and Cavaleri, L.: Analysis of the Voyager storm, Ocean Eng., 35, 1, 1–5, 2008.
Cavaleri, L. and Sclavo,M.: The calibration of wind and wave model data in the Mediterranean Sea, Coastal Eng., 53, 613–627, 2006.
De Boni, M., Cavaleri, L., and Rusconi, A.: The Italian wave mea-surement network, 23rd Int. Conf. Coastal Eng., 4–9 October 1992, Venice, Italy, 116–128, 3520 pp., 1993.
Dysthe, K. B. and Trulsen, K.: Note on breather type solutions of the NLS as a model for freak wves, Physica Scripta, T82, 48–52, 1999.
Forristall, G. Z.: Wave crest distributions: Observations and second-order theory, J. Phys. Ocean., 30, 1931–1943, 2000. Hagen, Ø.: Statistics for the Draupner January 1995 freak wave
event, Proc. OMAE-2000 Conference, Oslo, Norway, 2002. Komen, G. J., Cavaleri, L., Donelan, M., Hasselmann, K.,
Hassel-mann, S., and Janssen, P. A. E. M.: Dynamics and Modelling of Ocean Waves, Cambridge Univ. Press, 532 pp., 1994.
Longuet-Higgins, M. S.: On the statistical distribution of the heights of sea waves, J. Mar. Res., 11, 1245–1266, 1952. Medatlas Group: The wind and wave atlas of the Mediterranean
Sea, Western European Union, 419 pp. (available at the Institute of Marine Sciences, Venice, Italy), 2004.
Onorato, M., Osborne, A. R., Serio, M., and Bertone, S.: Freak waves in random oceanic sea states, Phys. Rev. Lett., 86, 5831– 5834, 2001.
Onorato, M., Osborne, A. R., Serio, M., Cavaleri, L., Brandini, C., and Stansberg, C. T.: Extreme waves, modulational instability
and second order theory: wave flume experiments on irregular waves, Europ. J. Mech: B Fluids, 25, 5, 586–601, 2006. Sunde, A.: Kjempebølger I Nordsjøen (Extreme waves in the North
Sea),, Vær & Klima, Nr. 1., 1995 (in Norwegian).
Tayfun, M. A.: Narrow-band nonlinear sea waves, J. Geophys. Res., 85, 1548–1522, 1980.
Tucker, M. J.: Waves in Ocean Engineering: Measurement Analy-sis, Interpretation, Hellis Horwood Ltd., UK, 431 pp., 1991.