HAL Id: hal-00295663
https://hal.archives-ouvertes.fr/hal-00295663
Submitted on 1 Jun 2005
HAL is a multi-disciplinary open access
archive for the deposit and dissemination of
sci-entific research documents, whether they are
pub-lished or not. The documents may come from
teaching and research institutions in France or
abroad, or from public or private research centers.
L’archive ouverte pluridisciplinaire HAL, est
destinée au dépôt et à la diffusion de documents
scientifiques de niveau recherche, publiés ou non,
émanant des établissements d’enseignement et de
recherche français ou étrangers, des laboratoires
publics ou privés.
photometer in SOLVE II: Comparisons to SAGE III,
POAM III and airborne spectrometer measurements
Prue Russell, J. Livingston, B. Schmid, J. Eilers, R. Kolyer, J. Redemann, S.
Ramirez, J.-H. Yee, W. Swartz, R. Shetter, et al.
To cite this version:
Prue Russell, J. Livingston, B. Schmid, J. Eilers, R. Kolyer, et al.. Aerosol optical depth measurements
by airborne sun photometer in SOLVE II: Comparisons to SAGE III, POAM III and airborne
spec-trometer measurements. Atmospheric Chemistry and Physics, European Geosciences Union, 2005, 5
(5), pp.1311-1339. �hal-00295663�
www.atmos-chem-phys.org/acp/5/1311/ SRef-ID: 1680-7324/acp/2005-5-1311 European Geosciences Union
Chemistry
and Physics
Aerosol optical depth measurements by airborne sun photometer in
SOLVE II: Comparisons to SAGE III, POAM III and airborne
spectrometer measurements
P. Russell1, J. Livingston2, B. Schmid3, J. Eilers1, R. Kolyer1, J. Redemann3, S. Ramirez3, J.-H. Yee4, W. Swartz4, R. Shetter5, C. Trepte6, A. Risley Jr.7, B. Wenny7, J. Zawodny6, W. Chu6, M. Pitts6, J. Lumpe8, M. Fromm9, C. Randall10, K. Hoppel9, and R. Bevilacqua9
1NASA Ames Research Center, MS 245-5, Moffett Field, CA 94035-1000, USA 2SRI International, Menlo Park, CA 94025, USA
3Bay Area Environmental Research Institute, Sonoma, CA 95476, USA
4Applied Physics Laboratory, Johns Hopkins University, Laurel, MD 20723-6099, USA 5National Center for Atmospheric Research, Boulder, CO 80307-3000, USA
6NASA Langley Research Center, Hampton, VA 23681-2199, USA 7SAIC, NASA Langley Research Center, Hampton, VA 23681-0001, USA 8Computational Physics, Inc., Springfield, VA 22151, USA
9Naval Research Laboratory, Washington, DC 20375-5351, USA
10Laboratory for Atmospheric and Space Physics, University of Colorado, Boulder, CO 80309-0392, USA
Received: 8 October 2004 – Published in Atmos. Chem. Phys. Discuss.: 5 November 2004 Revised: 25 February 2005 – Accepted: 1 April 2005 – Published: 1 June 2005
Abstract. The 14-channel NASA Ames Airborne
Track-ing Sunphotometer (AATS-14) measured solar- beam trans-mission on the NASA DC-8 during the second SAGE III Ozone Loss and Validation Experiment (SOLVE II). This paper presents AATS-14 results for multiwavelength aerosol optical depth (AOD), including comparisons to results from two satellite sensors and another DC-8 instrument, namely the Stratospheric Aerosol and Gas Experiment III (SAGE III), the Polar Ozone and Aerosol Measurement III (POAM III) and the Direct-beam Irradiance Airborne Spectrometer (DIAS). AATS-14 provides aerosol results at 13 wavelengths
λ spanning the range of SAGE III and POAM III aerosol wavelengths. Because most AATS measurements were made at solar zenith angles (SZA) near 90◦, retrieved AODs are
strongly affected by uncertainties in the relative optical air-mass of the aerosols and other constituents along the line of sight (LOS) between instrument and sun. To reduce depen-dence of the AATS-satellite comparisons on airmass, we per-form the comparisons in LOS transmission and LOS optical thickness (OT) as well as in vertical OT (i.e., optical depth,
OD). We also use a new airmass algorithm that validates the
algorithm we previously used to within 2% for SZA<90◦, and in addition provides results for SZA≥90◦.
Correspondence to: P. Russell
(philip.b.russell@nasa.gov)
For 6 DC-8 flights, 19 January–2 February 2003, AATS and DIAS results for LOS aerosol OT at λ=400 nm agree to ≤12% of the AATS value. Mean and root-mean-square (RMS) differences, (DIAS-AATS)/AATS, are −2.3% and 7.7%, respectively. For DC-8 altitudes, AATS-satellite com-parisons are possible only for λ>440 nm, because of signal depletion for shorter λ on the satellite full-limb LOS. For the 4 AATS-SAGE and 4 AATS–POAM near-coincidences con-ducted 19–31 January 2003, AATS-satellite AOD differences were ≤0.0041 for all λ>440 nm. RMS differences were
≤0.0022 for SAGE–AATS and ≤0.0026 for POAM–AATS. RMS relative differences in AOD ([SAGE–AATS]/AATS) were ≤33% for λ<∼755 nm, but grew to 59% for 1020 nm and 66% at 1545 nm. For λ>∼755 nm, AATS–POAM dif-ferences were less than AATS-SAGE difdif-ferences, and RMS relative differences in AOD ([AATS–POAM]/AATS) were
≤31% for all λ between 440 and 1020 nm. Unexplained differences that remain are associated with transmission differences, rather than differences in gas subtraction or conversion from LOS to vertical quantities. The very small stratospheric AOD values that occurred during SOLVE II added to the challenge of the comparisons, but do not explain all the differences.
0.0 4.0 8.0 12.0 16.0 20.0 24.0 28.0 32.0 MPV (PVU) 3.850•10 5 3.870•105 3.890 •105 3.910•105 3.930•105 MNST (J/kg^-1) WND2 (m/s)
12 UTC on 19 January, 2003 on the 460.0 K surface
NMC, Grid: GG1X1 Seq: E01, Spec: SSIAVN
3.870•105 3.890•105 3.890•10 5 3.910•105 3.910•10 5
12 UTC on 24 January, 2003 on the 460.0 K surface
3.850 •10 5 3.870•10 5 3.870•10 5 3.890 •105 3.890•10 5 3.910•105 3.910•10 5 3.930•105
12 UTC on 29 January, 2003 on the 460.0 K surface
3.850•10 5 3.850 •10 5 3.870•10 5 3.870•10 5 3.890 •10 5
12 UTC on 31 January, 2003 on the 460.0 K surface
3.870 •10 5 3.870 •10 5 3.890 •10 5 3.910 •10 5 3.910•10 5 3.930•10 5 3.950•105 3.950•105
12 UTC on 21 January, 2003 on the 460.0 K surface
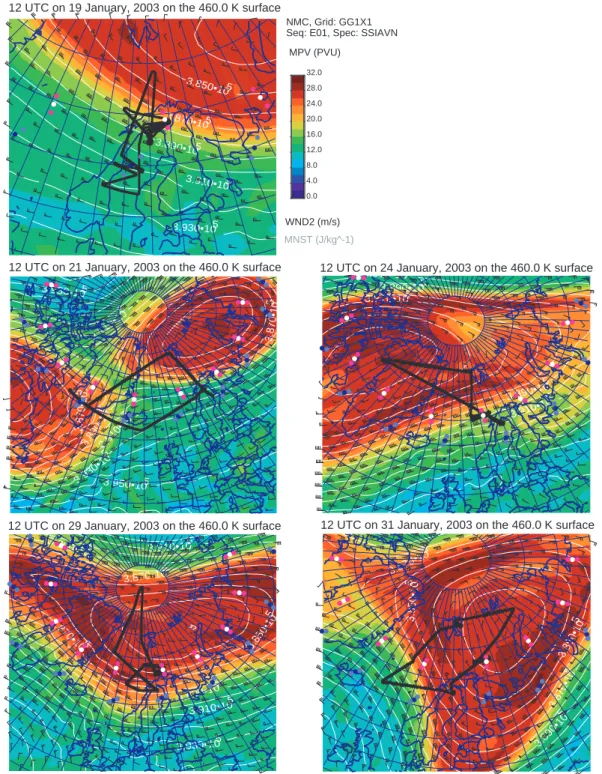
Fig. 1. DC-8 flight tracks (black) superimposed on 12 Z analysis maps of modified potential vorticity (MPV) for the 460 K isentropic surface. White and blue points mark occultations by SAGE III and POAM III, respectively. Maps were produced by L. Lait, M. Schoeberl, and P. Newman.
1 Introduction
The 14-channel NASA Ames Airborne Tracking Sunpho-tometer (AATS-14) measured solar- beam transmission on the NASA DC-8 during the second SAGE III Ozone Loss and Validation Experiment (SOLVE II). Flights were made
out of Kiruna, Sweden, and Dryden Flight Research Facil-ity in Southern California, USA. Livingston et al. (2005) describe the AATS-14 instrument, measurement procedures, and results for ozone. This paper presents AATS-14 results for multiwavelength aerosol optical depth (AOD), including its spatial structure and its relationship to results from two
satellite sensors and another DC-8 instrument. These are the Stratospheric Aerosol and Gas Experiment III (SAGE III), the Polar Ozone and Aerosol Measurement III (POAM III) and the Direct beam Irradiance Airborne Spectrometer (DIAS).
AATS-14 provides aerosol results at 13 wavelengths λ be-tween 354 and 2139 nm, spanning the full range of aerosol wavelengths for SAGE III (384–1545 nm) and POAM III (353–1018 nm). In this paper we show AATS results only for wavelengths 354–1558 nm, because no correlative mea-surements are available to compare to the AATS results at 2139 nm. The AATS-14 channels used in this paper have full width at half maximum (FWHM) of 2.0 to 5.6 nm, with most channel FWHMs ∼5 nm. Because most AATS mea-surements in SOLVE II were made at solar zenith angles (SZA) near 90◦, retrieved AODs are strongly affected by un-certainties in the relative optical airmass (here called airmass for brevity) of the aerosols and other constituents along the (generally refracted) line of sight (LOS) between instrument and sun. For any given constituent and/or wavelength, air-mass is defined as the ratio of LOS optical thickness (OT) to vertical OT. (In this paper we define vertical OT as op-tical depth (OD), and restrict use of OD to apply only to the vertical.) For SZA near 90◦, airmass of a given attenu-ator is sensitive to its vertical profile shape. Uncertainties in such vertical profiles therefore produce corresponding uncer-tainties in the associated airmass. To reduce dependence of the AATS-satellite comparisons on airmass, we perform the comparisons in LOS transmission and LOS OT as well as in vertical OT (or optical depth).
This paper shows AATS-satellite comparisons from DC-8 flights on five days: 19, 21, 24, 29, and 31 January 2003. Fig-ure 1 shows the DC-8 flight tracks for those days in relation to occultation locations of SAGE III and POAM III, super-imposed on maps of modified potential vorticity. This paper also shows AATS–DIAS comparisons for each of those five days, plus a sixth, 2 February 2003.
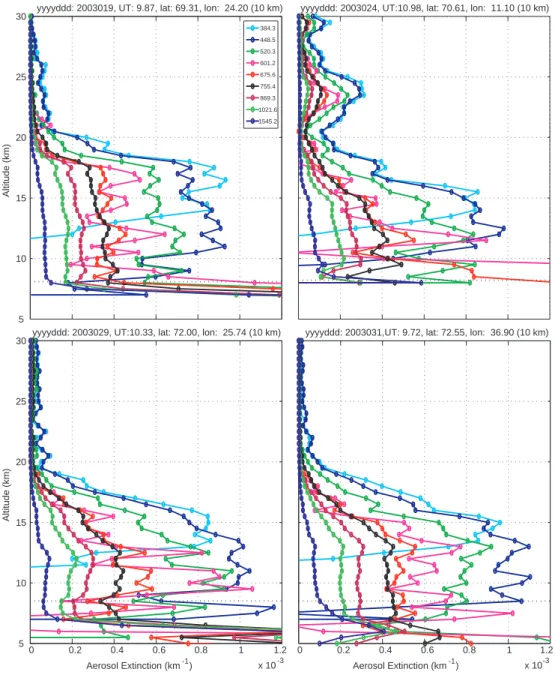
Figure 2 shows vertical profiles of multiwavelength aerosol extinction retrieved by SAGE III for the four occulta-tions near the DC-8 flight track on 19, 24, 29, and 31 January 2003. Figure 3 shows analogous POAM III results for the occultation near the DC-8 track on 19 January and the three occultations near the DC-8 on 21 January. In this paper, to obtain satellite AOD values for comparison to AATS AODs, we integrate vertically the latest versions of SAGE III and POAM III aerosol extinction profiles available at the time of writing, i.e., version 3.00 (v3.00) for SAGE III (e.g., Taha et al., 2004) and version 4 (v4) for POAM III (e.g., Randall et al., in preparation, 20051).
Before comparing the satellite results to AATS, we first use selected vertical profiles (some from previous versions
1Randall, C. E., Lumpe, J. D., Bevilacqua, R. M., Hoppel, K. W., et al.: POAM III validation: An update for version 4.0 aerosol, in preparation, 2005.
of SAGE III and POAM III) to help illustrate how airmass depends on extinction vertical profile, wavelength, and other factors.
2 Airmass dependence on SZA, extinction profiles, wavelength, and DC-8 altitude
Figure 4 shows how vertical distributions of different con-stituents affect airmass and its dependence on SZA. The ozone profiles shown are from SAGE III and POAM III oc-cultations near DC-8 flights reported in this paper and flown on the dates shown (e.g., 0119 is 19 January 2003). The aerosol profiles are from the same SAGE III and POAM III occultations, plus two composite or modified profiles (la-beled “SG0119AATSlay” and “Liv Aero Model” and de-scribed further below). Airmass results in the right frame were computed using a new algorithm (Yee al., 2002; De-Majistre and Yee, 2002; Vervack et al., 2002), which is es-sential to this study since it provides results for SZA<90◦,
=90◦, and >90◦, all of which were encountered in the DC-8 measurements reported here.
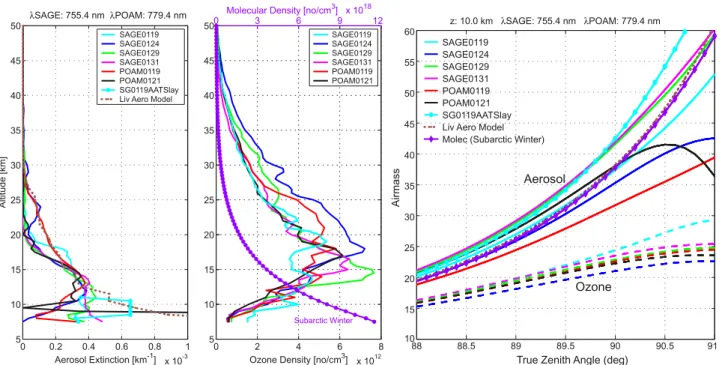
Results in Fig. 4 show some general features of note. For example, for a DC-8 altitude of 10 km, ozone airmass is in general less than aerosol airmass, and it depends less steeply on SZA. These results are caused by the fact that the ozone profile centroid is farther above the DC-8 than is the aerosol extinction profile centroid (see, e.g., Thomason et al., 1983). Aerosol airmasses at 10 km and SZA=90◦range from ∼32 to
∼42, a span of ±14% of the mean. Changing the shape of an aerosol profile by increasing its extinction just above the DC-8 but not elsewhere can increase its airmass significantly. For example, the aerosol profile “SG0119AATSlay” is the same as that labeled “SAGE0119”, except that its extinction is roughly doubled (increased to 6.5×10⁻³km−1)in a layer between 8 and 11 km. Note that this increased extinction near the DC-8 increases aerosol airmass at 10 km and 90◦from
∼37.5 to ∼42.5, or by 13%. The aerosol profile “Liv Aero Model” is a composite of typical high-latitude SAGE II and tropospheric aerosol extinction profiles. Its shape is not very different from the molecular density profile shown (which is the MODTRAN subarctic winter model). As shown in Fig. 4, this similarity in vertical distributions yields very sim-ilar curves of airmass vs. SZA.
For a given ozone number density profile, the extinc-tion profile has the same shape for any wavelength (apart from any temperature or pressure dependences that vary with wavelength – which we neglect in this paper). The same is true for a given molecular number density profile. Hence, apart from the wavelength dependence of the light path caused by refraction, ozone and Rayleigh airmasses are independent of wavelength. In contrast, a given aerosol num-ber density profile can have different shapes of extinction profiles at different wavelengths (this is illustrated by the pro-files in Figs. 2 and 3). Therefore, aerosol airmass is in general
5 10 15 20 25 30 Altitude (km)
yyyyddd: 2003019, UT: 9.87, lat: 69.31, lon: 24.20 (10 km)
384.3 448.5 520.3 601.2 675.6 755.4 869.3 1021.6 1545.2
yyyyddd: 2003024, UT:10.98, lat: 70.61, lon: 11.10 (10 km)
0 0.2 0.4 0.6 0.8 1 1.2 x 10⁻³ Aerosol Extinction (km-1)
yyyyddd: 2003031,UT: 9.72, lat: 72.55, lon: 36.90 (10 km)
0 0.2 0.4 0.6 0.8 1 1.2 x 10⁻³ 5 10 15 20 25 30 Aerosol Extinction (km-1) Altitude (km)
yyyyddd: 2003029, UT:10.33, lat: 72.00, lon: 25.74 (10 km)
Fig. 2. SAGE III v3.00 vertical profiles of aerosol extinction for the occultation events near the DC-8 on 19, 24, 29, and 31 January.
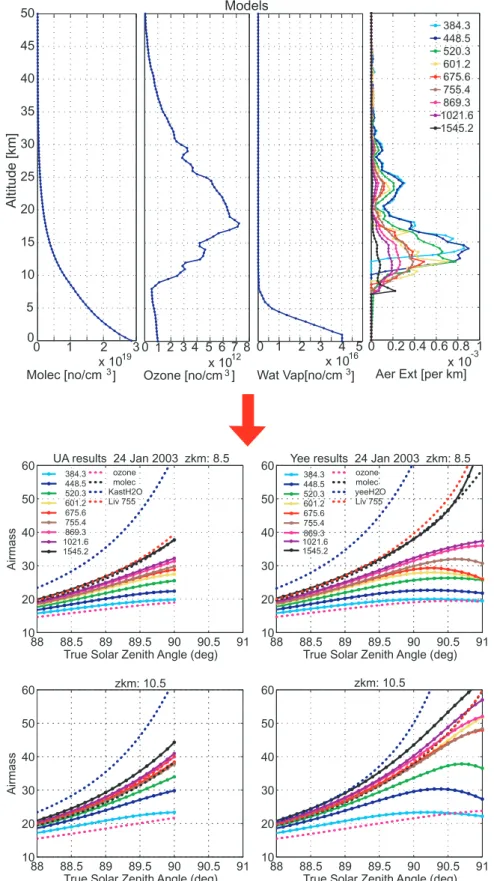
a function of wavelength. Whereas the aerosol airmass re-sults in Fig. 4 are for two very similar wavelengths (755.4 nm for SAGE III and 779.4 nm for POAM III), Fig. 5 illustrates the dependence of aerosol airmass on wavelength over the range 384 to 1545 nm. Shown are aerosol extinction profiles and corresponding airmass results for the SAGE III occul-tation near the DC-8 on 24 January 2003. For these cases, aerosol airmass increases with increasing wavelength, a con-sequence of the fact that increasingly longer wavelengths have extinction profiles with lower altitude centroids. (These lower centroids result from larger particles being increas-ingly dominant at lower altitudes, owing to sedimentation or
to growth in higher relative humidity). Results in the lower rightmost frame of Fig. 5 show that, at 10.5 km and 90◦, in-creasing the wavelength from 449 to 1545 nm causes the air-mass to increase from ∼30 to ∼43. This range is ±18% of the mean airmass, 36.5. Note that the intermediate wave-length, 755 nm, has airmass very near this mean. Note also that we have excluded the shortest wavelength, 384 nm, from this discussion, since SAGE III extinction profiles for this wavelength do not extend this low in altitude, owing to sig-nal depletion. We will return to these results when we discuss the sensitivity of our AOD retrievals to the assumptions in our analyses.
10 15 20 25 30 Altitude (km)
Date:011903 UT: 13.60 Lat: 64.95 Lon: 16.05 353.3 442.2 603.5 779.4 922.3 1018.3
Date:012103 UT: 14.64 Lat: 65.14 Lon: 1.74
0 0.5 1 1.5 2 x 10⁻³ 5 10 15 20 25 30
POAM Aerosol Extinction (km-1)
Altitude (km)
Date:012103 UT: 16.33 Lat: 65.15 Lon: -23.58
0 0.5 1 1.5 2
x 10-3
POAM Aerosol Extinction (km-1)
Date:012103 UT: 18.02 Lat: 65.16 Lon: -48.90
Fig. 3. POAM III v4 vertical profiles of aerosol extinction for the occultation events near the DC-8 on 19 and 21 January 2003.
Figure 5 also illustrates the height dependence of air-mass. In this case aerosol airmasses at SZA=90◦are less at
8.5 km than 10.5 km, because most aerosol extinction is far-ther above 8.5 km than 10.5 km.
Finally, Fig. 5 also compares airmasses computed by the Yee algorithm to those computed by the algorithm we previously used (Thomason et al., 1983), called UA in Fig. 5. The UA algorithm’s range of validity is SZA<90◦. Within that range, the Yee and UA algorithms give quite similar results, as can be seen by comparing the two rightmost columns of Fig. 5. For all the cases we have investigated, we find that the Yee and UA airmass results for ozone, Rayleigh, and aerosol agree to within 2% for SZA in the UA range of validity, i.e., SZA<90◦.
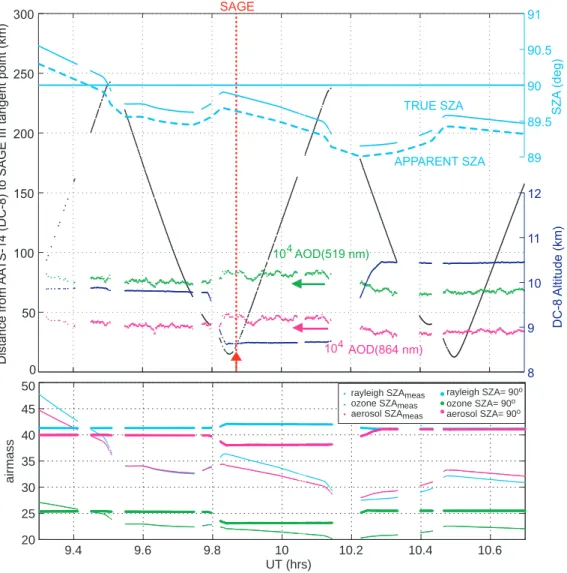
Figure 6 (bottom frame) shows time dependent airmasses,
mR, mO3, and ma, for Rayleigh, ozone, and aerosol,
respec-tively, obtained by applying the Yee airmass algorithm to the
SZAs and altitudes (top frame) experienced by the DC-8 on
19 January 2003 near the SAGE III occultation identified in the top left frame of Fig. 2. Aerosol airmass results were computed using the SAGE III aerosol extinction profile at wavelength 755 nm. For each time, airmass results are shown for two values of SZA: 90◦(apparent) and SZAmeas, the SZA
at the measurement time. The changes in mi(SZAmeas)with
time result from changes in both SZAmeasand DC-8 altitude.
Changes in mi(90◦) result from changes in DC-8 altitude
alone. These airmass factors, and all others used to analyze AATS-14 data in this paper and in Livingston et al. (2005), were obtained by interpolation in matrices of airmass fac-tors that were pre-calculated as a function of SZA (at 0.1◦
0 0.2 0.4 0.6 0.8 1 x 10⁻³ 5 10 15 20 25 30 35 40 45 50 Altitude [km] Aerosol Extinction [km-1] λSAGE: 755.4 nm λPOAM: 779.4 nm SAGE0119 SAGE0124 SAGE0129 SAGE0131 POAM0119 POAM0121 SG0119AATSlay Liv Aero Model
0 2 4 6 8 x 10¹² 5 10 15 20 25 30 35 40 45 50
Ozone Density [no/cm3] SAGE0119 SAGE0124 SAGE0129 SAGE0131 POAM0119 POAM0121 0 3 6 9 12
Molecular Density [no/cm3] x 1018
Subarctic Winter 88 88.5 89 89.5 90 90.5 91 10 15 20 25 30 35 40 45 50 55 60
True Zenith Angle (deg)
Airmass Aerosol Ozone SAGE0119 SAGE0124 SAGE0129 SAGE0131 POAM0119 POAM0121 SG0119AATSlay Liv Aero Model Molec (Subarctic Winter)
z: 10.0 km λSAGE: 755.4 nm λPOAM: 779.4 nm
Fig. 4. Left frames: Representative vertical profiles of aerosol extinction and of ozone and molecular number density. Aerosol and ozone profiles are from SAGE III and POAM III retrievals near DC-8 flights on the dates shown. Aerosol profiles are for one SAGE III wavelength (775.4 nm) and one POAM III wavelength (779.4 nm). The molecular density profile is the MODTRAN subarctic winter model. Right frame: Corresponding results for airmass calculated for altitude 10 km using the method of DeMajistre and Yee (2002) and the constituent profiles in the left frames.
resolution) and altitude (at 0.5-km resolution) for a particu-lar SAGE III or POAM III occultation event.
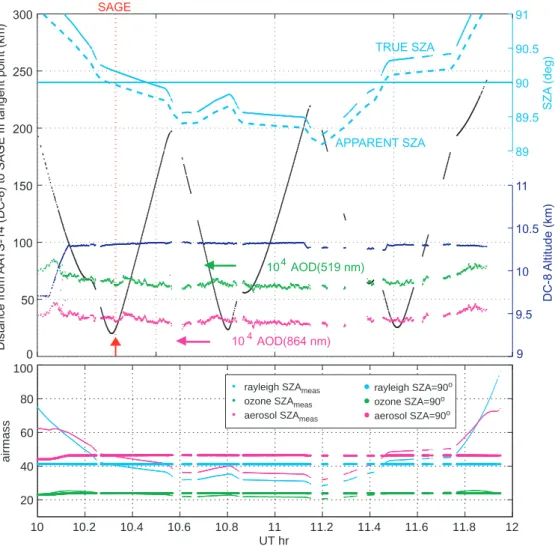
Figure 7 shows analogous results for the DC-8 flight and nearby SAGE III occultation on 29 January 2003. Not shown for brevity are analogous plots for the 24 and 31 January DC-8 flights, which experienced a range of SZA within those covered by the 19 and 24 January flights.
The following section presents results that use these air-mass computations, both to solve for AODs from AATS mea-surements and to convert AATS transmissions measured at
SZAmeas to transmission at an apparent (refracted) SZA of
90◦.
3 AATS–SAGE comparisons
3.1 AATS-14 and SAGE III AODs from conventional anal-yses
We first obtained AODs from AATS and SAGE measure-ments by conventional analyses. That is, we obtained AATS
AODs using the method described in the Appendix of Russell
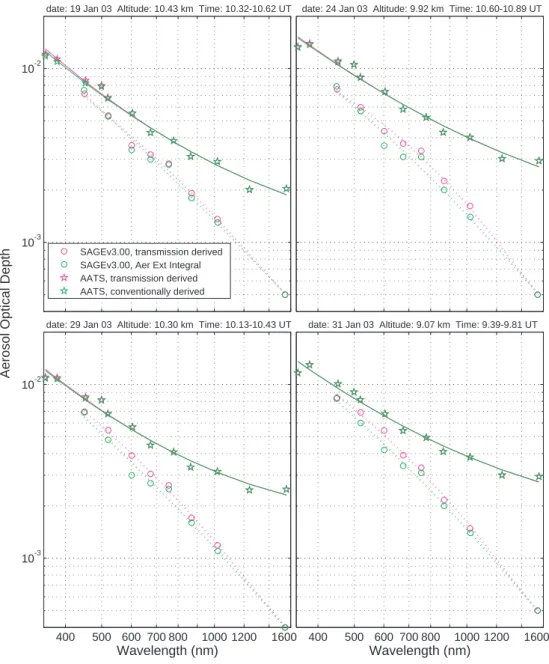
et al. (1993), and we obtained SAGE AODs by vertically in-tegrating the SAGE aerosol extinction profiles in Fig. 2 above the DC-8 altitude. AATS AOD results at two selected wave-lengths, 519 and 864 nm, are shown in Figs. 6 and 7 as time series, along with time series of DC-8 altitude and distance
from the SAGE III tangent point. Figure 8 shows the AATS results as AOD spectra (green stars labeled “AATS, conven-tionally derived”), along with the SAGE AOD results (green circles labeled “SAGE v3.00, Aer Ext Integral”).
The results in Fig. 8 show that the conventional analyses yield SAGE AODs that are systematically less than AATS
AODs, and that the percentage difference between the SAGE
and AATS AODs increases with wavelength.
Because of these systematic AOD differences, and because of the strong dependences of AATS-derived AODs on air-mass, of SAGE-derived AODs on path-length matrices, and of both AATS- and SAGE-derived AODs on Rayleigh scat-tering and absorbing gas retrievals, we have also compared AATS and SAGE in the more fundamental result, transmis-sion of the direct beam. We have also derived AODs from the AATS and SAGE transmissions using a more transmission-oriented analysis, which helps to show the relative roles of gas and aerosol attenuation at the various wavelengths. These transmission-oriented results are described in the following subsections.
Before presenting the transmission-oriented results we also note that we have performed a “modified conventional” AATS analysis, which excludes all times that had apparent
SZA>90◦. (Such times can be identified in Figs. 6–7.) Our motivation for doing this was that, for such SZA, the AATS LOS passes through altitudes below the DC-8, which are not included in the SAGE extinction integrals used to get
88 88.5 89 89.5 90 90.5 91 10 20 30 40 50 60
True Solar Zenith Angle (deg)
Airmass UA results 24 Jan 2003 zkm: 8.5 384.3 448.5 520.3 601.2 675.6 755.4 869.3 1021.6 1545.2 ozone molec KastH2O Liv 755 88 88.5 89 89.5 90 90.5 91 10 20 30 40 50 60
True Solar Zenith Angle (deg) Yee results 24 Jan 2003 zkm: 8.5
384.3 448.5 520.3 601.2 675.6 755.4 869.3 1021.6 1545.2 ozone molec yeeH2O Liv 755 88 88.5 89 89.5 90 90.5 91 10 20 30 40 50 60
True Solar Zenith Angle (deg)
Airmass zkm: 10.5 88 88.5 89 89.5 90 90.5 91 10 20 30 40 50 60
True Solar Zenith Angle (deg) zkm: 10.5 0 1 2 3 x 10¹⁹ 0 5 10 15 20 25 30 35 40 45 50 Molec [no/cm3] Altitude [km] 0 1 2 3 4 5 x 10¹⁶ Wat Vap[no/cm3] 0 1 2 3 4 5 6 7 8 x 10¹² Ozone [no/cm3] 0 0.2 0.4 0.6 0.8 1 x 10⁻³ Aer Ext [per km]
384.3 448.5 520.3 601.2 675.6 755.4 869.3 1021.6 1545.2 Models
Fig. 5. Comparison of airmass results from the methods of DeMajistre and Yee (2002, labeled Yee) and Thomason et al. (1983, labeled UA), for different wavelengths of aerosol extinction and for molecular, ozone, and water vapor number density. Profiles in the left frames yield the airmasses in the right frames for two altitudes: 8.5 km (top row) and 10.5 km (bottom row).
0 50 100 150 200 250 300 Distance from AA
TS-14 (DC-8) to SAGE III tangent point (km) 10
4 AOD(519 nm) 104 AOD(864 nm) 8 9 10 11 12 DC-8 Altitude (km) 89 89.5 90 90.5 91 SZA (deg) TRUE SZA APPARENT SZA SAGE 9.4 9.6 9.8 10 10.2 10.4 10.6 20 25 30 35 40 45 50 UT (hrs) airmass
rayleigh SZAmeas
ozone SZAmeas
aerosol SZAmeas
rayleigh SZA= 90o ozone SZA= 90o aerosol SZA= 90o
Fig. 6. Conditions and results for the DC-8 flight of 19 January 2003. Top: DC-8 altitude, distance from SAGE III 10-km tangent point, and true and apparent (refracted) SZA, with AOD retrieved from AATS-14 at two wavelengths. Red vertical dotted line marked by red arrow and “SAGE” shows time of SAGE III tangent at 10 km altitude. Bottom: Airmasses for Rayleigh, ozone, and aerosol (755 nm), at SZAmeasand apparent SZA=90◦, computed using the Yee algorithm. Results shown used SAGE III version 2.00 profiles, but results using version 3.00 differ by <2%.
SAGE AOD above the DC-8. AATS AODs from the mod-ified conventional analyses (not shown for brevity) differed from the conventional results in Fig. 8 by 8% or less at all wavelengths, and hence did little to reduce the AATS-SAGE differences.
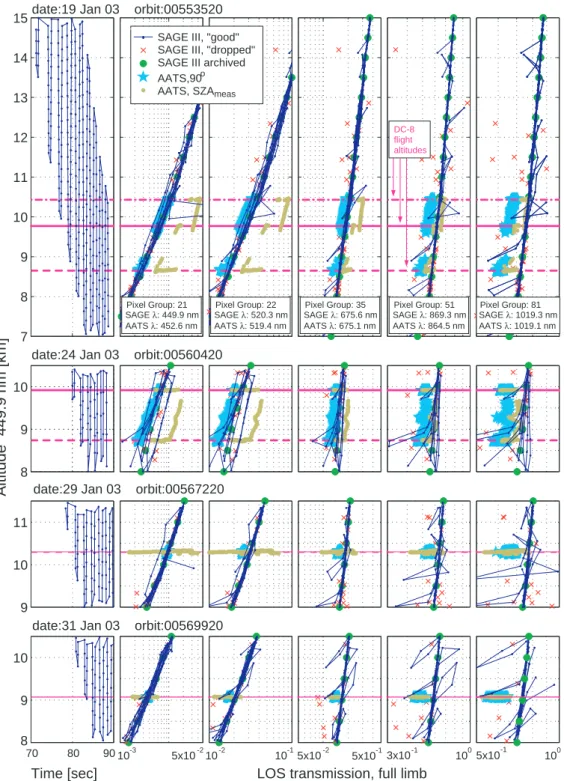
3.2 AATS-14 and SAGE III transmission measurements Figure 9 shows vertical profiles of transmission measured by SAGE III during four solar occultation events that were the focus of DC-8 maneuvers on 19, 24, 29, and 31 January 2003 during SOLVE II. These are full-limb atmospheric transmis-sions, meaning that they describe transmission through the full atmospheric limb between the spaceborne SAGE III in-strument and the Sun. Results are shown for five selected
SAGE III wavelengths, which are defined by pixel groups in the array detector of the SAGE III spectrometer. The SAGE III transmission measurements are made by scanning its pointing mirror up and down across the Sun as SAGE III’s movement in its orbit makes the Sun appear to rise or set (NASA Langley Research Center, 2002). The left column of Fig. 9 shows the altitude-vs-time trace of the tangent point of the lowest atmospheric shell traversed by the refracted line of sight (LOS) from SAGE III to the Sun. Because refraction is wavelength dependent, the altitude-vs-time traces are also wavelength dependent. The result shown is for wavelength 449.9 nm (SAGE III pixel group 21).
As Fig. 9 shows, the scans across the sun produce many transmission measurements for a given tangent altitude in-terval. The transmission measurements initially identified as
0 50 100 150 200 250 300 Distance from AA
TS-14 (DC-8) to SAGE III tangent point (km)
104 AOD(519 nm) 104 AOD(864 nm) 9 9.5 10 10.5 11 DC-8 Altitude (km) 89 89.5 90 90.5 91 SZA (deg) TRUE SZA APPARENT SZA SAGE 10 10.2 10.4 10.6 10.8 11 11.2 11.4 11.6 11.8 12 20 40 60 80 100 UT hr airmass
rayleigh SZAmeas ozone SZAmeas aerosol SZAmeas
rayleigh SZA=90o ozone SZA=90o aerosol SZA=90o
Fig. 7. As in Fig. 6, but for 29 January 2003. Airmass results shown used SAGE III version 2.00 profiles, but results using version 3.00 differ by <6%.
“good” by the SAGE III retrieval algorithm are shown by the points and curves labeled ‘SAGE III, “good”’ in Fig. 9. Other points, identified as “dropped” by the algorithm, are also shown. The SAGE III algorithm groups transmissions into altitude bins 0.5 km thick, and archives the median of each group of “good” points. These archived median values are labeled “SAGE III archived” in Fig. 9. Using median values reduces or eliminates the influence of outliers among the points initially identified as “good”. Such outliers can be seen in Fig. 9. Outliers can be caused by misregistration of transmitted solar intensity values near scan edges (i.e., within the solar limb-darkening region), among other reasons.
Also shown in Fig. 9 are transmission results from AATS-14 measurements. AATS transmissions are shown both as measured at the AATS measurement SZA, SZAmeas,
and as converted from SZAmeas to the apparent (refracted)
SZA of 90◦ that occurs along the SAGE limb viewing path
at its tangent point. This conversion process is explained in Sect. 3.3. All AATS transmissions in Fig. 9 have also been
squared to convert from half limb to full limb. This squaring assumes that transmission is equal in the two limb halves (i.e., from DC-8 to the Sun and from DC-8 away from the Sun). Equal transmission in the two limb halves is just a special case of the homogeneity in spherical shells that is assumed by satellite limb inversion algorithms. We discuss this assumption further in Sect. 6.
As elaborated in Sect. 3.3, the conversion of AATS trans-mission from SZAmeas to 90◦ depends on differences
be-tween airmasses at SZAmeas and at 90◦, rather than on
air-masses themselves. It is thus less sensitive to airmass than is, e.g., the conversion from transmission to vertical OD. This is increasingly so as apparent SZAmeasapproaches or equals
90◦, as it did on several DC-8 flights (see the SZA curves in Figs. 6–7). Examples of SZAmeasequaling 90◦(apparent) in
Fig. 9 are given by the data points for 24, 29, and 31 Jan-uary where transmissions labeled “AATS, 90◦” equal those labeled “AATS, SZAmeas”.
10-3 10-2
date: 19 Jan 03 Altitude: 10.43 km Time: 10.32-10.62 UT
SAGEv3.00, transmission derived SAGEv3.00, Aer Ext Integral AATS, transmission derived AATS, conventionally derived
date: 24 Jan 03 Altitude: 9.92 km Time: 10.60-10.89 UT
400 500 600 700 800 1000 1200 1600
10-3 10-2
Wavelength (nm)
Aerosol Optical Depth
date: 29 Jan 03 Altitude: 10.30 km Time: 10.13-10.43 UT
400 500 600 700 800 1000 1200 1600
Wavelength (nm)
date: 31 Jan 03 Altitude: 9.07 km Time: 9.39-9.81 UT
Fig. 8. Comparison of AOD spectra from AATS-14 and SAGE III measurements on 19, 24, 29, and 31 January 2004.
3.3 Converting AATS transmissions to 90◦refracted SZA
Converting transmission T from one SZA to another requires knowing the components (or factors) making up transmis-sion, as well as the relative vertical distribution of each com-ponent above the observation altitude. As noted above, the vertical distributions are needed to determine the SZA depen-dence of the airmasses for all components with significant attenuation. That is,
T (SZA) =
Ta(SZA)TR(SZA)TN O2(SZA)TO3(SZA)TO2−O2(SZA) . . . , (1)
where subscripts indicate the attenuating component (a for aerosol, R for Rayleigh, etc.), and
Ti(SZA) =exp[−2mi(SZA)ODi], (2)
where mi and ODi are the airmass and OD of constituent i.
The factor 2 gives transmission for the full path into and out of the atmosphere at SZA (which is the full limb path when refracted – i.e., apparent – SZA=90◦). Any T in this paper is
for this full path.
For each measurement time we solved Eq. (1) for Taas:
Ta(SZA) =
7 8 9 10 11 12 13 14
15date:19 Jan 03 orbit:00553520
8 9 10
Altitude 449.9 nm [km]
date:24 Jan 03 orbit:00560420
9 10 11
date:29 Jan 03 orbit:00567220
70 80 90
8 9 10
Time [sec] LOS transmission, full limb
date:31 Jan 03 orbit:00569920
10-3 5x10-210-2 10-15x10-2 100 100
SAGE III, "good" SAGE III, "dropped" SAGE III archived
AATS,90o
AATS, SZAmeas
Pixel Group: 21 SAGE λ: 449.9 nm AATS λ: 452.6 nm Pixel Group: 22 SAGE λ: 520.3 nm AATS λ: 519.4 nm Pixel Group: 35 SAGE λ: 675.6 nm AATS λ: 675.1 nm Pixel Group: 51 SAGE λ: 869.3 nm AATS λ: 864.5 nm Pixel Group: 81 SAGE λ: 1019.3 nm AATS λ: 1019.1 nm DC-8 flight altitudes -1 5x10 3x10⁻¹ 5x10⁻¹
Fig. 9. SAGE III vertical profiles of transmission at representative wavelengths for the occultation events near the DC-8 on 19, 24, 29, and 31 January, with near-coincident AATS transmission values at the AATS measurement SZA, SZAmeas, and converted to apparent SZA=90◦.
To convert from the apparent SZA of the AATS measure-ment, SZAmeas, to an apparent SZA of 90◦we used Eq. (2)
at SZAmeasand 90◦to obtain
Ti(90◦) =
Ti(SZAmeas)exp{2[mi(SZAmeas) − mi(90◦)]ODi}, (4)
with mi and ODi inputs as described below. Line-of-sight
optical thicknesses, LOSOT, were obtained as
LOSOTi(SZA) = −ln[Ti(SZA)] (5)
and aerosol optical depths (AODs) as
10-2 10-1 100
LOS transmission (full limb) O3 column AATS=254.76 DU
NO
2 column =7.45e+014 cm
-2 date: 19 Jan 03 Altitude: 10.43 km Time: 10.32-10.6 2 UT
10-2 10-1 100
LOS Optical Thickness (full limb)
TOTAL Rayleigh Aerosol O 3 NO 2 O2 O2-O2 DIAS,SZA meas 400 500 600 700 800 900 1000 1200 1400 1600 10-4 10-3 10-2 Wavelength (nm)
Vertical Optical Depth
SZAmeas
SZA=90o
+
Fig. 10. AATS transmission, LOSOT, and OD, for components and totals, for 19 January 2003 at 10.43 km. Top frame: transmission at
SZAmeasand converted to 90◦; middle frame: LOSOT at SZAmeasand converted to 90◦; bottom frame: OD.
This conversion process is illustrated in Fig. 10 for the DC-8 leg at 10.43 km, 10.32–10.62 UT on 19 January 2003. As shown by the top frame of Fig. 6, during 10.32–10.62 UT, the DC-8 was within 100 km of the SAGE III tangent point, and the apparent (refracted) SZA varied between ∼89.0◦ and 89.4◦. Quantities that depend on SZA (i.e., Ti(SZA) in
the top frame of Fig. 10, and LOSOTi(SZA) in the middle
frame) were computed at each measurement time using the time-dependent airmasses, mR, mO3, and ma, shown
in the bottom frame of Fig. 6. Results for Ti(SZA) and
LOSOTi(SZA) were then averaged over 10.32–10.62 UT to
obtain the illustrative results shown in Fig. 10.
ODi inputs used in Fig. 10 were obtained as follows: – Rayleigh: Pressure at DC-8 and wavelength, using the
equation of Bucholtz et al. (1995), which gives results that differ negligibly (e.g., by 0.06% to 0.02% for λ between 380 and 1019 nm) from results obtained using Bodhaine et al. (1999).
– NO2: SAGE III retrieved column amount with
wavelength-dependent cross sections (see below).
– Ozone: AATS-14 retrieved column amount (Livingston
et al., 2005) with wavelength-dependent cross sections (see below).
10-2 10-1 100
LOS transmission (full limb)
O 3 column AATS=254.76 DU O3 column SAGE=283.60 DU NO 2 column =7.45e+014 cm -2 date: 19 Jan 03 Altitude: 10.43 km Time: 10.32-10.6 2 UT
10-2 10-1 100
LOS Optical Thickness (full limb)
TOTAL Rayleigh Aerosol O 3 NO 2 O2 + O2 - O2 400 500 600 700 800 900 1000 1200 1400 1600 10-4 10-3 10-2 Wavelength (nm)
Vertical Optical Depth
SAGE: AATS:
SZA=90o
Fig. 11. Comparison of SAGE and AATS transmission, LOSOT, and OD, by components and totals, for 19 January 2003 at 10.43 km. All AATS results for T and LOSOT have been converted from SZAmeasto apparent SZA 90◦.
– O2-O2: Midlatitude summer atmosphere for O2, with
O2-O2 calculated as a function of altitude, plus
wavelength-dependent cross sections (see below). As shown by Livingston et al. (2005), the AATS retrieved ozone columns agree with the corresponding SAGE III val-ues to an RMS difference of 18 Dobson units (DU), or
∼6%. The largest AATS-SAGE difference, 30 DU, was ob-served on 19 January 2003. Ozone column spatial variabil-ity observed by AATS along the flight path was compara-ble to these AATS-SAGE ozone differences. The OD of 30 DU of ozone is 0.004 at 605 nm, the peak of the Chap-puis absorption band. Wavelength-dependent gas absorption
cross-sections were computed using the Line-by-Line Ra-diative Transfer Model LBLRTM 6.01 (Clough and Iacono, 1995) with the CKD 2.4.1 continuum model using the High Resolution Transmission HITRAN 2000 (v11.0) line-list (Rothman et al., 2001; Rothman and Schroeder, 2002). NO2
cross-sections not included in LBLRTM 6.01 were taken from Harder et al. (1997). Absorbing gas optical depth and transmission values shown in Fig. 10 as data points at AATS-14 wavelengths take into account the interference filter func-tion of each AATS-14 channel. Typical channel full widths at half maximum (FWHM) are 5 nm. Although the absorb-ing gas optical depth and transmission values in Fig. 10 do not account for solar spectral variations within the AATS
10-4 10-3 10-2 10-1 O 3 column AATS=254.76 DU O 3 column SAGE=283.60 DU NO 2 column =7.45e+014 cm -2 TOTAL Rayleigh Aerosol O3 NO2 O +2 O2-O2
date: 19 Jan 03 Altitude: 10.43 km Time: 10.32-10.62 UT
O 3 column AATS=411.70 DU O3 column SAGE=422.00 DU NO 2 column =1.32e+015 cm -2
date: 24 Jan 03 Altitude: 9.92 km Time: 10.60-10.89 UT
400 500 600 700 800 1000 1200 1600 10-4 10-3 10-2 10-1 Wavelength (nm)
Vertical Optical Depth
O 3 column AATS=372.46 DU O 3 column SAGE=353.00 DU NO 2 column =1.3e+015 cm -2
date: 29 Jan 03 Altitude: 10.30 km Time: 10.13-10.43 UT
400 500 600 700 800 1000 1200 1600 Wavelength (nm) O 3 column AATS=315.45 DU O 3 column SAGE=308.00 DU NO 2 column =1.8e+015 cm -2
date: 31 Jan 03 Altitude: 9.07 km Time: 9.39-9.81 UT SAGE:
AATS: SZA=90o
Fig. 12. Comparison of AATS and SAGE vertical OD (total and components) for 19, 24, 29, and 31 January 2003. Values were obtained using the procedure described in Sect. 4 and illustrated in Fig. 10.
channel widths, we have performed other calculations that do account for these variations and found that transmissions calculated by the two methods differ by less than 1%. These more detailed calculations use the Kurucz (1995) solar spec-trum, absorbing gas spectra from MODTRAN (Kneizys et al., 1996), the Rayleigh scattering results of Bucholtz et al. (1995), and aerosol extinction spectra typical of those in Figs. 8, 10–12, and 15. The reason for the small dif-ferences is the limited variation within each AATS channel of the optical depths ODi(λ) for the constituents relevant to
this paper. These same comparisons also show that Eqs. (1)– (6), which are exact for monochromatic radiation, also apply with similar accuracy to the AATS channels used, and the
constituents addressed, in this paper–despite the solar fine structure within each channel.
The curves in Fig. 10 are drawn to guide the eye. Those for the absorbing gases (O3, NO2, O2-O2)were adapted from
results of the Moderate Resolution Transmission (MOD-TRAN) Code (Kneizys et al., 1996) using a view path from 10.4 km to space at a solar zenith angle of 90◦and a FWHM of 50 cm−1. (This FWHM in wavenumber corresponds to a FWHM in wavelength of 0.614 to 12.8 nm over the wave-length range 350–1600 nm. The wavenumber increment of the MODTRAN calculations is 1 cm−1, or 0.01225 to 0.256 nm in wavelength). The symbols for the absorbing gas results in Fig. 10 do not fall exactly on the curves because
of the different methods used to calculate symbol and curve positions. That is, the symbol positions are calculated us-ing AATS-14 filter functions with LBLRTM, HITRAN, etc. (details above), whereas the curves use MODTRAN with a FWHM fixed in wavenumber but varying in wavelength. De-spite these differences, we feel that the curves help to illus-trate the physics behind the symbol positions. We emphasize that it is the symbols that give the values used for each AATS-14 channel when converting from SZAmeas to 90◦and when
deriving aerosol LOS OT and OD.
We have excluded from Fig. 10 the AATS-14 channel at 941 nm, which is strongly affected by water vapor absorption and in fact used to retrieve water vapor (e.g., Schmid et al., 1996, 2001). The other AATS-14 channels shown in Fig. 10 are only weakly affected by water vapor absorption, and so the analyses shown here do not account for water vapor ef-fects (though our traditional analyses do – see, e.g., Schmid et al., 1996, 2001).
The curves for aerosol OD and LOSOT in Fig. 10 are fits of the form
log ODa=c0+c1log λ + c2(log λ)2, (7)
where the ciare fitting coefficients (see also Livingston et al.,
2005). As with the absorbing gas curves, they are drawn to guide the eye, and are not used in deriving aerosol OD and
LOSOT at AATS-14 wavelengths. Aerosol LOSOT and OD
are derived at each AATS-14 channel wavelength by using Eqs. (5) and (6) above.
Curves for total OD and total LOSOT in Fig. 10 were ob-tained by adding curves for components. Curves for total transmission T were obtained by multiplying curves for com-ponents, as in Eq. (1).
Vertical profile inputs used to get mi in Fig. 6 (hence
Fig. 10) were obtained as follows (see also Sect. 2):
– Rayleigh: The MODTRAN subarctic winter molecular
density model.
– NO2: Same as ozone (see below).
– Ozone: The SAGE III or POAM III profile closest to
the DC-8. (If a profile did not extend down to the DC-8 altitude, it was extended using the ozone concentration measured on the DC-8.)
– O2-O2: Same as Rayleigh.
– Aerosol: SAGE III aerosol extinction profiles at
wave-length 755 nm (Fig. 2. Changes in SAGE III data ver-sions affect extinction profile shapes, and therefore air-mass values. However, the change from SAGE III v2.00 to v3.00 affected aerosol airmass by <2%.)
Notice in Fig. 10 (middle frame) that converting from
SZAmeas to 90◦ shifts ozone LOSOT results less than
Rayleigh and aerosol LOSOT. This is explained by Eq. (4) along with the facts that 1mO3<1mR and 1mO3<1ma,
where 1mi=mi(90◦)−mi(SZAmeas). The relevant values of
miare shown in, e.g., Figs. 4 and 6. As mentioned in Sect. 2,
the reason that mO3<mR and mO3<ma is that most ozone
extinction was farther from the DC-8 than most Rayleigh and aerosol extinction.
3.4 Transmission-derived AATS-SAGE comparison results Figure 11 shows, for 19 January at 10.43 km, the SAGE archived values for total transmission T (which were previ-ously shown at selected wavelengths in the top row of Fig. 9), for total LOSOT (obtained from T using Eq. (5) without the subscript i), and total OD (obtained using components as fol-lows). Results for the components (aerosol, Rayleigh, NO2,
ozone, O2-O2)were obtained by applying to the SAGE
to-tal transmission values the method of Sect. 3.3. That is, we used Eqs. (3) and (2) at apparent (refracted) SZA=90◦, with the inputs listed in Sect. 3.3 – except that SAGE-retrieved ozone was used in place of AATS-retrieved ozone. Also, at each SAGE wavelength, we used absorbing gas cross sec-tions computed from MODTRAN as described in Sect. 3.3. These cross sections differ somewhat from the cross sec-tions used in the standard processing that produces the SAGE archived data products. Table 1 shows how the MODTRAN and SAGE-standard cross sections compare. Note, for ex-ample, that, at the 601-nm peak of the Chappuis ozone ab-sorption band, the MODTRAN and SAGE-standard cross sections agree to within a few percent. Percent differences are larger at other wavelengths and for NO2. However,
where cross section differences exceed 10%, the cross sec-tions themselves are relatively small, producing absorbing gas optical depths that are less than or equal to aerosol opti-cal depth (AOD). This can be seen by comparing the entries in Table 1 with the optical depths shown in Fig. 11. Hence, these cross section differences would impact the SAGE AOD values we derive by 10% or less.
To facilitate AATS-SAGE comparisons, we also show in Fig. 11 the AATS results, for components and totals, at ap-parent SZA=90◦, previously shown in Fig. 10.
This same transmission-oriented analysis was applied to the AATS-SAGE near-coincidences on 24, 29, and 31 Jan-uary 2003. Resulting AATS-SAGE comparisons, in terms of vertical OD (total and components) are shown in Fig. 12, along with the results for 19 January.
For ease of comparison we also repeat in Fig. 8 the transmission-derived AODs from both AATS and SAGE. Comparing the AATS transmission-derived and convention-ally derived AODs shows them to be identical for λ>600 nm, and to differ by less than a few % for λ<600 nm. The rea-son for the differences in AATS AODs at short wavelengths is the assumed NO2column values, which are 2×1015cm−2
on all days for the AATS conventional analyses but set equal to the SAGE retrieved value above the DC-8 altitude for the transmission-oriented analyses. (The SAGE retrieved values, shown in Fig. 12 are 0.75, 1.32, 1.33, and 1.81, all
Table 1. Comparison of MODTRAN-calculated cross sections with those used in SAGE III standard analyses. WAVELENGTH [nm] O3CROSS SECTION [cm2/molec] RATIO
SAGE III MODTRAN SAGE III MODTRAN SAGE/MODTRAN
448.518 448.511 1.138E-22 1.170E-22 0.97 520.312 520.318 1.724E-21 1.774E-21 0.97 601.237 601.251 5.118E-21 5.175E-21 0.99 675.575 675.584 1.498E-21 1.448E-21 1.03 755.378 755.401 3.166E-22 2.876E-22 1.10 869.331 869.338 5.658E-23 5.172E-23 1.09
WAVELENGTH [nm] NO2CROSS SECTION [cm2/molec] RATIO
SAGE III MODTRAN SAGE III MODTRAN SAGE/MODTRAN
384.269 384.275 5.830E-19 5.957E-19 0.98
448.518 448.511 5.202E-19 6.705E-19 0.78
520.312 520.318 1.408E-19 1.905E-19 0.74
601.237 601.251 3.774E-20 4.071E-20 0.93
675.575 675.584 8.391E-21 8.414E-21 1.00
All cross sections calculated for 220 K
SAGE III: wavelength is mean value for pixel group; cross section is for coadded pixels within group MODTRAN: single wavelength and cross section closest to SAGE III pixel group center wavelength
×1015cm−2, on 19 , 24, 29, and 31 January 2003, respec-tively.)
Comparing the SAGE transmission-derived and conven-tionally derived AODs in Fig. 8 shows them to be quite sim-ilar, with fitted AOD curves differing by 10% or less. One source of the SAGE AOD differences is the different cross sections assumed for absorbing gases, discussed in conjunc-tion with Table 1.
The important point is that the AATS-SAGE AOD dif-ferences obtained from conventional analyses persist in the transmission-oriented analyses, being reduced only slightly if at all at most wavelengths for each case. That is, the transmission-oriented analysis does not explain the bulk of the AOD differences found in the conventional analysis. This result is consistent with the AATS-SAGE transmission com-parison shown in Fig. 9. That is, the AATS-SAGE differ-ences are evident in the transmissions, even before the analy-sis for AOD is conducted. Using Eq. (5) without the subscript i, yields the conversion between transmission differences and total LOSOT differences, namely
dLOSOT LOSOT = −1 LOSOT dT T . (8)
Since total LOSOT tends to decrease with increasing wave-length (because of the Rayleigh λ−4 dependence), increas-ing wavelength tends to amplify a given relative transmis-sion difference, dT/T, when converting to dLOSOT/LOSOT. These differences are discussed more fully in the following subsection.
3.5 Discussion of AATS-SAGE comparisons
Table 2 lists differences between AATS and SAGE results for the four AATS-SAGE comparison cases shown in Figs. 9 and 11–12 (i.e., the transmission-oriented comparisons). These comparisons have several features in common:
– SAGE and AATS LOS total transmissions T (both at
ap-parent SZA=90◦)agree to within 28% at all wavelengths
λ450–1545 m (Table 2a). Mean and root-mean-square (RMS) differences, (SAGE–AATS)/AATS, are ≤20% at each λ.
– Because of Eq. (8), the relatively weak wavelength
de-pendence of the AATS-SAGE relative transmission dif-ferences dT/T corresponds to a stronger wavelength dependence of the relative difference in total LOSOT,
dLOSOT/LOSOT. Specifically, SAGE and AATS total
LOSOT values (both at apparent SZA=90◦) agree to
within 10% of the AATS value for λ<∼755 nm but dif-fer by as much as 41% of the AATS value at 1020 nm and 62% at 1545 nm (Table 2c). For nearly all cases and
λ, AATS total LOSOT>SAGE total LOSOT. RMS dif-ferences, (SAGE–AATS)/AATS, are between 2% and 8% for λ<∼755 nm but increase to 39% at 1020 nm, and 58% at 1545 nm. Mean differences have similar magnitude but opposite sign.
– SAGE and AATS total vertical OD values have nearly
the same percentage differences as reported in the above bullet for total LOSOT (cf. Tables 1c and 1e). OD
Table 2. AATS-SAGE differences from transmission-oriented analyses.
(a) LOS total Transmission (full limb) (b) LOS Aerosol Transmission (full limb)
% difference, (SAGE–AATS)/AATS % difference, (SAGE–AATS)/AATS
Wavelength (nm)∗ Wavelength (nm)∗ Date, Date, 2003 448.5 520.3 601.2 675.6 755.4 869.3 1019.3 1545.2 2003 448.5 520.3 601.2 675.6 755.4 869.3 1019.3 1545.2 19 Jan. 2.0 6.8 −8.1 4.7 2.3 11.9 13.6 10.1 19 Jan. 12.0 12.7 17.0 9.2 8.6 10.4 13.6 10.2 24 Jan. 17.9 24.2 12.3 17.5 8.8 18.8 19.6 15.3 24 Jan. 30.1 24.9 25.4 17.3 15.0 16.5 19.6 15.4 29 Jan. 6.6 20.4 27.3 20.2 9.4 18.6 19.5 16.8 29 Jan. 16.0 13.7 17.2 13.8 13.7 16.2 19.5 16.9 31 Jan. 5.2 16.5 12.6 18.1 9.0 21.7 23.5 19.4 31 Jan. 17.2 12.6 12.6 14.8 15.4 19.4 23.4 19.5 mean 7.9 17.0 11.0 15.1 7.4 17.8 19.0 15.4 mean 18.8 15.9 18.1 13.8 13.2 15.6 19.0 15.5 rms∗∗ 9.9 18.2 16.7 16.3 7.9 18.1 19.4 15.8 rms∗∗ 20.0 16.8 18.6 14.1 13.5 16.0 19.3 15.9
(c) LOS total optical thickness (full limb) (d) LOS aerosol optical thickness (full limb)
% difference, (SAGE–AATS)/AATS % difference, (SAGE–AATS)/AATS
Wavelength (nm)∗ Wavelength (nm)∗ Date, Date, 2003 448.5 520.3 601.2 675.6 755.4 869.3 1019.3 1545.2 2003 448.5 520.3 601.2 675.6 755.4 869.3 1019.3 1545.2 19 Jan. −0.4 −2.0 2.5 −2.9 −2.7 −20.2 −33.2 −49.8 19 Jan. −16.0 −21.2 −34.7 −25.2 −26.2 −38.5 −53.3 −58.0 24 Jan. −3.2 −5.6 −2.7 −8.3 −8.4 −26.1 −39.0 −57.4 24 Jan. −32.3 −33.6 −41.2 −36.8 −36.0 −47.8 −59.9 −65.2 29 Jan. −1.4 −5.1 −5.8 −9.9 −9.5 −27.6 −41.1 −62.1 29 Jan. −19.0 −20.3 −30.5 −31.3 −34.6 −48.6 −61.7 −69.6 31 Jan. −0.9 −3.8 −3.0 −8.6 −8.2 −27.0 −40.9 −60.8 31 Jan. −18.0 −16.6 −20.3 −29.0 −33.4 −48.8 −62.2 −68.5 mean −1.5 −4.1 −2.3 −7.4 −7.2 −25.2 −38.5 −57.5 mean −21.3 −23.0 −31.7 −30.6 −32.5 −45.9 −59.3 −65.3 rms∗∗ 1.8 4.3 3.8 7.9 7.7 25.4 38.7 57.7 rms∗∗ 22.3 23.8 32.6 30.9 32.8 46.1 59.4 65.5
(e) Total vertical optical depth (f) Aerosol vertical optical depth
% difference, (SAGE–AATS)/AATS % difference, (SAGE–AATS)/AATS
Wavelength (nm)∗ Wavelength (nm)∗ Date, Date, 2003 448.5 520.3 601.2 675.6 755.4 869.3 1019.3 1545.2 2003 448.5 520.3 601.2 675.6 755.4 869.3 1019.3 1545.2 19 Jan. −0.4 −0.6 4.9 −1.0 −2.1 −20.5 −33.1 −49.9 19 Jan. −16.0 −21.2 −34.7 −25.2 −26.2 −38.5 −53.3 −58.0 24 Jan. −3.7 −4.6 −1.0 −6.8 −8.8 −27.6 −40.3 −58.1 24 Jan. −32.3 −33.6 −41.2 −36.8 −36.0 −47.8 −59.9 −65.2 29 Jan. −1.2 −4.8 −5.1 −8.9 −8.5 −26.9 −39.3 −61.3 29 Jan. −19.0 −20.3 −30.5 −31.3 −34.6 −48.6 −61.7 −69.6 31 Jan. −0.9 −3.5 −2.5 −7.6 −7.7 −26.9 −40.2 −60.5 31 Jan. −18.0 −16.6 −20.3 −29.0 −33.4 −48.8 −62.2 −68.5 mean −1.6 −3.4 −0.9 −6.1 −6.8 −25.5 −38.2 −57.5 mean −21.3 −23.0 −31.7 −30.6 −32.5 −45.9 −59.3 −65.3 rms∗∗ 2.0 3.8 3.8 6.8 7.3 25.6 38.3 57.6 rms∗∗ 22.3 23.8 32.6 30.9 32.8 46.1 59.4 65.5
(g) Total vertical optical depth (h) Aerosol vertical optical depth
Difference, (SAGE–AATS) Difference, (SAGE–AATS)
Wavelength (nm)∗ Wavelength (nm)∗ Date, Date, 2003 448.5 520.3 601.2 675.6 755.4 869.3 1019.3 1545.2 2003 448.5 520.3 601.2 675.6 755.4 869.3 1019.3 1545.2 19 Jan. −0.0002 −0.0003 0.0027 −0.0002 −0.0002 −0.0014 −0.0015 −0.0012 19 Jan. −0.0014 −0.0015 −0.0019 −0.0011 −0.0010 −0.0012 −0.0016 −0.0012 24 Jan. −0.0024 −0.0027 −0.0008 −0.0022 −0.0013 −0.0024 −0.0024 −0.0019 24 Jan. −0.0035 −0.0030 −0.0030 −0.0022 −0.0019 −0.0021 −0.0024 −0.0019 29 Jan. −0.0007 −0.0024 −0.0036 −0.0025 −0.0010 −0.0020 −0.0019 −0.0017 29 Jan. −0.0016 −0.0014 −0.0017 −0.0014 −0.0014 −0.0016 −0.0019 −0.0017 31 Jan. −0.0006 −0.0019 −0.0017 −0.0022 −0.0011 −0.0024 −0.0024 −0.0021 31 Jan. −0.0018 −0.0014 −0.0014 −0.0016 −0.0017 −0.0021 −0.0024 −0.0021 mean −0.0010 −0.0018 −0.0009 −0.0018 −0.0009 −0.0021 −0.0021 −0.0017 mean −0.0021 −0.0018 −0.0020 −0.0016 −0.0015 −0.0018 −0.0021 −0.0017 rms∗∗ 0.0013 0.0020 0.0024 0.0020 0.0010 0.0021 0.0021 0.0018 rms∗∗ 0.0022 0.0019 0.0021 0.0016 0.0015 0.0018 0.0021 0.0018
∗Wavelengths shown are SAGE III aerosol-archive wavelengths, except that 1019.3 nm (SAGE III transmission Pixel Group 81) is shown in place of 1021.6 nm to accomodate our SAGE III transmission-derived results at wavelength 1019.3 nm.
In calculating AATS-SAGE differences, AATS results were interpolated to SAGE wavelengths.
∗∗rms = v u u u u t X i=1,n xi2 , n
differences themselves (SAGE minus AATS, Table 2g) are between −0.0002 and −0.0036 for λ<∼755 nm and between −0.0002 and −0.0019 for λ>∼755 nm. RMS differences are between 0.0013 and 0.0024 for all wave-lengths. Mean differences have slightly smaller magni-tude and opposite sign.
– Differences between SAGE and AATS AOD (Table 2h)
are similar to differences in total OD. However, be-cause AOD is less than total OD, percentage differences
for AOD (Table 2f) exceed those for OD (Table 2e). RMS percentage differences in AOD ([SAGE minus AATS]/AATS) were ≤33% for λ<∼755 nm but in-creased to 59% for 1020 nm and 66% at 1545 nm (Table 2f).
Because AATS OD exceeds SAGE OD for virtually all cases and wavelengths, and because the AATS entrance win-dow developed frost on some DC-8 flights out of Kiruna prior to 19 January 2003, it is necessary to investigate whether the
larger AATS-retrieved ODs could be caused by window frost. However, as described more fully in Appendix A, we have performed four tests for the presence of window frost in each of the cases presented here, and all tests indicated no frost. The tests and the AATS-14 design also imply no deposit on any other optical element in the instrument optical path (an interference filter and detector for each channel). These re-sults lead us to conclude that the combined frost-prevention measures used in these cases – window heating and more ex-tensive purging with dry nitrogen than for the early flights – were successful. Additional evidence against AATS window frost or other deposits on AATS optical surfaces is provided by comparison of AATS results with those from the Direct-beam Irradiance Airborne Spectrometer (DIAS), reported in Sect. 4.
In a similar fashion, differences between SAGE III and AATS AOD could be attributed to SAGE III. From Fig. 9 and Table 2a, it is clear that the differences originate at the transmission level, so the clearing of molecular scatter and absorption by ozone, nitrogen dioxide, water vapor, and car-bon dioxide (at 1540 nm only) cannot be the primary sources of the discrepancy. The most likely scenario would be a sys-tematic error in altitude registration of the individual spec-tra. However, to produce the observed AOD differences, the 1020-nm channel would need to be consistently located low by about 2 km and the 1550-nm channel by over 5 km. This is extremely unlikely because altitude errors of this magnitude would cause catastrophic problems in other products like ozone and short wavelength aerosol that are not observed. Also, since altitude registration is linked between channels, it is not possible for the quality of the altitude registration to vary significantly from channel to channel. Comparisons of transmission between SAGE II and SAGE III at 1020 nm show a difference of about 10% and are consistent with the
∼20% difference in aerosol extinction at this wavelength re-ported by Thomason and Taha (2003). Aerosol extinction spectra computed from in situ measurements made by a Fo-cused Cavity Aerosol Spectrometer (FCAS) aboard the DC-8 tend to agree with SAGE III aerosol extinction spectra ex-cept at 1550 nm where the computed extinctions are signifi-cantly less than SAGE III values (see also Taha et al., 2004). Comparisons of aerosol extinction spectra computed from the University of Wyoming Optical Particle Counter (OPC) are consistently significantly less than SAGE III values.
We note that the flatter wavelength dependence of AATS-derived AOD as compared to SAGE III AOD implies larger particle sizes than would be derived from the SAGE III spec-tra. However, at DC-8 altitudes, there are several mecha-nisms that make larger particle sizes plausible. For example, Fahey et al. (2001) and Northway et al. (2002) report exten-sive measurements of large (5 to >20 µm diameter) nitric acid-containing particles over a large altitude range (16– 21 km) and horizontal extent (1800 km) in the Arctic strato-sphere during several weeks of the 1999–2000 winter. They note that such particles have sedimentation speeds capable
of falling out of the stratosphere (thereby denitrifying it), and that the particles are transported horizontally by winds as they sediment over periods of several days. McKinney et al. (2004) show that the observations are consistent with particle trajectory calculations that assume a composition of nitric acid trihydrate. Large ice particles associated with forming or dissipating cirrus are also not uncommon at DC-8 altitudes. And finally, as shown in Sect. 5, POAM III Version 4 data give AOD spectra with slopes very similar to those found by AATS. DC-8 in situ measurements might also be used to test for the presence of large particles at DC-8 alti-tudes. Indeed, the FCAS measurements mentioned above do not show the presence of such particles. However, these mea-surements do not describe all the AATS-viewed path, and one must also bear in mind the difficulty of preserving all opti-cally significant large particles when sampling through inlet and instrument systems at DC-8 speeds.
We note also that the AATS-SAGE comparisons in Figs. 8 and 11–12 approximate aerosol airmass ma as
wavelength-independent, setting ma(λ)=ma(755 nm). A more
com-plete (and cumbersome) treatment would use wavelength-dependent ma. As discussed in Sect. 2, using
wavelength-dependent ma would decrease AATS-retrieved AOD at
λ>755 nm and increase it at λ<755 nm. The size of the changes can be estimated from Fig. 5, which shows that, for DC-8 altitude 10.5 km, maximum differences at the shortest available SAGE wavelength, 449 nm, i.e., [ma(449 nm)−ma(755 nm)]/ma(755 nm) are 14% for true
SZAmeas=90◦, 8% for SZAmeas=89◦ and less for smaller
SZAmeas. Differences for the longest SAGE wavelength,
1550 nm, are similar (with opposite sign), because, as noted in Sect. 2 and shown in Fig. 5, ma(755 nm) is very close to
the mean of ma(449 nm) and ma(1550 nm). Thus the changes
in AATS AOD that would result from using wavelength-dependent maare too small to explain the longer-wavelength
AATS-SAGE AOD differences in Figs. 8 and 11–12 and in Table 2f, which are mostly >∼50% of AATS AOD at 1020 nm and >∼60% at 1545 nm.
4 DIAS-AATS Comparisons
The NCAR Direct-beam Irradiance Airborne Spectrometer (DIAS) flew on-board the DC-8 with AATS-14 and measured direct solar UV and visible irradiance from 290 to 630 nm. DIAS achieves a resolution of roughly 1 nm (comparable to SAGE III) by using a scanning double monochromator de-tection system, based on an instrument used by Shetter and M¨uller (1999). The DIAS optical collector viewed the Sun through a fused silica optical window mounted on the left side of the DC-8 cabin. Yee et al. (2004) and Swartz et al. (2005) have used the DIAS data (320–630 nm) to derive total LOSOT, as well as the individual ozone, aerosol, and
O2-O2 LOSOT. They do not attempt to infer vertical
inference of vertical columns requires additional assump-tions and leads to more uncertainty (cf. Sect. 2).
The middle frame of Fig. 10 includes an example DIAS re-sult, the aerosol LOSOT at λ=400 nm on 19 January at 10.48– 10.80 UT, shown in comparison to the AATS result for the partially overlapping period 10.32–10.62 UT. The DIAS and AATS values are 0.68 and 0.67, respectively (both doubled to convert from the DC-8-viewed half limb to a symmetrical full limb), thus agreeing to within 2%. For the fully over-lapping time period 10.48–10.62 UT the DIAS and AATS full-limb values are 0.68 and 0.71, respectively, agreeing to 4% (Table 3, 19 January, 10.48–10.62 UT).
Figure 13 shows DIAS LOS aerosol optical thickness (AOT) at SZAmeascompared to AATS LOS AOT at SZAmeas
for 19, 24, 29, and 31 January 2003. The AATS–DIAS differ-ences for these days and two others (21 January and 2 Febru-ary) are listed in Table 3. For all 6 days, AATS–DIAS dif-ferences in LOS AOT at 400 nm and SZAmeas were ≤12%. The mean difference was <3%, and RMS difference <8%. These differences are much less than the SAGE–AATS LOS AOT differences reported in Table 2d, which had mean and RMS values of −21% and 22%, respectively, at the shortest available wavelength, 449.9 nm.
The good agreement between DIAS and AATS reported above is especially significant since DIAS, located within the DC-8 cabin, viewed the sun through an optical window that was continuously viewed by on-board experimenters and showed no evidence of frost. Thus this good AATS–DIAS agreement provides additional evidence that the AATS win-dow was frost-free during the measurements reported here. (See also Appendix A.)
5 AATS–POAM comparisons
5.1 AATS–POAM comparison results
As shown in Fig. 1, the DC-8 flew near one POAM occulta-tion on 19 January 2003 and near three POAM occultaocculta-tions on 21 January. Figure 3 shows the POAM version 4 retrieved aerosol extinction profiles. For the 21 January POAM oc-cultations, the top frame in Fig. 14 shows the SZAs and al-titude of the DC-8, along with the distance from the DC-8 to the POAM tangent point and the AATS-retrieved AOD at two selected wavelengths. Time dependent airmasses, mR,
mO3, and ma, for Rayleigh, ozone, and aerosol, respectively
(obtained by applying the Yee airmass algorithm), are shown in the bottom frame. Aerosol airmass results mawere
com-puted using the POAM III aerosol extinction profile at wave-length 779 nm. Not shown for brevity are analogous results for the 19 January occultation, for which the DC-8 experi-enced SZA values within the range shown in Fig. 14.
Figure 15 compares the AATS and POAM AOD spectra obtained for the three periods on 19 January and the three periods on 21 January when the DC-8 was within 100 km
Table 3. DIAS-AATS differences in LOS aerosol OT (AOT) at wavelength 400 nm.
UT Start UT End % difference, (DIAS–AATS)/AATS 19 Jan. 9.83 10.13 12.0 19 Jan. 10.48 10.62 −4.0 21 Jan. 14.61 16.25 −0.4 24 Jan. 10.60 10.86 −0.2 24 Jan. 11.22 11.49 8.0 29 Jan. 10.27 10.43 −7.0 29 Jan. 10.87 11.13 −7.0 29 Jan. 11.48 11.64 −9.0 31 Jan. 9.63 9.81 −5.0 2 Feb. 12.46 12.80 −10.0 mean −2.3 rms∗∗ 7.7 ∗∗ rms = v u u t X i=1,n xi2 , n
of a POAM tangent point. (Note that the three such periods on 19 January were for a single POAM occultation, whereas each such period on 21 January was for a different POAM occultation.) The AATS and POAM results were obtained by conventional analyses, as defined in Sect. 3.1. That is, we obtained AATS AODs using the method described by the Appendix of Russell et al. (1993), and we obtained POAM
AODs by vertically integrating the POAM aerosol extinction
profiles in Fig. 3 above the DC-8 altitude.
Notice that we have excluded the shortest POAM wave-length, 353 nm, from the POAM AODs in Fig. 15, even though POAM retrieved AOD values at this wavelength are shown extending down to DC-8 altitudes in Fig. 3. The reason for excluding POAM AODs at 353 nm is analogous to that for excluding SAGE III AODs at the SAGE 384-nm wavelength, i.e., at DC-8 altitudes the transmission signal is so depleted that signal-to-noise is virtually zero. This de-pletion leads to the erroneous values for SAGE III aerosol extinction at 384 nm that are quite evident in Fig. 2 below
∼11 km. Corresponding errors in POAM III 353-nm ex-tinction are not readily evident in Fig. 3, but this is a re-sult of the fact that the POAM retrieval solves for the pa-rameters of an assumed extinction functional form (anal-ogous to Eq. (7)), rather than solving for aerosol extinc-tion at each wavelength independently. In solving for fit-ting parameters, the POAM III retrieval weights channels by the signal-to-noise ratio, and hence the 353-nm chan-nel has essentially zero weight below ∼12 km. There-fore, POAM III retrieved extinction values at 353 nm and such altitudes are determined by fitting coefficients deter-mined almost entirely by the signals in the longer-wavelength
10-1 100
O3 column AATS=254.76 DU
NO2 column =7.45e+014 cm
-2
date: 19 Jan 03 Altitude: 10.43 km Time: 10.32-10.62 UT
AATS, SZA meas DIAS, SZA meas O3 column AATS=411.70 DU NO2 column =1.32e+015 cm-2
date: 24 Jan 03 Altitude: 9.92 km Time: 10.60-10.89 UT
400 500 600 700 800 1000 1200 1600
10-1 100
Wavelength (nm)
LOS Optical Thickness (full limb)
O3 column AATS=372.46 DU
NO2 column =1.33e+015 cm-2
date: 29 Jan 03 Altitude: 10.30 km Time: 10.13-10.43 UT
400 500 600 700 800 1000 1200 1600
Wavelength (nm)
O3 column AATS=315.45 DU NO2 column =1.81e+015 cm-2
date: 31 Jan 03 Altitude: 9.07 km Time: 9.39-9.81 UT
-2
Fig. 13. DIAS LOS aerosol optical thickness (AOT) at SZAmeascompared to AATS LOS AOT at SZAmeasfor 19, 24, 29, and 31 January 2003.
channels. They are therefore essentially extrapolated from those longer-wavelength channels. (Note that AATS does not have such severe signal depletion at its short wavelengths because it views through only half the limb. Hence, when SAGE and POAM short-wavelength transmissions have de-creased to ∼10−4at ∼12 km, AATS (half-limb) transmission is ∼10−2or larger. See also Sect. 3.2.)
For completeness we show in Fig. 16 vertical profiles of transmission for the four POAM occultations of Figs. 14– 15. Also shown are the corresponding AATS transmission values at the AATS measurement SZA, SZAmeas, and
con-verted to apparent SZA=90◦. Figure 16 is analogous to the SAGE–AATS transmission plot in Fig. 9. As with the SAGE–AATS comparisons, we have used the POAM–AATS
transmission data to investigate the source of any POAM– AATS AOD differences shown in Fig. 15. In brief, the source of any such POAM–AATS AOD differences is the corre-sponding transmission differences, rather than differences in gas subtraction (e.g., Rayleigh, ozone, NO2), or factors
related to airmass. This finding is similar to the result of the analogous SAGE–AATS analyses, which also found that
AOD differences were directly traceable to transmission
dif-ferences.
5.2 Discussion of AATS–POAM comparisons
Table 4 lists differences between AATS and POAM results for the six AATS–POAM comparisons shown in Fig. 15. These comparisons have several features in common:
0 50 100 150 200 250 300 Distance from AA
TS-14 (DC-8) to POAM tangent point (km)
104 AOD(519 nm) 104 AOD(864 nm) 8 9 10 11 12 DC-8 Altitude (km) 84 86 88 90 SZA (deg) TRUE SZA APPARENT SZA POAM POAM POAM 13 14 15 16 17 18 0 10 20 30 40 50 UT (hrs) airmass
rayleigh SZAmeas ozone SZAmeas aerosol SZAmeas
rayleigh SZA= 90o ozone SZA= 90o aerosol SZA= 90o
Fig. 14. Conditions and results for the DC-8 flight of 21 January 2003. Top: DC-8 altitude, distance from POAM III 10-km tangent point, and true and apparent (refracted) SZA, with AOD retrieved from AATS-14 at two wavelengths. Vertical dotted lines marked by arrows and “POAM” show times of POAM III tangent at 10 km altitude. Bottom: Airmasses for Rayleigh, ozone, and aerosol (755 nm), at SZAmeas and apparent SZA=90◦, computed from the POAM III profiles in Fig. 3 using the Yee algorithm. Results shown used POAM III version 3 profiles, but results using version 4 differ by <6%.
– RMS percentage differences in AOD ([AATS– POAM]/AATS) were ≤31% for all λ>400 nm (Table 4a).
– AATS–POAM AOD differences were ≤0.0041 for all
λ>400 nm. RMS differences were ≤0.0026. Mean dif-ferences (AATS–POAM) were ≤0.0015 (Table 4b). It is noteworthy that, at 442 nm, the largest AATS–POAM differences occur for the 19 January POAM occultation. As shown in Fig. 3, for the 19 January occultation, POAM re-trieved extinction at both 353 and 442 nm goes negative at altitudes 11 to 9 km and appears anomalously small (relative to the longest wavelengths) at 12 km. Such behavior sug-gests a small altitude error in the POAM transmission pro-files, which causes too much Rayleigh subtraction, affecting the short wavelength channels most noticeably. Indeed, an
altitude error of 0.5 km or even smaller can be sufficient to cause the negative extinctions. Although POAM altitudes in general have better accuracy than this, a peak-to-peak random error of 0.5 km is entirely possible. Less Rayleigh subtraction would increase POAM-retrieved AOD for the 19 January occultation, reducing the AATS–POAM differences shown in Fig. 15 and Table 4.
6 Summary and conclusions
AATS-14 measurements on the DC-8 in SOLVE II provide
AOD spectra for wavelengths 354–2139 nm, covering the full
range of aerosol wavelengths for SAGE III (384–1545 nm) and POAM III (353–1018 nm), plus nearly all the wave-length range used in DIAS retrievals by Swartz et al. (2005, 320–630 nm). In this paper we show AATS results only for
10-3 10-2
date: 19Jan POAM Altitude: 11.2 km Time: 13.60 UT
POAM v4
AATS 12.67-12.76 UT AATS 13.10-12.22 UT AATS 13.44-13.53 UT
date: 21 Jan POAM Altitude: 9.9 km Time: 14.64 UT
POAM v4 AATS 13.22-13.66 UT 400 500 600 700 800 1000 1200 1600 10-3 10-2 Wavelength (nm)
Aerosol Optical Depth
date: 21 Jan POAM Altitude: 10.0 km Time: 16.33 UT
POAM v4
AATS 14.92-15.43 UT
400 500 600 700 800 1000 1200 1600
Wavelength (nm)
date: 21 Jan POAM Altitude: 11.2 km Time: 18.02 UT
POAM v4
AATS 17.53-17.61 UT
Fig. 15. Comparison of AATS-14 and POAM IIIv4 AOD spectra for the 19 and 21 January 2003 occultations shown in Figs. 3 and 14.
wavelengths 354–1558 nm, because no correlative measure-ments are available at 2139 nm. The AATS-14 results show
AOD spatial structure along the DC-8 flight path and provide AOD spectra for comparison to SAGE III and POAM III at
their tangent points, and to DIAS when it was able to view the Sun through its window on the left side of the DC-8.
In our analyses we have used a new airmass algorithm (Yee al., 2002; DeMajistre and Yee, 2002; Vervack et al., 2002), which we compared to the Thomason et al. (1983) algorithm used in our previous work. We found agreement between the two algorithms to within 2% for SZA<90◦, and in ad-dition made use of the new algorithm for conad-ditions with
SZA>=90◦, which were encountered for parts of most DC-8 flights reported here.
We have compared the two DC-8 mounted instruments, AATS-14 and DIAS, in terms of results for LOS AOT at wavelength 400 nm and found good agreement. Specifically, for all 6 days of AATS–DIAS comparisons, differences in LOS AOT at 400 nm were ≤12%. The mean difference was
<3%, and RMS difference <8%. The LOS AOT differences were anticorrelated with differences between LOS Rayleigh OT used in the AATS and DIAS processing algorithms, indi-cating that LOS AOT differences would become even smaller if the two algorithms used a common Rayleigh OT formula-tion.
AATS and DIAS viewed the sun through separate win-dows, with the AATS window built into its externally-mounted tracking head, and DIAS viewing through an
8 9 10 11 12 13 14 15 POAM λ: 442.2 nm AATS λ: 452.6 nm date: 19 Jan 03 POAM λ: 603.5 nm
AATS λ: 604.4 nm POAM AATS λλ:: 779.4 nm 778.4 nm POAM AATS λλ: 922.3 nm: 864.5 nm
POAM λ:1018.3 nm AATS λ: 1019.1 nm
POAM v4
AATS,90o
AATS, SZAmeas
9 10 11 12 Altitude [km] date: 21 Jan 03 14.64 UT 9 10 11 12 date: 21 Jan 03 16.33 UT 9 10 11 12 date: 121 Jan 03 18.02 UT 10-2 5x10⁻¹ Transmission 100 100 100 10-3 5x10⁻¹ 2x10⁻¹ 3x10⁻¹ 5x10⁻¹
Fig. 16. POAM IIIv4 vertical profiles of transmission at representative wavelengths for the occultation events near the DC-8 on 19 and 21 January, with corresponding AATS transmission values (converted from half-limb to full limb) at the AATS measurement SZA, SZAmeas, and converted to apparent SZA=90◦.