HAL Id: inserm-01153192
https://www.hal.inserm.fr/inserm-01153192
Submitted on 19 May 2015HAL is a multi-disciplinary open access archive for the deposit and dissemination of sci-entific research documents, whether they are pub-lished or not. The documents may come from teaching and research institutions in France or abroad, or from public or private research centers.
L’archive ouverte pluridisciplinaire HAL, est destinée au dépôt et à la diffusion de documents scientifiques de niveau recherche, publiés ou non, émanant des établissements d’enseignement et de recherche français ou étrangers, des laboratoires publics ou privés.
with successful aging.
Archana Singh-Manoux, Séverine Sabia, Kim Bouillon, Eric Brunner,
Francine Grodstein, Alexis Elbaz, Mika Kivimaki
To cite this version:
Archana Singh-Manoux, Séverine Sabia, Kim Bouillon, Eric Brunner, Francine Grodstein, et al.. Association of body mass index and waist circumference with successful aging.: adiposity & successful ageing. Obesity (Silver Spring, Md.), 2014, 22 (4), pp.1172-8. �10.1002/oby.20651�. �inserm-01153192�
Association of body mass index and waist circumference with successful ageing: 16 year
follow-up of the Whitehall II study
Archana Singh-Manoux1, 2, 3*, Séverine Sabia2, Kim Bouillon2, Eric J Brunner2, Francine
Grodstein4, Alexis Elbaz1,2, Mika Kivimaki2
* Corresponding author & address:
1
INSERM, U1018
Centre for Research in Epidemiology and Population Health
Hôpital Paul Brousse, Bât 15/16, 16 Avenue Paul Vaillant Couturier
94807 VILLEJUIF CEDEX, France
Telephone: +33 (0)1 77 74 74 10 Fax: +33 (0)1 77 74 74 03
Email: Archana.Singh-Manoux@inserm.fr
2
Department of Epidemiology and Public Health, University College London, UK
3
Centre de Gérontologie, Hôpital Ste Périne, AP-HP, France
4
Department of Epidemiology, Harvard School of Public Health,Boston, Massachusetts USA
Running title: adiposity & successful ageing
Word count: 197 (abstract) & 3324 (text)
What is already known?
• Obesity is a risk factor for mortality and chronic diseases, with emerging evidence of
its effect on multiple ageing outcomes.
• It is unclear if obesity in midlife is a risk factor for global measures such as ‘successful
ageing’, defined as being free of major chronic diseases and good physical, cognitive,
respiratory, cardiovascular functions and good mental health.
• It is unknown whether the risk is contained at thresholds used to define obesity
(BMI≥30Kg/m2 & and large waist circumference:≥102/88 cm in men/women).
What does this study add?
• Both obesity measures were more strongly associated with successful ageing than
with mortality.
• Lower odds of successful ageing starting at BMI ≥23.5 kg/m2 and waist circumference
Abstract
Objective: We examined whether midlife body mass index (BMI) and waist circumference
(WC) predict successful ageing.
Design and Methods: BMI/WC were assessed in 4869 persons (mean age 51.2, range 42-63
in 1991/93) and survival and successful ageing (alive, no chronic disease at age >60 years,
not in the worst age- and sex-standardized quintile of cognitive, physical, respiratory, and
cardiovascular, and mental health) ascertained over a 16-year follow-up, analysed using
logistic regression adjusted for socio-demographic factors and health behaviours.
Results: 507 participants died, 1008 met the criteria for successful ageing. Those with
BMI≥30 kg/m2 had lower odds of successful ageing (Odds Ratio (OR)=0.37; 95% Confidence
Interval (CI): 0.27, 0.50) and survival (OR=0.55; 95% CI: 0.41, 0.74) compared to BMI
between 18.5-25 kg/m2. Those with a large waist circumference (≥102/88 cm in
men/women) had lower odds of successful ageing (OR=0.41; 95% CI: 0.31, 0.54) and survival
(OR=0.57; 95% CI: 0.44, 0.73) compared to those with a small waist (<94/80 cm in
men/women). Analysis with finer categories showed lower odds of successful ageing starting
at BMI ≥23.5 kg/m2 and waist circumference 82/68 cm in men/women.
Conclusions: Optimal midlife BMI and waist circumference for successful ageing might be
Introduction
500 million adults, corresponding to more than a tenth of the total world adult population,
were obese in 2008.(1) There is considerable evidence of the adverse effects of obesity on
mortality,(2-4) with concerns growing that the obesity epidemic will reduce gains made in
cardiovascular disease prevention(5, 6) and life expectancy.(7) Besides mortality and chronic
diseases, obesity is linked to disability,(8-10) poor physical(11-16) and cognitive
functioning.(17-20) Given population ageing and the adverse effect of obesity on multiple
age-related health conditions,(21) research on the impact of obesity on ageing outcomes has
considerable public health significance.
The primary objective of this study is to examine the effect of obesity on health at
older ages. Mortality, chronic diseases, and functioning examined as separate outcomes do
not allow an evaluation of the extent to which obesity influences overall health at older
ages. The concept of ‘successful’(22) or ‘healthy’ ageing allows multiple dimensions of health
to be assessed together. In this paper we examine if midlife indicators of adiposity, body
mass index (BMI) and waist circumference (WC) predict ‘successful ageing’, defined as being
free of major chronic diseases and having good physical, cognitive, respiratory,
cardiovascular, and mental health. Besides successful ageing we also estimate associations
of adiposity markers with survival in the same cohort, irrespective of the health status of the
person, in order to allow better interpretation and comparison with the adiposity-successful
Methods
Data are drawn from the Whitehall II study, established in 1985 on 10,308 employees
(response rate 73%), aged 35-55 years (67% men), of 20 London based civil-service
departments.(23) All participants in the study were white-collar workers but a wide range of
occupations was represented with a salary difference of over 10-fold between the top and
bottom of the hierarchy. Study design consisted of a clinical examination approximately
every 5 years: 1985/88, 1991/93, 1997/99, 2002/04, and 2008/09. As waist circumference
was added to the anthropometry measures in 1991/93, it is the baseline in the present
analysis. All participants provided written consent and the University College London ethics
committee approved the study.
Baseline measurements (1991/93)
BMI (weight Kg/height metres2): Weight was measured in underwear to the nearest
0.1 kg on Soehnle electronic scales with digital readout (Leifheit AS, Nassau, Germany).
Height was measured in bare feet to the nearest 1 mm using a stadiometer with the
participant standing erect with head in the Frankfurt plane. Reproducibility of the weight
and height measurements over 1 month (i.e., between-subject variability/total (between +
within subject) variability), undertaken on 331 participants, was 0.99. WHO classification was
used to categorise BMI(24): 18.5-24.99 kg/m2 (normal weight), 25-29.99 kg/m2 (overweight),
and ≥30 kg/m2 (obese).
WC was measured in the standing position with the participant in underwear, using a
fiberglass tape measure at 600 g tension. It was taken as the smallest circumference at or
men/women), intermediate (94 to <102/80 to <88 cm in men/women), and large (≥102/88
cm in men/women).(21)
Covariates: Baseline covariates were age, sex, marital status (married vs. other) and
socioeconomic status (SES), using the measure of occupational position (high, intermediate,
low), a comprehensive marker of socioeconomic circumstances related to salary, social
status and level of responsibility at work.(23)
Analyses were also adjusted for health behaviours, assessed by questionnaire. Smoking
status was categorized as current, ex-, and never smokers. Alcohol consumption was
assessed via questions on the number of alcoholic drinks consumed in the last seven days,
converted to units of alcohol consumed in a week. Level of physical activity was defined as
“active” (≥2.5 hours/week of moderate physical activity or ≥1 hour/week of vigorous
physical activity), “inactive” (<1 hour/week of moderate and vigorous activity) and
intermediate level of activity for all others. Dietary behaviour was assessed using a question
on frequency of fruit and vegetable consumed in a week.
Outcome Ascertainment (follow-up 1991/93 to 2008/09)
Two key outcomes were ascertained at the end of a mean follow-up of 16.3 years
(SD=2.4 years): survival (being alive at the end of the follow-up) and successful ageing.
Multiple health outcomes, in order to reflect the multidimensionality of the successful
ageing concept, were used to define successful ageing. These included (1) being alive at the
end of the follow-up and aged ≥ 60, (2) absence of coronary heart disease, stroke, cancer
and diabetes over the follow-up, (3) good cardiovascular, metabolic, respiratory, physical
and cognitive functioning, and (4) absence of mental health problems at the clinical
Mortality: Mortality data were drawn from the British national mortality register
(National Health Services Central Registry). The tracing exercise was carried out using the
National Health Service identification number assigned to each British resident.
Chronic diseases: Coronary heart disease (CHD) was identified at baseline (1991/93), to
exclude prevalent disease, and over the follow-up using MONICA criteria.(25) Data for this
procedure came from the medical examinations carried out every 5 years, hospital records
of acute electrocardiograms (ECGs) and cardiac enzymes. Stroke diagnosis was self-reported
and included history of stroke or a transient ischemic attack. Cancer status was assessed
using the National Health Service cancer registry. At each medical examination, diabetes
mellitus was determined by self-report of doctor diagnosis and/or medication or oral glucose
tolerance test (a fasting glucose ≥ 7.0 mmol/l, a 2-h postload glucose ≥ 11.1 mmol/l,
reported doctor-diagnosed diabetes, or use of diabetes medication).(26)
Functional status: Functional measures were assessed at the 2008/09 clinical
examination using standard protocols. Good functional status was defined as not being in
the worst quintile of any of the domains assessed, with the worst quintile standardized using
age in 5-year bands and sex because of the association of these measures with functioning.
Systolic blood pressure (average of 2 measurements in sitting position after 5 minutes of rest
with the OMRON HEM 907), a marker of cardiovascular health in our analysis, is a major risk
factor for coronary heart disease and the most important risk factor for stroke (27) The
highest quintile of systolic blood pressure described poor cardiovascular health. Physical
function using walking speed measured over a clearly marked eight foot walking course at
usual pace,(28) respiratory function as forced expiratory volume in one second/height2
(FEV1 in L/m2),(29),34 and cognitive functioning using a global cognitive score composed of 5
the short form general health survey (SF-36),(31) part of the study questionnaire
administered at 2008/09.
Statistical Analysis
Survival and successful ageing were ascertained as described above. As there was no
evidence of sex differences in the associations (p for interaction with sex = 0.16 to 0.97
depending on the outcome), men and women were combined in the analysis. Logistic
regression was used to examine associations of baseline BMI (18.5-24.99 kg/m2, 25-29.99
kg/m2, and ≥30 kg/m2) and WC categories (men/women: <94/80 cm, 94 to <102/80 to <88
cm, and ≥102/88 cm) with survival and successful ageing.
In analysis where survival was the outcome, cases were participants who survived
(comprising both successful and unsuccessful ageing) and non-cases were those who died
during the follow-up. When successful ageing was the outcome, non-cases were those who
died and those alive but deemed not to have aged successfully. Analyses were adjusted for
age, sex, marital status, SES and health behaviours (smoking, alcohol consumption, physical
activity and dietary behaviour).We also examined associations of BMI and WC with
individual components used to define successful ageing.
We also examined finer categories of BMI and WC for their association with both
outcomes. Statistical tests were 2-sided and a P-value of less than 0.05 was considered
statistically significant. Sensitivity analysis: One, we first examined the influence of missing
data on the results by examining the association of BMI and WC with “missingness” at the
end of follow-up using logistic regression. As all participants are linked to the national
mortality registers we repeated the mortality analyses in all participants with data on BMI
in non-smokers. Finally, the main analysis was repeated using multinomial logistic regression
to analyse both outcomes (successful ageing, mortality) in a single analytic framework. All
analyses were performed with STATA statistical software, version 12.
Results
Figure 1 shows a flow chart of the sample selection. Of the 8104 participants at the
1991/93 clinical screening where BMI and WC were assessed, we excluded those who were
alive but not yet aged 60 (n=1423) at the end of the follow-up (2008/09) as they were too
young to be considered to have aged successfully, those with prevalent cardiovascular
disease or cancer at baseline (n=249), those with missing data on BMI or WC (n=124) or BMI
below 18.5 (n=50), and those lost to follow-up (N=1431) between the assessment of
adiposity (1991/93) and functioning (2008/09). Of the 8104 participants at 1991/93
assessment, mortality along with socio-demographic data were available for 7902
participants. Supplementary Table S1 shows that the associations of BMI and waist
circumference with mortality were similar in the two samples.
Compared to those with missing data the sample included in the analysis (N=4869) was
composed of fewer women (33.2% vs. 29.4% women p<0.001) and more individuals from
the higher SES group (32.7% vs. 41.3%, p<0.001); both BMI and WC were only slightly higher
in the sample included in the analysis (age and sex adjusted differences of 0.4 kg/m2 and 0.7
cm, respectively). Compared to normal weight participants, missingness was no different in
overweight (OR=0.93, 95% CI: 0.83, 1.03) and obese (OR=0.84, 95% CI: 0.71, 1.00) persons in
analysis adjusted for age and sex (N=7902). Those with a small waist had similar odds ratio of
95% CI: 0.77, 1.05) WC categories. The measures of BMI and WC were strongly correlated
(correlation coefficient = 0.74, p<0.001).
Quintiles used to ascertain poor functional status accumulated over the measures so
that only 33.8% of participants in the study had good functioning on all measures; 59.4%
were free of chronic diseases and combining these two led to 1008 (20.7% of those included
in the analysis) successful agers, see Table 1 for sample characteristics. At baseline those
ageing successfully had a better socio-demographic and behavioural profile. 507 (10.4%)
participants died over the follow-up; 107 were aged less than 60 at the time of death (mean
age=55.9, SD=3.2, range=46.2-59.9) and 400 over 60 years (mean age=68.0, SD=4.8,
range=60.0-79.0). Participants who died over the follow-up had higher BMI and WC at
baseline and were less likely to be married or from the high SES group (p<0.001).
The mean (SD) follow-up in those who died was 11.3 (4.7) years and 16.8 (SD=0.6)
years in the survivors. Successful ageing and mortality in the BMI groups were as follows:
25.3% and 9% in normal weight persons, 17.8% and 10.7% in the overweight and 9.8% and
16.1% in the obese. In the waist circumference categories these numbers were 24.2% and
9.1% in those in the small, 16.1% and 10.3% in the intermediate and 10.1% and 17.1% in the
large category. Table 2 presents the association of BMI and WC with successful ageing and
survival in analyses adjusted for socio-demographic measures (model 1) and health
behaviours (model 2). Successful ageing had a dose-response relation with both measures of
adiposity but the associations with survival were statistically significant only for those with a
BMI ≥30kg/m2 and those in the largest WC category. Sensitivity analysis showed similar
associations in analysis excluding current smokers at baseline (supplementary Table S2) and
that using multinomial logistic regression (supplementary Table S3) yielded results similar to
and 65% of those with large WC), the associations with successful ageing (OR=0.35, 95% CI:
0.24, 0.49) and survival (OR=0.51, 95% CI: 0.37, 0.69) were similar in fully adjusted analyses.
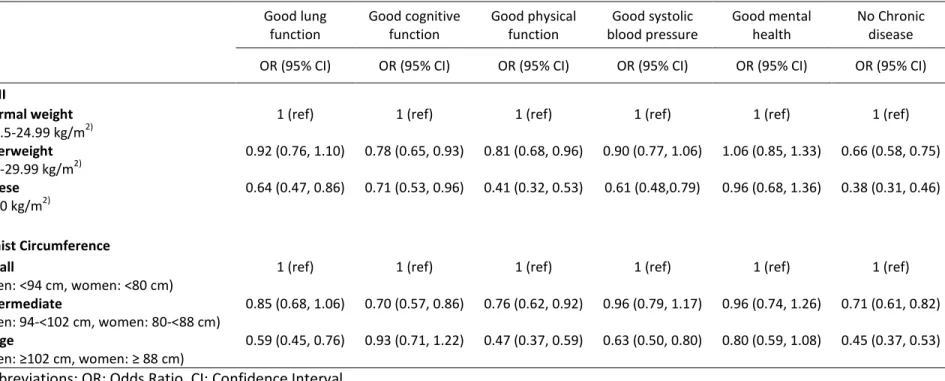
Table 3 shows results of the association of BMI and WC with the components used to
define successful ageing. Individuals classified as obese were less likely to have good
functioning on all components except mental health (OR=0.96, 95% CI: 0.68, 1.36), they also
had lower odds of being free of chronic diseases (OR=0.38, 95% CI: 0.31, 0.46). Both BMI and
WC had the strongest association with chronic diseases. However, functioning components
did contribute to the associations as when with successful ageing was defined without taking
into consideration chronic diseases, the overweight (OR=0.85, 95% CI: 0.73, 0.98) and the
obese (OR=0.56, 95% CI: 0.43, 0.72) had lower odds ratio of successful ageing in fully
adjusted analyses. Similarly, odds ratio of successful ageing were lower in those with an
intermediate (OR=0.81, 95% CI: 0.68, 0.96) and large (OR=0.58, 95% CI: 0.46, 0.72) compared
to small WC.
Figure 2 shows results of analysis using finer categories of BMI (Panel A) and WC (Panel
B) with successful ageing and survival as the outcomes. In these data, higher BMI was
significantly associated with lower survival only when ≥ 30 kg/m2 (OR=0.53; 95% CI: 0.36,
0.77). However, the odds ratio of successful ageing was significantly lower in those with BMI
starting at 23.5-25 kg/m2 (OR=0.69, 95% CI: 0.55, 0.88). The results for WC are similar (Figure
2B); here again poorer survival was observed in the highest WC category, ≥102/88 cm in
men/women, but the odds ratio of successful ageing were lower (OR=0.78, 95% CI: 0.63,
0.97) starting at 82-87/68-73 cm in men/women.
In this 16-year follow-up of nearly 5000 British men and women we found both high
BMI and WC in midlife to be associated with substantially reduced likelihood of successful
ageing. The obese (BMI ≥30 kg/m2) had 63% and those with a large WC (men: ≥102 cm,
women: ≥88 cm) 59% lower odds of successful ageing than those of normal weight and small
WC, respectively. Associations of adiposity markers with survival were consistently weaker
than those with successful ageing, obesity reduced the odds ratio of survival by 45% and
large WC by 43%. Exploratory analysis of narrower categories of BMI and WC suggested that
successful ageing was less likely in those with BMI>23.5 kg/m2 and waist circumference
greater than 82/68 cm in men/women; much below the threshold for low risk of disease and
mortality, i.e. 25kg/m2 for BMI and 94/80 cm WC in men/women.
The doubling of the human lifespan this last century(32) has led to a rapid increase in
the research on ageing. Rowe & Kahn’s seminal paper in 1987 highlighted the heterogeneity
in the health of older persons and the importance of understanding “successful ageing”.(22)
A recent review by Depp and colleagues (33) concluded that despite subsequent attempts to
define successful ageing there is little consensus on the appropriate terminology, the
components of such a concept, and whether it needs to be defined using objective or
subjective criteria. Physical functioning, usually measured as the absence of reported
disability is central to many definitions of successful ageing, used in 26 out of 29 definitions
reviewed by Depp et al. while 13 definitions included measures of cognitive function.(33)
Life satisfaction/well-being and social engagement measures were used in a third of the
studies. Many of the outcome measures in these studies were self-reported and the analysis
did not take into account mortality and chronic diseases. In contrast, our outcome measure
was assessed using objective data on physical and cognitive functioning, in addition to
A third of the individuals (35.8%, SD= 19.8%) included in the 29 studies in the review by
Depp et al. qualified as successful agers.(33) Nearly 21% in our study sample qualified as
successful agers, this number would have been larger had we used a less restrictive
definition. Our definition of successful ageing requires good health in a greater number of
components than any previous publication; however, utilizing fewer components would
have increased heterogeneity in the group of successful agers, and potentially a less
comprehensive assessment of the impact of obesity on ageing outcomes.
Our study shows that midlife obesity shapes a range of ageing outcomes, from
morbidity and mortality to chances of successful ageing. We used a prospective design to
assess the impact of body weight as age is known to modify the association between obesity
and death due to survivor effect and competing causes of death at older ages.(34, 35) There
is increasing evidence of the importance of midlife bodyweight for adverse health outcomes
at older ages. Associations in cross-sectional studies on older adults could be because body
weight is a risk factor or because it is a correlate or consequence of the health outcome
under investigation. Our use of a prospective design with a long follow-up ensures that the
observed results are not due to reverse causation bias. Two recent reviews highlight the
importance of midlife BMI for dementia (36) and limitations in activities of daily living.(37)
Our use of “successful ageing” as the outcome suggests that bodyweight influences multiple
dimensions of health, the risk of chronic disease but also lung, cognitive, physical functioning
and chronic diseases.
A BMI threshold of 25 kg/m2 has been used extensively to define normal weight but
there is already some evidence that individuals with lower values have better cardiovascular
outcomes.(5) In the Nurses’ Health Study midlife BMI greater than 23 kg/m2 was associated
ageing to start at BMI≥23.5 kg/m2 in midlife, suggesting that carrying excess weight might
accelerate the rate of ageing in those well below the obesity threshold. Similarly, for waist
circumference successful ageing was less likely starting much below the threshold used to
define risk (≥102/88 cm in men/women).(21)
The main strengths of this study include the conceptualization of successful ageing
based on multiple outcomes, including validated measures of chronic disease and objective
measures of functioning. The estimates for successful ageing where examined against those
for survival showing that both BMI and WC have a stronger effect on survival in good health
(successful ageing) rather than survival alone. The large sample size and the long follow-up
are further advantages. Finally, we were able to use linkage of all participants to national
mortality register to show that associations of obesity measures with mortality were similar
in those included and not included in the analysis. Thus, despite the loss to follow-up over
the course of the study it is unlikely that our results are influenced by missing data.
There are also several limitations to the results reported here. One, despite the long
follow-up, our study does not cover the oldest age-groups. The extent to which the results
apply to the 80+ age-groups remains to be explored. Two, our effect estimates might lack
precision as there is emerging evidence of the effect of duration of obesity, every 2
obese-years increases mortality risk by 6%.(39) Three, the use of population specific cut-offs to
define poor functional status is not ideal. Further research is required to define cut-offs for
measures of functioning so that they are consistent across studies. Four, a large number of
participants with data at baseline were not included in the analysis either by design (less
than 60 years old at the end of follow-up) or due to missing data on the functioning
associated with missing data. Finally, these findings from an occupational cohort may not be
fully generalizable to the general population.
In conclusion, our study highlights the importance of midlife adiposity for health at
older ages. Although overweight and obesity may become less disabling due to improvement
in the treatment of chronic diseases associated with obesity, our data suggest this might not
be the case for overall health and functioning at older ages. These results highlight the
importance of low BMI and waist circumference, below the current thresholds used to
define general and central obesity associated with risk of mortality and chronic diseases, for
Acknowledgements
We thank all of the participating civil service departments and their welfare, personnel, and
establishment officers; the British Occupational Health and Safety Agency; the British Council
of Civil Service Unions; all participating civil servants in the Whitehall II study; and all
members of the Whitehall II study team. The Whitehall II Study team comprises research
scientists, statisticians, study coordinators, nurses, data managers, administrative assistants
and data entry staff, who make the study possible.
Funding
This research is supported by the US National Institutes of Health (R01AG013196 to ASM;
R01AG034454 to ASM & MK, R01HL036310 to MK), the UK Medical Research Council
(K013351 to MK), the Economic and Social Research Council (to Mk) and the British Heart
Foundation (to EB).
Author contribution
ASM had full access to the data, and takes responsibility for the integrity of the data and
accuracy of the data analyses. All authors contributed to the concept and design of study,
drafting and critical revision of the manuscript.
Reference List
1. World Health Organization. Obesity and overweight. Fact sheet N°311. 2011. World Health Organisation.
Ref Type: Online Source
2. Must A, Spadano J, Coakley EH, Field AE, Colditz G, Dietz WH. The disease burden associated with overweight and obesity. JAMA. 1999;282(16):1523-9.
3. Whitlock G, Lewington S, Sherliker P et al. Body-mass index and cause-specific mortality in 900 000 adults: collaborative analyses of 57 prospective studies. Lancet.
2009;373(9669):1083-96.
4. Peeters A, Barendregt JJ, Willekens F, Mackenbach JP, Al MA, Bonneux L. Obesity in
adulthood and its consequences for life expectancy: a life-table analysis. Ann Intern Med. 2003;138(1):24-32.
5. Lloyd-Jones DM, Hong Y, Labarthe D et al. Defining and setting national goals for cardiovascular health promotion and disease reduction: the American Heart Association's strategic Impact Goal through 2020 and beyond. Circulation. 2010;121(4):586-613.
6. Hardoon SL, Morris RW, Whincup PH et al. Rising adiposity curbing decline in the incidence of myocardial infarction: 20-year follow-up of British men and women in the Whitehall II cohort. Eur Heart J. 2011.
7. Stewart ST, Cutler DM, Rosen AB. Forecasting the effects of obesity and smoking on U.S. life expectancy. N Engl J Med. 2009;361(23):2252-60.
8. Ferraro KF, Su YP, Gretebeck RJ, Black DR, Badylak SF. Body mass index and disability in adulthood: a 20-year panel study. Am J Public Health. 2002;92(5):834-40.
9. Jenkins KR. Obesity's effects on the onset of functional impairment among older adults. Gerontologist. 2004;44(2):206-16.
10. Alley DE, Chang VW. The changing relationship of obesity and disability, 1988-2004. JAMA. 2007;298(17):2020-7.
11. Fine JT, Colditz GA, Coakley EH et al. A prospective study of weight change and health-related quality of life in women. JAMA. 1999;282(22):2136-42.
12. Katz DA, McHorney CA, Atkinson RL. Impact of obesity on health-related quality of life in patients with chronic illness. J Gen Intern Med. 2000;15(11):789-96.
13. Sternfeld B, Ngo L, Satariano WA, Tager IB. Associations of body composition with physical performance and self-reported functional limitation in elderly men and women. Am J Epidemiol. 2002;156(2):110-21.
14. Vincent HK, Vincent KR, Lamb KM. Obesity and mobility disability in the older adult. Obes Rev. 2010;11(8):568-79.
15. Stenholm S, Sainio P, Rantanen T et al. High body mass index and physical impairments as predictors of walking limitation 22 years later in adult Finns. J Gerontol A Biol Sci Med Sci. 2007;62(8):859-65.
16. Houston DK, Ding J, Nicklas BJ et al. Overweight and obesity over the adult life course and incident mobility limitation in older adults: the health, aging and body composition study. Am J Epidemiol. 2009;169(8):927-36.
17. Elias MF, Elias PK, Sullivan LM, Wolf PA, D'Agostino RB. Obesity, diabetes and cognitive deficit: The Framingham Heart Study. Neurobiol Aging. 2005;26 Suppl 1:11-6.
18. Gustafson D. Adiposity indices and dementia. Lancet Neurol. 2006;5(8):713-20.
19. Whitmer RA, Gunderson EP, Barrett-Connor E, Quesenberry CP, Jr., Yaffe K. Obesity in middle age and future risk of dementia: a 27 year longitudinal population based study. BMJ. 2005;330(7504):1360.
20. Sabia S, Kivimaki M, Shipley M, Marmot M, Singh-Manoux A. Body mass index over the adult lifecourse and cognition in late midlife: the Whitehall II cohort study . Am J Clin Nutr. 2009;89(2):601-7.
21. Kopelman PG. Obesity as a medical problem. Nature. 2000;404(6778):635-43.
22. Rowe JW, Kahn RL. Human aging: usual and successful. Science. 1987;237(4811):143-9.
23. Marmot M, Brunner E. Cohort Profile: the Whitehall II study. Int J Epidemiol. 2005;34(2):251-6.
24. WHO. Obesity: Preventing and Managing the Global Epidemic. Report of a WHO consultation. World Health Organ Tech Rep Ser. 2000;894:1-253.
25. Tunstall-Pedoe H, Kuulasmaa K, Amouyel P, Arveiler D, Rajakangas AM, Pajak A. Myocardial infarction and coronary deaths in the World Health Organization MONICA Project. Registration procedures, event rates, and case-fatality rates in 38 populations from 21 countries in four continents. Circulation. 1994;90(1):583-612.
26. Alberti KG, Zimmet PZ. Definition, diagnosis and classification of diabetes mellitus and its complications. Part 1: diagnosis and classification of diabetes mellitus provisional report of a WHO consultation. Diabet Med. 1998;15(7):539-53.
27. WHO. The Atlas of Heart Disease and Stroke. 2004. Ref Type: Report
28. Guralnik JM, Simonsick EM, Ferrucci L et al. A short physical performance battery assessing lower extremity function: association with self-reported disability and prediction of mortality and nursing home admission. J Gerontol. 1994;49(2):M85-M94.
29. Miller MR, Hankinson J, Brusasco V et al. Standardisation of spirometry. Eur Respir J. 2005;26(2):319-38.
30. Singh-Manoux A, Marmot MG, Glymour M, Sabia S, Kivimaki M, Dugravot A. Does cognitive reserve shape cognitive decline? Ann Neurol. 2011;70(2):296-304.
31. Ware JE, Snow KK, Kosinski M. SF-36 health Survey: manual and interpretation guide. Boston MA: The Health Institute, New England Medical Centre. 1993.
32. Oeppen J, Vaupel JW. Demography. Broken limits to life expectancy. Science. 2002;296(5570):1029-31.
33. Depp CA, Jeste DV. Definitions and predictors of successful aging: a comprehensive review of larger quantitative studies. Am J Geriatr Psychiatry. 2006;14(1):6-20.
34. Zamboni M, Mazzali G, Zoico E et al. Health consequences of obesity in the elderly: a review of four unresolved questions. Int J Obes (Lond). 2005;29(9):1011-29.
35. Stevens J, Cai J, Pamuk ER, Williamson DF, Thun MJ, Wood JL. The effect of age on the association between body-mass index and mortality. N Engl J Med. 1998;338(1):1-7.
36. Anstey KJ, Cherbuin N, Budge M, Young J. Body mass index in midlife and late-life as a risk factor for dementia: a meta-analysis of prospective studies. Obes Rev.
2011;12(5):e426-e437.
37. Backholer K, Wong E, Freak-Poli R, Walls HL, Peeters A. Increasing body weight and risk of limitations in activities of daily living: a systematic review and meta-analysis. Obes Rev. 2012;13(5):456-68.
38. Sun Q, Townsend MK, Okereke OI, Franco OH, Hu FB, Grodstein F. Adiposity and weight change in mid-life in relation to healthy survival after age 70 in women: prospective cohort study. BMJ. 2009;339:b3796.
39. Abdullah A, Wolfe R, Stoelwinder JU et al. The number of years lived with obesity and the risk of all-cause and cause-specific mortality. Int J Epidemiol. 2011;40(4):985-96.
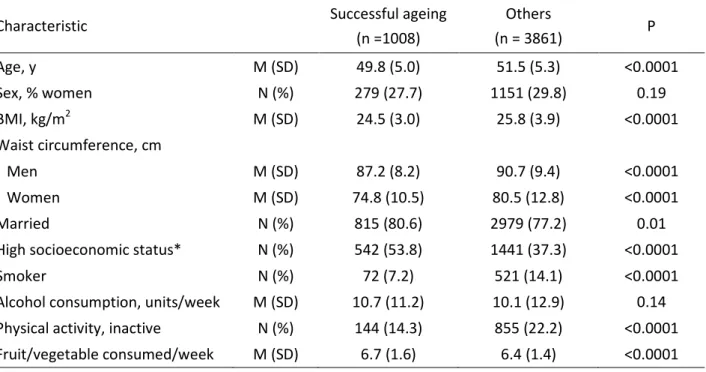
Table 1. Sample characteristics at baseline (1991/93) a function of ageing outcomes at the end of follow-up (2008/09).
Characteristic Successful ageing
(n =1008) Others (n = 3861) P Age, y M (SD) 49.8 (5.0) 51.5 (5.3) <0.0001 Sex, % women N (%) 279 (27.7) 1151 (29.8) 0.19 BMI, kg/m2 M (SD) 24.5 (3.0) 25.8 (3.9) <0.0001 Waist circumference, cm Men M (SD) 87.2 (8.2) 90.7 (9.4) <0.0001 Women M (SD) 74.8 (10.5) 80.5 (12.8) <0.0001 Married N (%) 815 (80.6) 2979 (77.2) 0.01
High socioeconomic status* N (%) 542 (53.8) 1441 (37.3) <0.0001
Smoker N (%) 72 (7.2) 521 (14.1) <0.0001
Alcohol consumption, units/week M (SD) 10.7 (11.2) 10.1 (12.9) 0.14 Physical activity, inactive N (%) 144 (14.3) 855 (22.2) <0.0001 Fruit/vegetable consumed/week M (SD) 6.7 (1.6) 6.4 (1.4) <0.0001 Abbreviations: M: Mean, SD: Standard Deviation, N: Number
Table 2. Association of BMI and waist circumference in 1991/93 with ageing outcomes in 2008/09.
Model 1 Model 2
N OR (95% CI) OR (95% CI)
BMI
Successful ageing successful ageing/N
Normal weight (18.5-24.99 kg/m2) 613/2420 1 (ref) 1 (ref)
Overweight (25-29.99 kg/m2) 345/1940 0.69 (0.59, 0.80) 0.71 (0.61, 0.82)
Obese (≥30 kg/m2) 50/509 0.35 (0.26, 0.48) 0.37 (0.27, 0.50)
Survival survival/N
Normal weight (18.5-24.99 kg/m2) 2203/2420 1 (ref) 1 (ref)
Overweight (25-29.99 kg/m2) 1732/1940 0.87 (0.71, 1.06) 0.90 (0.73, 1.11)
Obese (≥30 kg/m2) 427/509 0.53 (0.40, 0.71) 0.55 (0.41, 0.74)
Waist circumference
Successful ageing successful ageing/N
Small (men: <94 cm, women: <80 cm) 788/3255 1 (ref) 1 (ref)
Intermediate (men: 94-<102 cm, women: 80-<88 cm) 154/958 0.65 (0.53, 0.79) 0.66 (0.55, 0.81)
Large (men: ≥102 cm, women: ≥ 88 cm) 66/656 0.38 (0.29, 0.51) 0.41 (0.31, 0.54)
Survival survival/N
Small (men: <94 cm, women: <80 cm) 2959/3255 1 (ref) 1 (ref)
Intermediate (men: 94-<102 cm, women: 80-<88 cm) 859/958 0.92 (0.72, 1.18) 0.96 (0.75, 1.23)
Large (men: ≥102 cm, women: ≥ 88 cm) 544/656 0.52 (0.41, 0.67) 0.57 (0.44, 0.73)
Abbreviations: OR: Odds Ratio, CI: Confidence Interval.
Model 1: Analyses adjusted for age, sex, SES, and marital status.
Table 3. Association of BMI and waist circumference (1991/93) with components of successful ageing (2008/09).* Good lung function Good cognitive function Good physical function Good systolic blood pressure Good mental health No Chronic disease
OR (95% CI) OR (95% CI) OR (95% CI) OR (95% CI) OR (95% CI) OR (95% CI)
BMI
Normal weight (18.5-24.99 kg/m2)
1 (ref) 1 (ref) 1 (ref) 1 (ref) 1 (ref) 1 (ref)
Overweight (25-29.99 kg/m2) 0.92 (0.76, 1.10) 0.78 (0.65, 0.93) 0.81 (0.68, 0.96) 0.90 (0.77, 1.06) 1.06 (0.85, 1.33) 0.66 (0.58, 0.75) Obese (≥30 kg/m2) 0.64 (0.47, 0.86) 0.71 (0.53, 0.96) 0.41 (0.32, 0.53) 0.61 (0.48,0.79) 0.96 (0.68, 1.36) 0.38 (0.31, 0.46) Waist Circumference Small (men: <94 cm, women: <80 cm)
1 (ref) 1 (ref) 1 (ref) 1 (ref) 1 (ref) 1 (ref)
Intermediate (men: 94-<102 cm, women: 80-<88 cm) 0.85 (0.68, 1.06) 0.70 (0.57, 0.86) 0.76 (0.62, 0.92) 0.96 (0.79, 1.17) 0.96 (0.74, 1.26) 0.71 (0.61, 0.82) Large (men: ≥102 cm, women: ≥ 88 cm) 0.59 (0.45, 0.76) 0.93 (0.71, 1.22) 0.47 (0.37, 0.59) 0.63 (0.50, 0.80) 0.80 (0.59, 1.08) 0.45 (0.37, 0.53)
Abbreviations: OR: Odds Ratio, CI: Confidence Interval.
Analysis adjusted for age, sex, marital status, SES, smoking, alcohol consumption, physical activity and dietary behaviour.
*Good lung, cognitive, and physical function defined as scores not in the lowest age- and sex-standardized quintile of FEV1/height2, global cognitive score, and walking speed, respectively. Good systolic blood pressure defined as not being in the highest age- and sex-standardized quintile of systolic blood pressure. Good mental health defined as the SF36 mental component score < 42. Chronic diseases assessed were cancer, CHD, stroke, and/or diabetes. Ns vary from 3346 to 4922 depending on the outcome.

![[PDF] Cours Langage C plus en pdf | Cours informatique](data:image/gif;base64,R0lGODlhAQABAIAAAP///wAAACH5BAEAAAAALAAAAAABAAEAAAICRAEAOw==)