HAL Id: hal-02527835
https://hal.inria.fr/hal-02527835v2
Submitted on 16 Nov 2020
HAL is a multi-disciplinary open access
archive for the deposit and dissemination of
sci-entific research documents, whether they are
pub-lished or not. The documents may come from
teaching and research institutions in France or
abroad, or from public or private research centers.
L’archive ouverte pluridisciplinaire HAL, est
destinée au dépôt et à la diffusion de documents
scientifiques de niveau recherche, publiés ou non,
émanant des établissements d’enseignement et de
recherche français ou étrangers, des laboratoires
publics ou privés.
Determining the Intrinsic Structure of Public Software
Development History
Antoine Pietri, Guillaume Rousseau, Stefano Zacchiroli
To cite this version:
Antoine Pietri, Guillaume Rousseau, Stefano Zacchiroli. Determining the Intrinsic Structure of
Pub-lic Software Development History. MSR 2020 - 17th International Conference on Mining Software
Repositories, Oct 2020, Seoul, South Korea. �10.1145/3379597.3387506�. �hal-02527835v2�
Determining the Intrinsic Structure of
Public Software Development History
Antoine Pietri
antoine.pietri@inria.fr Inria Paris, FranceGuillaume Rousseau
guillaume.rousseau@univ-paris-diderot.frUniversité de Paris and Inria Paris, France
Stefano Zacchiroli
zack@irif.frUniversité de Paris and Inria Paris, France
ABSTRACT
Background. Collaborative software development has produced a wealth of version control system (VCS) data that can now be analyzed in full. Little is known about the intrinsic structure of the entire corpus of publicly available VCS as an interconnected graph. Understanding its structure is needed to determine the best approach to analyze it in full and to avoid methodological pitfalls when doing so.
Objective. We intend to determine the most salient network topol-ogy properties of public software development history as captured by VCS. We will explore: degree distributions, determining whether they are scale-free or not; distribution of connect component sizes; distribution of shortest path lengths.
Method. We will use Software Heritage—which is the largest cor-pus of public VCS data—compress it using webgraph compression techniques, and analyze it in-memory using classic graph algo-rithms. Analyses will be performed both on the full graph and on relevant subgraphs.
Limitations. The study is exploratory in nature; as such no hy-potheses on the findings is stated at this time. Chosen graph algo-rithms are expected to scale to the corpus size, but it will need to be confirmed experimentally. External validity will depend on how representative Software Heritage is of the software commons.
KEYWORDS
source code, version control system, network topology, graph struc-ture, statistical mechanics
ACM Reference Format:
Antoine Pietri, Guillaume Rousseau, and Stefano Zacchiroli. 2020. Deter-mining the Intrinsic Structure of Public Software Development History. In 17th International Conference on Mining Software Repositories (MSR ’20), Oc-tober 5–6, 2020, Seoul, Republic of Korea.ACM, New York, NY, USA, 4 pages. https://doi.org/10.1145/3379597.3387506
1
INTRODUCTION
The rise in popularity of Free/Open Source Software (FOSS) and collaborative development platforms [10] over the past decades has made publicly available a wealth of software source code artifacts
Publication rights licensed to ACM. ACM acknowledges that this contribution was authored or co-authored by an employee, contractor or affiliate of a national govern-ment. As such, the Government retains a nonexclusive, royalty-free right to publish or reproduce this article, or to allow others to do so, for Government purposes only. MSR ’20, October 5–6, 2020, Seoul, Republic of Korea
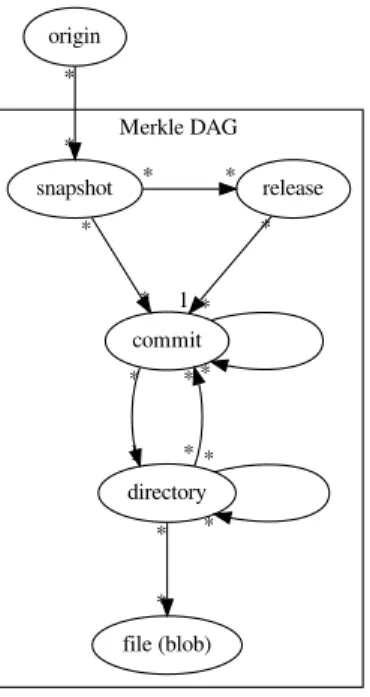
© 2020 Copyright held by the owner/author(s). Publication rights licensed to ACM. ACM ISBN 978-1-4503-7517-7/20/05...$15.00 https://doi.org/10.1145/3379597.3387506 Merkle DAG origin snapshot * * release * * commit * * 1 * * * directory 1 * * * * * file (blob) * *
Figure 1: Data model: a Merkle DAG linking together source code artifacts commonly found in version control systems.
(source code files, commits with all associated metadata, tagged released, etc.), which have in turn benefited empirical software engineering (ESE) and mining software repository (MSR) research. Version control systems (VCS) in particular have been frequently analyzed [9] due to the rich view they provide on software evolution and their ease of exploitation since the advent of distributed version control systems.
Only very recently systematic initiatives [1, 6, 12] have been established to gather as much public VCS data as possible in a single logical place, enabling ESE research at the scale of, ideally, allpublicly available source code artifacts—i.e., our entire software commons[11]. In this paper we describe how we will conduct the first systematic exploratory study on the intrinsic structure of source code artifacts stored in publicly available version control systems.
As corpus we will use Software Heritage and its dataset [1, 15], which is the largest and most diverse collection of source code artifacts, spanning more than 5 billion unique source code files and 1 billion unique commits, collected from more than 80 million software projects.
MSR ’20, October 5–6, 2020, Seoul, Republic of Korea Antoine Pietri, Guillaume Rousseau, and Stefano Zacchiroli
The data model of our corpus is shown in Figure 1. It is a Merkle DAG [14], fully deduplicated, linking together in a single giant graph the development histories of all publicly available VCSs. Ac-tual source code files are represented as blob nodes, their grouping in source code trees as directory nodes; commit nodes are linked together by ancestry, supporting forks and N-ary merges; releases (or “tags”) are also supported; the full states of VCSs is recorded pe-riodically (similarly to what the Internet Archive wayback machine does for web pages) and associated to where it has been observed (a software origin, identified by an URL). We refer the reader to [15] for full details on the data model.
The study we will conduct will assess the most salient network topology properties [2] of the Software Heritage corpus as a graph. Such a systematic analysis is still missing in the literature and is needed for further empirical software engineering research for several reasons:
a) Determine the most appropriate large-scale analysis approach. Most “large-scale” studies of VCSs fall short of the full body of publicly available source code artifacts and either resort to random sampling or focus on popular repositories. This is a potential source of bias, but is understandable for practical reasons. To enable studies on the entire software commons we need, in addition to platforms [1, 12], an understanding of its intrinsic structure, to choose the most appropriate large-scale analysis approach [7, 16] depending on the study needs. For instance, if the graph is easy to partition into loosely connected components, then a scale-out approach with several compute nodes holding in memory graph quasi-partitions would be best; if the graph is highly connected a scale-up approach relying on graph compression [3] would be preferable. Similarly, knowing that most nodes are part of a single gigantic connect component (CC) would help in avoiding algorithmic approaches with high complexity on the size of the largest CC.
b) Avoid methodological pitfalls. The same understanding is needed to avoid making strong assumptions on what constitutes “typical” VCS data. These pitfalls have been warned against since the early days of GitHub [10], but that have not been quantified yet. The extent to which repositories on popular forges correspond to “well behaved” development repositories, as opposed to be outliers that are not used for software development or are built just to test the limits of hosting platforms or VCS technology is unknown. In our experience GitHub alone contains repositories with very weird arti-facts (commits with one million parents or mimicking bitcoin min-ing in their IDs, the longest possible paths, bogus timestamps [16], etc.). How many statistically relevant outliers of this kind exist is unknown and needs to be documented as reference knowledge to help researchers in the interpretation of their empirical findings.
c) Improve our understanding of our daily objects of study. More generally, in empirical software engineering we are collectively studying artifacts that naturally emerge from the human activity of software development. As it is commonplace in other sciences (and most notably physics), we want to study the intrinsic network properties of the development history of our software commons just because the corpus exists, it is available, and it is challenging to do so. The resulting findings might be also practically useful, but in spite of that we will obtain a more deep understanding of the nature of objects we study daily than what is known today.
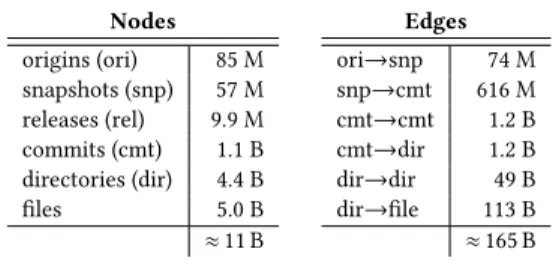
Table 1: Corpus size as a graph (release: 2018-09-25).
Nodes origins (ori) 85 M snapshots (snp) 57 M releases (rel) 9.9 M commits (cmt) 1.1 B directories (dir) 4.4 B files 5.0 B ≈11 B Edges ori→snp 74 M snp→cmt 616 M cmt→cmt 1.2 B cmt→dir 1.2 B dir→dir 49 B dir→file 113 B ≈165 B
2
RESEARCH QUESTIONS
Specifically we will perform an exploratory study, with no predeter-mined hypotheses, and answer the following research questions: RQ1 What is the distribution of indegrees, outdegrees and local
clustering of the public VCS history graph? Which laws do they fit?
How do such distributions vary across the different graph layers—file system layer (files + directories) v. history layer (commits + releases) v. origin layer.
RQ2 What is the distribution of connected component sizes for the public VCS history graph? How does it vary across graph layers?
RQ3 What is the distribution of shortest path lengths from roots to leaves in the recursive layers (commits and directories) of public VCS history graph.
3
VARIABLES
We define the following subsets of the starting corpus: • full corpus: the entire Software Heritage graph dataset • filesystem layer: full corpus subset consisting of file and
directory nodes only, and edges between them
• history layer: full corpus subset consisting of commit and releases only, and edges between them
• commit layer: subset of the history layer consisting of commit nodes only, and edges between them
• hosting layer: full corpus subset consisting of origins and snapshost nodes only, and edges between them
For each corpus we will measure the following variables: • indegree distribution: for each node the number of edges
pointing to it
• outdegree distribution: for each node the number of edges starting from it
• local undirected clustering distribution: for each node the number of edges between nodes pointing to or from it (= local clustering coefficient without dividing it by the number of possible egdes between its neighbors)
• CC size distribution: the size, in number of nodes, of each connected component in the underlying undirected graph of the input corpus
• (for the filesystem and commit layers only) path length distri-bution: distribution of the length of shortest paths between all root (indegree=0) nodes and all leave (outdegree=0) nodes
4
MATERIAL
Dataset. We intend to use the Software Heritage graph dataset [15] as corpus for the planned experiments. The main reasons for this choice are that: (1) it is the largest dataset about publicly software development history (see Table 1 for its size characteristics as a graph); (2) it is available as open data in various formats,1including
a simple nodes/edges graph representation; (3) it has been chosen as topic for the MSR 2020 Mining Challenge,2hence we expect
that by the time experiments will be run the body of related work around it will be substantial.
Software. We will use swh-graph [3] and WebGraph [4] to pro-duce and exploit compressed graph representations of the input corpus (see Section 5 for details). Statistical analyses will be per-formed using popular SciPy [13] components (NumPy, Pandas, ...). All developed custom code and derived data will be released as a complete replication package.
Hardware. We expect to be able to run all experiments on a single server equipped with 24 Intel Xeon 2.20 GHz CPUs and 750 GB of RAM, which is already available to us.
5
EXECUTION PLAN
We will follow the experiment protocol described below.
a. Retrieve the most recent version of the Software Heritage graph dataset [15] available, falling back to the one available at the time of writing (2018-09-25) if no newer releases have been published.
b. Compress the textual node/graph representation of the full dataset to a compact representation of its structure (which ignores all node metadata except node types) using swh-graph. Repeat for each subgraph of interest (see Section 3 for details). This step is expected to take about a week for the full graph and proportionally less time for the various subgraphs.
c. (RQ1) Compute indegrees, outdegrees and local clustering for all nodes in the graph, for all relevant (sub)graphs, exploiting the WebGraph [4] API with custom Java code.
d. (RQ2) Compute all connected components on all relevant (sub)graphs using well known algorithms [8] that can be imple-mented with custom Java code as visits (BFS or DFS) on the Web-Graph graph representations. A full graph visit is expected to take a few hours, scaling down linearly for subgraphs. [3]
e. (RQ3) For each subgraph of interest (e.g., the file system layer composed only of files and directory nodes), for all root nodes (e.g., source code root directories), create a shortest path spanning tree to all leaves (e.g. file or directory nodes with no children). Then export all path lengths. This can be implemented with custom Java code realizing Dijkstra’s algorithm on top of the WebGraph API. We have no precise estimate of how long this step will take; it will take more than a single full graph visit, due to paths that will be re-explored, but it should remain manageable. Thread-base parallelization is an option in case we need to speed up this step.
1https://annex.softwareheritage.org/public/dataset/graph/, retrieved 2020-01-09 2https://2020.msrconf.org/track/msr-2020-mining-challenge, retrieved 2020-01-09
6
ANALYSIS PLAN
6.1
Descriptive statistics
We will analyze the raw data obtained from the execution plan according to the following analysis protocol.
a. (RQ1) We will plot indegree/outdegree/local clustering dis-tributions as histograms, one histogram per distribution and per (sub)graph (see Section 3 for details).
• One figure per distribution and graph will be produced, show-ing both the raw histogram (i.e., for each degree/clustershow-ing value observed, the number of nodes with that value) as well as the cumulative distribution function (CDF) given by the number of nodes whose degree/clustering is greater than or equal to a given value. One or more scales among lin-lin, lin-log, log-lin, log-log scales will be used, depending on presentation needs.
• Each distribution will be qualitatively discussed by com-paring it with a generic distribution functions (power law, exponential law, Poisson law).
• In case they arise, the presence of outliers or other statistical anomalies with respect to more regular regions of the dis-tribution will be highlighted (e.g., change of law, change of slope, ...), and may lead to specific investigations to deter-mine their nature.
b. (RQ1) The nature of the tail of each distribution will be sys-tematically analyzed and discussed.
• The first observed criterion will be the amplitude of the range of degree values, expressed in decades.
• Then, we will use the discrete maximum likelihood estimator (MLE) to determine the scaling parameter [5, Eq. 3.7].
𝛼(𝑑𝑚𝑖𝑛) = 1 + 𝑛 " 𝑛 ∑︁ 𝑖=1 ln 𝑑𝑖 𝑑𝑚𝑖𝑛 #−1
where 𝑑𝑖, 𝑖=1, . . . , 𝑛are the observed degree values such
that 𝑑𝑖 ≥ 𝑑𝑚𝑖𝑛.
Without prejudging, nor speculating whether the distribu-tions will match power laws or not, we limit ourselves to the first step of the methodology proposed in [5, Box 1], using the above estimator which depends on an arbitrary degree threshold 𝑑𝑚𝑖𝑛, beyond which the behaviour of the
distri-bution is ignored, like a probe through the whole range of degrees.
The plot is displayed in log-lin scale over the degree range. Lacking precise information on the results at this stage, as well as knowledge about the impact of possible atypical events in the observed distributions, it is premature to plan to implement the subsequent steps of the aforementioned methodology.
c. (RQ2) We will display connected component size, focusing on VCS origins that contain at least one commit, as a set of histograms. • As above, both raw distribution functions and cumulative
distributions will be displayed.
• To characterize the aggregation process into connected com-ponents as nodes of different types, or at different depths, are added to the corpus:
MSR ’20, October 5–6, 2020, Seoul, Republic of Korea Antoine Pietri, Guillaume Rousseau, and Stefano Zacchiroli
– We will produce histograms showing the raw distribution and CDF, for each layer and depth within each layer. – For each of them, we will produce a table summarizing
the number of isolated origins and size of the largest con-nected component.
– We will quantitatively compare the distribution functions by displaying the Kolmogorv-Smirnov distance between them, weighted by connected component sizes expressed as the number of origin nodes they contain.
d. (RQ3) We will display the distribution of root-leaf shortest path lengths for the recursive layers of the public VCS corpus (commit and filesystem layers), as a pair of histograms.
•As before, both raw and cumulative distribution functions will be displayed and discussed.
6.2
Practical significance of the findings
RQ1’s answers will provide information on how the public VCS graph compares with other naturally occurring graphs in collabo-ration, such as the social network graphs or the graph of the Web. While seemingly only of theoretical significance, degree distribu-tions and derived properties such as graph density directly impact on the practical exploitability of graphs of this scale. For instance graphs with fat-tailed degree distributions compress better than others. We know from previous work [3, 16] how well the full VCS graph compress, but a systematic study of related properties for the subgraphs we intend to address here is still missing.
Findings related to RQ2 will directly tell how to best approach full-scale analyses of the various corpuses. If, for instance, it will turn out that 80% of the nodes are part of a gigantic component, than distributed approaches will be generally difficult to implement, due to entanglement and the pseudo-random nature of identifiers in Merkle DAG. Opposite considerations will apply for a more uniform distribution of CC sizes.
Finally, RQ3’s answers will tell what’s the average path depths in the recursive layers of the public VCS corpus, which is practically useful for several analysis needs. The average commit length is a limiting factor in analyses based on git blame, as we need to travel back development history to attribute files (if not SLOC) con-tributions. Similar considerations apply to average path lengths (in the filesystem layer), when we need to attribute files or directories to originating commits, for analysis or provenance tracking needs.
7
LIMITATIONS
Exploratory nature of the study. The study we propose is exploratory in nature, hence we state no hypotheses on the findings at this stage. This is intended, as the intrinsic structure of the public VCS corpus has never been characterized before at the extent we propose.
Algorithmic feasibility. With its 10+ B nodes and 160+ B edges the corpus we plan to study is a substantial graph for graph practition-ers standards; not as big as the graph of the Web, but significantly larger than most benchmarks used in the field. At this scale, algo-rithms with super-linear complexity are generally considered non practically applicable.
Our algorithmic approaches for RQ1 and RQ2 have linear com-plexity; the approach for RQ3 is super linear, but we are restricting
it to selected subgraphs and we expect it to exhibit enough shar-ing/caching to be practically treatable. We do not expect it to be the case but if, due to either algorithmic of technological considera-tions, any specific sub-experiment will turn out to be not practically feasible, we will resort to uniform random sampling.
External validity. Due to organic crawling lag, Software Heritage does not capture the full extent of publicly available VCSs. Hence we do not claim being able to characterize the intrinsic structure of the entire history of publicly available software development. The chosen dataset is nonetheless the best publicly accessible option available today to researchers. It is also well representative of the most popular development forge(s) in use today. As such we expect that the network topology findings of this study will provide useful insights to researchers and practitioners in the field.
REFERENCES
[1] Jean-François Abramatic, Roberto Di Cosmo, and Stefano Zacchiroli. 2018. Build-ing the Universal Archive of Source Code. Commun. ACM 61, 10 (Sept. 2018), 29–31. https://doi.org/10.1145/3183558
[2] Réka Albert and Albert-László Barabási. 2002. Statistical mechanics of complex networks. Reviews of modern physics 74, 1 (2002), 47.
[3] Paolo Boldi, Antoine Pietri, Sebastiano Vigna, and Stefano Zacchiroli. 2020. Ultra-Large-Scale Repository Analysis via Graph Compression. In SANER 2020: The 27th IEEE International Conference on Software Analysis, Evolution and Reengineering. IEEE.
[4] Paolo Boldi and Sebastiano Vigna. 2004. The webgraph framework I: compression techniques. In Proceedings of the 13th international conference on World Wide Web, WWW 2004, New York, NY, USA, May 17-20, 2004, Stuart I. Feldman, Mike Uretsky, Marc Najork, and Craig E. Wills (Eds.). ACM, 595–602. https://doi.org/10.1145/ 988672.988752
[5] Aaron Clauset, Cosma Rohilla Shalizi, and Mark EJ Newman. 2009. Power-law distributions in empirical data. SIAM review 51, 4 (2009), 661–703.
[6] Roberto Di Cosmo and Stefano Zacchiroli. 2017. Software Heritage: Why and How to Preserve Software Source Code. In Proceedings of the 14th International Conference on Digital Preservation, iPRES 2017. https://hal.archives-ouvertes.fr/ hal-01590958/
[7] Robert Dyer, Hoan Anh Nguyen, Hridesh Rajan, and Tien N Nguyen. 2013. Boa: A language and infrastructure for analyzing ultra-large-scale software repositories. In Proceedings of the 2013 International Conference on Software Engineering. IEEE Press, 422–431.
[8] John Hopcroft and Robert Tarjan. 1973. Algorithm 447: efficient algorithms for graph manipulation. Commun. ACM 16, 6 (1973), 372–378.
[9] Huzefa Kagdi, Michael L. Collard, and Jonathan I. Maletic. 2007. A survey and taxonomy of approaches for mining software repositories in the context of software evolution. Journal of software maintenance and evolution: Research and practice19, 2 (2007), 77–131.
[10] Eirini Kalliamvakou, Georgios Gousios, Kelly Blincoe, Leif Singer, Daniel M German, and Daniela Damian. 2014. The promises and perils of mining GitHub. In Proceedings of the 11th working conference on mining software repositories. ACM, 92–101.
[11] Nancy Kranich and Jorge Reina Schement. 2008. Information Commons. Annual Review of Information Science and Technology42, 1 (2008), 546–591.
[12] Yuxing Ma, Chris Bogart, Sadika Amreen, Russell Zaretzki, and Audris Mockus. 2019. World of code: an infrastructure for mining the universe of open source VCS data. In Proceedings of the 16th International Conference on Mining Software Repositories. IEEE Press, 143–154.
[13] Wes McKinney. 2012. Python for data analysis: Data wrangling with Pandas, NumPy, and IPython. O’Reilly Media, Inc.
[14] Ralph C. Merkle. 1987. A Digital Signature Based on a Conventional Encryption Function. In Advances in Cryptology - CRYPTO ’87, A Conference on the Theory and Applications of Cryptographic Techniques, Santa Barbara, California, USA, August 16-20, 1987, Proceedings. 369–378. https://doi.org/10.1007/3-540-48184-2_32 [15] Antoine Pietri, Diomidis Spinellis, and Stefano Zacchiroli. 2019. The Software
Heritage graph dataset: public software development under one roof. In Proceed-ings of the 16th International Conference on Mining Software Repositories, MSR 2019, 26-27 May 2019, Montreal, Canada.138–142.
[16] Guillaume Rousseau, Roberto Di Cosmo, and Stefano Zacchiroli. 2019. Growth and Duplication of Public Source Code over Time: Provenance Tracking at Scale. Technical Report. Inria. https://hal.archives-ouvertes.fr/hal-02158292.