HAL Id: halshs-00557171
https://halshs.archives-ouvertes.fr/halshs-00557171
Preprint submitted on 18 Jan 2011
HAL is a multi-disciplinary open access archive for the deposit and dissemination of sci-entific research documents, whether they are pub-lished or not. The documents may come from teaching and research institutions in France or abroad, or from public or private research centers.
L’archive ouverte pluridisciplinaire HAL, est destinée au dépôt et à la diffusion de documents scientifiques de niveau recherche, publiés ou non, émanant des établissements d’enseignement et de recherche français ou étrangers, des laboratoires publics ou privés.
Patrick Guillaumont, Catherine Korachais, Julie Subervie
To cite this version:
Patrick Guillaumont, Catherine Korachais, Julie Subervie. How Macroeconomic Instability Lowers Child Survival. 2011. �halshs-00557171�
Document de travail de la série Etudes et Documents
E 2006.39
How Macroeconomic Instability Lowers
Child Survival
Patrick Guillaumont* Catherine Korachais*
Julie Subervie*
October 2006
* Centre d’Etudes et de Recherche sur le Développement International (CERDI), Université d’Auvergne, 65 bvd F. Mitterrand, 63000 Clermont-Ferrand, France, www.cerdi.org, tel. : (+33) 4 73 17 75 01, fax. : (+33) 4 73 17 74 28
Abstract
The reduction of child mortality is one of the most universally accepted millennium goals. However, a significant debate came out on the means of reaching it and on its realism with regard to the situation of most of the least developed countries. The recommendations made for the achievement of this are mainly medical ones. However, without underestimating the importance of these measures, in particular vaccinations, it seems increasingly obvious that the rate of reduction of child mortality is mainly determined by the evolution of macroeconomic environment. The influence of per capita income level on mortality is frequently underlined.
But a given income growth does not have the same effect on child survival whether it is stable or unstable. Indeed, rises and falls of income probably have asymmetrical effects on mortality. The purpose of this analysis is precisely to show how macroeconomic instability influences the evolution of child mortality. The analysis is based on a panel sample of 97 developing countries over the period 1980-1999. The effect of exogenous shocks is first examined through a variable of income instability. The study of the relation is then deepened with "primary instabilities": instability of world agricultural commodity prices, instability of exports of goods and services and instability of agricultural production.
I - Introduction
The reduction of under-five mortality is one of the most universally accepted Millennium Goals. Yet a significant debate appeared about the means of reaching it and its realism concerning most of African countries (Sahn and Stifel 2003). The measures recommended for the achievement of this objective are mainly medical ones (Sachs 2002). However, without underestimating the importance of these measures, in particular vaccinations, it seems obvious that the reduction rate of child mortality is mainly determined by the evolution of macroeconomic environment (see Grigoriou 2005 for an overview of recent quantitative work on the determinants of under-five mortality).
The influence of per capita income level on mortality is frequently underlined. However, a same income growth does not have the same effect on child survival depending on whether it is stable or unstable. We here suppose that income rises and falls have asymmetrical effects on mortality. The goal of this analysis is thus to show how macroeconomic instability influences the evolution of under-five mortality. As income instability is itself mainly determined by exogenous factors of instability, such as world price or climatic instabilities, also defined as “primary instabilities” (Guillaumont, Guillaumont Jeanneney and Brun 1999), we are as well particularly interested in their impact on child survival.
Naturally, the analysis of the impact of instabilities on under-five mortality implies an accurate identification of the channels through which instabilities act. One of them is the effect on economic growth, which is itself a significant factor of lower mortality. But beyond this channel, which is based on a well-established literature, there are two other channels. We suppose that they result either from the impact of instabilities on the evolution of income distribution for a given growth, or, more directly, from irreversible effects of negative shocks on mortality. Thus, since under-five mortality represents the most reliable and universal indicator of poverty, it is possible to capture a general impact of instabilities on poverty.
Using the GMM system estimator on a panel sample of 97 developing countries covering four five-year periods from 1980 to 1999, we first examine the effect of exogenous shocks through income instability. We then explore more deeply the relation through primary instabilities:
world agricultural commodity price instability, instability of exports of goods and services, and instability of agricultural production.
Section II examines how instabilities affect child survival. Methodology and data are presented in section III. Section IV displays the results. Finally, section V brings concluding elements.
II - Three ways by which instabilities affect child survival
Negative shocks on income, or political shocks, are likely to involve mortality rises, as explained in various studies (Gakusi, Garenne and Gaullier 2005, Cornia and Paniccià 2000, Shkolnikov, Cornia, Leon and Meslé 1998). Here, we are interested in the rarely studied effect of instability, i.e. the effect of the succession of positive and negative shocks. Instability thus defined (instability of income, exports, terms of trade, climate, etc.) generally has two types of effects: ex ante risk effects, and ex post asymmetry effects due to different responses to falls and rises of income, exports, etc. (Guillaumont 2006). Asymmetry effects are easier to highlight and, as to effects on mortality, are probably prevailing. That is what we suppose, examining the three main channels through which instabilities affect child survival.
Effect resulting from a lower growth
Developing countries are often characterized by a strong macroeconomic instability. This observation has led to a significant literature on the relation between instabilities and growth (for an overview see Guillaumont 2006). Many works have tested either the negative effect of income growth instability (Ramey and Ramey 1995, Hnatkovska and Loayza 2005, Norbin and Yigit 2005), or the effect of "primary instabilities" (export, climatic, terms of trade instabilities) on income growth (for a simultaneous treatment of several instabilities, see for example Guillaumont, Guillaumont Jeanneney and Brun, 1999). The most abundant and oldest stream of literature refers to the effects of export instability. In these various works, the authors suppose either an effect of instability through uncertainty and innovation, or
asymmetric responses to positive and negative shocks1. Moreover, several of these works examine the factors conditioning the impact of instabilities on growth through interactive variables (Hnatkovska and Loayza 2005 for institutions quality, financial depth and trade openness, Guillaumont 1994, Combes and Guillaumont 2002 for openness policy).
Since instabilities have an effect on the average income level, they must influence mortality through this channel. The relation between average income level and mortality indicators has been studied for a long time (Preston 1975), and in many works. The existence of the relation between average income level and child survival rate is not questioned, but its functional form has been recently discussed (Grigoriou 2005): taking into account the bounded character of child survival, the logistic form is to be preferred to the logarithmic one which is traditionally used.
In this study, we focus on the effects of instability that do not result from a lower average income. We do not revisit the relation between instability and income growth and thus we do not have to consider the relation between average income and mortality. Nevertheless, we will see that the functional form of the relation between average income and mortality has implications concerning the effects of instability on mortality.
Effect resulting from a lower contribution of growth to poverty reduction
While there are many works relating to the effects of income growth on poverty (Ravallion and Chen 1997, Bourguignon 2003, Dollar and Kraay 2002, Adams 2004), only few works deal with the effects of income instability on poverty (and consequently on mortality). Even if the effect of shocks on poverty is often considered in the literature, in particular in microeconomic literature, the relation between income instability and poverty reduction for a given growth has rarely been tested directly (see however Guillaumont 2006, Guillaumont and Korachais 2006). It is indeed reasonable to suppose that, for a given income growth, instability affects poverty level, measured either by its incidence, or by its depth: instability has permanent asymmetrical effects on the living conditions of the poor (people below the poverty line) and the "almost poor" (people close to the poverty line). The poor and "almost
1
poor" are particularly exposed to negative shocks, the effects of which are not compensated by positive ones. Macroeconomic instability can thus affect the standard of living of the poorest without modifying the average income level. For instance, parents decisions regarding their children attending school, loss of human capital associated to layoff or to productive assets liquidation are asymmetrical in that sense they are not easily reversible. This idea is directly inherited from the microeconomic literature on "poverty trap", which is difficult to escape due to microeconomic and macroeconomic conditions.
Since instability influences income distribution, it has an effect on poverty, which does not pass through the average income level. This complex and changing effect has been the subject of some rare cross-country econometric analyses (Breen and Garcia-Peñalosa 2005, Laursen and Mahajan 2005). Referring to microeconomic results (see for example Dercon 2006), Agénor (2002) as well as Laursen and Mahajan (2005) examine the main reasons why the poor are more vulnerable than the non-poor: the poor have little diversified sources of income, they are little qualified and less mobile between sectors and areas, they have little access to credit and insurance markets and they depend more on public transfers and social services. However, the analyses of instability effects among income groups show that the next to last quintile – instead of the last one - appears to be the most affected. That is why we can suppose that the "almost poor" may become "durably poor" under unstable conditions.
The effect of instabilities on income distribution and monetary poverty is likely to have consequences on mortality insofar as the survival function of each country is concave: since instability makes income distribution more unequal, it is likely to cause an increase in average mortality for a given average income level. Indeed, it has been shown that the relationship between child survival and income should be logistic (which means first convex then concave). But, as child survival is above 500 per thousand in all countries, it amounts to saying that we study only the concave part of the relationship. That involves a negative effect of inequality on survival, for a given average income level (Figure 1). It should be noted that the effect of instability on income distribution mainly occurs in the medium or long term.
Figure 1: The survival level associated to an equal (stable) income is higher than the survival level associated to an unequal (unstable) income: ( )s y > s
A direct asymmetry effect or irreversibility effect
Macroeconomic instability can affect child survival without necessarily modifying either the average income level or its distribution. Indeed, negative economic shocks can have negative effects on child health, which cannot be compensated by a subsequent positive shock. Sharp falls in income involves rises in child mortality due to the deterioration of physical or mental health. This deterioration can come from a reduction in the access to food, drugs or medical care, or from suddenly unhealthier living conditions. That was the case under acute circumstances such as famines (Sen 1983) or the transition of some ex-USSR countries (Cornia and Paniccià 2000), but that is also likely to occur in less critical situations, in particular among poor people. Moreover, health deterioration leads to rises in child mortality that cannot be compensated by a positive shock: when economic conditions change and
1
y
y
( )
s y
s
2y
1s
2s
U5S U5S Ln(GDP per capita)become more favourable, child mortality does not decrease as much as to ensure compensation. This effect is perceptible in the short term (covering the length of a two-phase cycle), but the deterioration of child health can also have irreversible effects on child mortality in the longer term.
This effect too follows from the concavity of the survival function: for a given average income level, the average survival level is higher if income is stable than if it is unstable. Here, we refer again to Figure 1. However the "distribution effect" differs from the irreversibility effect. First, the "distribution effect" resulting from instability, as it is less direct, may be lower than the irreversibility effect. Second, the direct effect of irreversibility is rather a short-term effect, whereas the effects likely to modify income distribution mainly work on a longer term.
We must also examine the implications of the change in concavity with the average income level: for a survival rate higher than 500 per thousand, concavity increases then decreases, tending to disappear2. As a result, the irreversibility effect of instability on survival is successively increasing then decreasing with the average income level, the maximum being reached when the third derivative of the survival function is null. However, this point is reached for an extremely low level of income, so that the countries of the sample are all located beyond this point. It results that the direct effect of instability is expected to be decreasing on our sample (Figure 2), i.e. it is likely to be higher in the low-income countries than in other countries (see section IV for details).
When we consider the relation over several periods, we also must take into account that the relation varies along with time: the curve moves up because of technical progress, i.e. the improvement and the dissemination of knowledge. Since the function is logistic, this curve’s movement implies a stronger concavity. It results that the more significant technical progress is, the stronger the effect of the instability on the average survival level is, and the more this effect declines with the increase in the average income level.
2
Null at the inflection point located at 500 per thousand, the second derivative of the survival function is then negative. Moreover, on this interval, it is first decreasing then increasing.
Figure 2: The survival level associated to a stable income is higher than the survival level associated to an unstable income, and all the more so as the average income is weak (as long as we are located in the zone where concavity decreases).
Thus, macroeconomic instability can reduce under-five survival by three ways: it reduces the average income growth and makes it more unequal - those two indirect effects contributing to a lower reduction of child mortality - but, it also directly increases child mortality by an irreversible way, when the living conditions of the poor temporarily worsen.
1t
y
1y
y
1t′y
2ty
2y
2t′ 1s
1( )
s y
2 s U5S U5S Ln(GDP per capita) 2 ( ) s yIII - Methodology
Definitions of the variable to be estimated and the variable of interest
Since the under-five survival indicator is limited asymptotically, and an increase in this indicator does not represent the same performance whether its initial level is weak or high, the best functional form to examine is that where the variable is expressed as a logit (Grigoriou 2005). We choose the under-five survival indicator (U5S) in preference to the under-five mortality indicator (U5M), so that an increase in the indicator reflects an improvement, that is to say:
U5S
logit U5S ln ln(U5S) ln(U5M) 1-U5S
S = = = −
where U5M is the under-five mortality rate ranging between 0 and 1 and U5S = 1 – U5M
The under-five survival indicator is extracted from the under-five mortality data of the Demographic Health Surveys supplemented by the estimates of the World Health Organization (Ahmad, Lopez and Inoue 2000). This database corresponds to the most recent update, most complete and most homogeneous of the various works already carried out by the UNICEF, the World Bank and the United Nations, since it provides estimates of the average under-five mortality rate, over five-year periods between 1955 and 1999, for 171 of the 191 member states of the World Health Organization.
The instability of a variable is always measured relative to a reference value. It is often measured by the standard deviation of the growth rate, i.e. relative to the average growth rate. But it is preferable to measure the deviation from the trend. The problem lies then in the choice of this trend value. Insofar as the series may not be neither purely deterministic, nor purely stochastic, the reference value can be estimated from a mixed adjustment, combining at the same time a deterministic element and a stochastic element (method used in various works of the CERDI and chosen by the Committee for Development Policy (United Nations) for the
measurement of the Economic Vulnerability Index). The indicator thus selected is the average of the quadratic deviation relative to the mixed trend3:
2 0 ˆ ˆ 1 1 100
∑
= + + + − + = n k t k k t k t quadra Y Y Y n Inswhere Yˆt =exp(lnYt′)and lnYt′=aˆ+bˆ.lnYt−1 +cˆ.t
The model
The relation between income instability and under-five survival
The model that allows us to test the effect of income instability on under-five survival while controlling for the average income level is as follows:
it i it it it it Ins y X S =
α
0 +α
1. +α
2. +α
3. +µ
+η
(1) where Sit is the logit of the under-five survival rate over a five-year period, yit is the averageper capita income over the period expressed in logarithms, Xit is a vector of control variables
such as the importance of vaccinations or women’s education (expressed in logarithms),
µ
irepresents country-specific effects and
η
it is the error term. Here, income instability (Insit)influences the average child survival rate, independently of the average income level.
We first choose to measure the instability of per capita income over the same period t. This "present instability" is measured with regard to a four-decade mixed trend (1960-2000) as explained above. Then, we also measure instability over the previous period, in order to capture the effects likely to act on a longer term (in particular, some effects likely to modify income distribution). "Past instability" captures the effect of shocks occurring between 1975 and 1979 on child survival during period 1980-1984, between 1980 and 1984 on child survival during period 1985-1989, and so on. Finally, we use a measure of instability covering twelve years, i.e. both the past and present periods. In other words, "overall instability" takes
3
This measurement seems to be best adapted to our study. However, tests of robustness have been carried out with alternative measurements such as the standard deviation of the annual growth rate and the average of the absolute deviation relative to the mixed trend:
∑
+ − ++ = n t k t k absolu Y Y Y n Ins ˆ ˆ 1 100
into account shocks occurring between 1972 and 1984 for period 1980-1984, between 1977 and 1989 for period 1985-1989, and so on.
The relation between primary instabilities and under-five survival
We also analyze the effect of primary instabilities on child survival because we suppose they are the main sources of income instability. Low-income countries being often characterized by a significant share of primary commodities in their exports and by a strong exposure to natural disasters, the incidence of the instability of world agricultural commodity prices and that of climatic shocks are supposed to be higher there than in developed countries (IMF 2003). In order to test the effect of primary instabilities, we introduce successively into the model the instability of exports of goods and services in constant dollars (in this sense, exports measure is a "volume" measure), the instability of agricultural production per capita (which often refers to climatic instability), and the instability of world agricultural commodity prices4. The econometric models, which allow us to test the effects of primary instabilities on child survival for a given income level, are similar to the previous model.
Data, variables, and sample
The econometric analysis is based on a panel of 97 developing countries over the periods 1980-1984, 1985-1989, 1990-1994 and 1995-1999. Table 1 displays the composition of the sample. In order to control for the country-specific effects, the potential endogeneity of the regressors and the omitted variable bias, we use the GMM system estimator.
Into each model, we introduce two important control variables but of which the availability is relatively limited (which implies to reduce the sample): the rate of diphtheria-pertussis-tetanus (DPT) vaccination of children less than one year of age (WDI 2005) as well as the average number of schooling years of women more than 25 years of age (Barro and Lee 2000).
4
It is also possible to combine these two primary instabilities in an index of exogenous shocks, via a simple or weighted average. The results obtained did not prove to be conclusive.
For the variables of which we measure instability, average income is measured by the GDP per capita expressed in constant dollars base year 2000 (WDI 2005). The variable of export instability is measured from the total of exports of goods and services in constant dollars base year 2000 (WDI 2005). The variable of climatic instability is measured from the agricultural production index per capita (FAOSTAT 2006). The world agricultural commodity price index is of Deaton-Miller type5,constructed from price series in dollars (IFS 2005), converted into local currency, deflated by the export unit value of the developed countries.
IV - Results
Descriptive statistics
As we said above, the econometric analysis is based on a panel of 97 developing countries for which 4 observations are available: 1980-1984, 1985-1989, 1990-1994 and 1995-1999. The panel is not balanced. Moreover, the sample can vary noticeably with the introduction of some variables6.
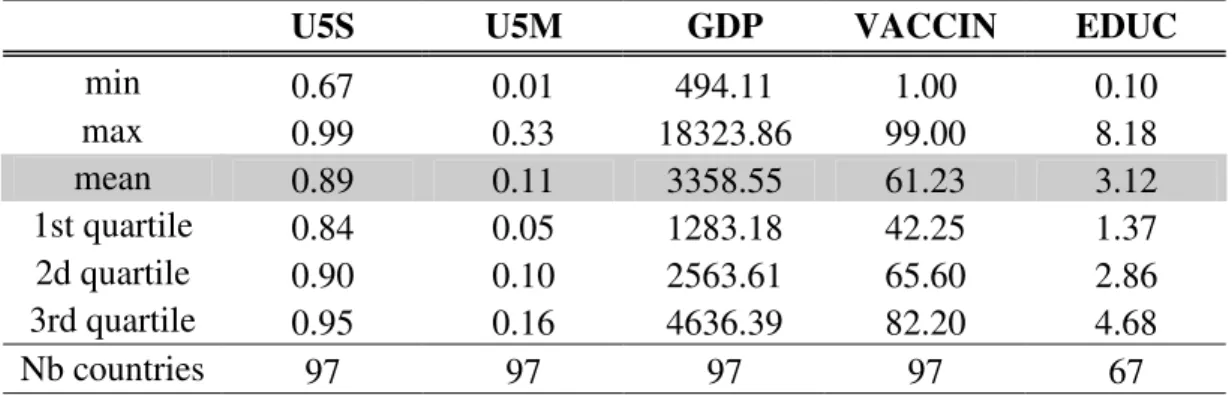
Table 2 gives the statistical description of the variables. It reveals some heterogeneity within the sample: the under-five mortality rate is multiplied by 3.2 between the first and the third quartile, the rate of vaccination by almost 2 and the level of education by 3.4. We also observe some heterogeneity in levels of income instability, export instability, agricultural production instability and world agricultural commodity price instability are not particularly striking between the quartiles (instability is multiplied by approximately 2 between the first quartile and the third quartile). Furthermore, if income instability and climatic instability remain moderate on average (respectively 4.14% and 6.22%), the average instability of exports and that of world prices (which are dependent) prove rather important since they respectively reach 10.83% and 16.63%.
5
The Deaton-Miller index is a geometrically weighted index. Here, the price of each commodity is weighted by its share in the total value of the agricultural production in 1990:
∏
= j Wi jt it P P 0 6In particular, the estimate of the effect of the instability of world agricultural prices on child survival is carried out on a sample reduced to the agricultural commodity-exporting countries, i.e. the countries whose exports of
The effects of instability on child survival
The effects of instability on child survival have been tested with a semi-logarithmic model. Indeed, the effect of instability on child survival depends on whether the initial level of instability is weak or high. The variable of interest is thus not expressed in logarithms, unlike the control variables.
Table 3 displays the results of the estimate of the effect of "present instability" (measured by the average of the quadratic deviation relative to a mixed trend) on the logit of child survival, using the GMM system estimator. In order to enlarge the sample, we choose to also run regressions without including the education variable, which drops many observations. The effect of average income instability on child survival proves to be significant at a threshold of 1% for the two samples. As well, primary instabilities appear to be significant (only on the small sample for export instability). Moreover, the effect of income instability on child survival has been tested with two other measurements of instability (the standard deviation of annual growth rate and the average of the absolute deviation relative to the mixed trend). The results prove also significant (they are not presented here).
We also run regressions including an interactive term (Insit*yit) in order to capture the likely
decreasing effect of instability with income level. The results are not significant (they are not presented here). Actually, although the effect of instability seems to decrease with income level, this phenomenon does not appear very pronounced in our sample. This can be highlighted by the examination of the estimated logistic function. From results displayed in Table 3 column 1, we get the following relationship (for the mean value of the vaccination variable): Logit U5S = 0.9ln(GDP) – 4.5 (2) which is equivalent to : 0.9 1 5 1 exp( 4.5) U S GDP = + − (3)
From this equation, we get the second derivative function (Figure 3).
Figure 3: The second derivative function Source: authors calculations.
The second derivative function is negative and increasing, which means that the curve is concave and that concavity diminishes when income increases. Nevertheless, we note that the decrease in the effect of instability may not be very strong since many observations are located on the right part of the logistic curve where concavity does not vary much (the minimum income level equals 500 PPP$, see Figure 3). This can explain the lack of significance of the results concerning an effect of instability expected to decrease with income (Figure 4 displays function (3), which seems to fit well with the scatterplot).
Table 4b gives the marginal impact of instability (measured from the calculations provided in table 4a) according to several values of child survival7: when income instability increases by 5 points, the average child survival rate decreases by 0.018 units (0.024 units for the first quartile of child survival). In other words, the average mortality rate is strongly affected since it passes from 110 to 128 per thousand (from 160 to 184 per thousand for the first quartile of child survival). Moreover, the marginal impact of income instability is 2.8 times stronger for the first quartile of child survival than for the third one.
7
0 0.2 0.4 0.6 0.8 1 1.2 0 2000 4000 6000 8000 10000 12000 14000 GDP per capita (PPP) C h il d s u rv iv al r at e
Figure 4: The estimated survival function Source: authors calculations.
The results concerning the effects of export instability, climatic instability and world price instability can be analyzed in a similar way: when export instability increases by 10 points, the average mortality rate passes from 110 to 119 per thousand (from 160 to 172 per thousand for the first quartile of child survival). In the same way, when agricultural production instability increases by 10 points, the average mortality rate passes from 110 per thousand to 129 per thousand (from 160 to 185 per thousand for the first quartile of child survival). Lastly, when the instability of the world agricultural commodity prices increases by 10 points, the average mortality rate passes from 110 to 120 per thousand (from 160 to 173 per thousand for the first quartile of child survival).
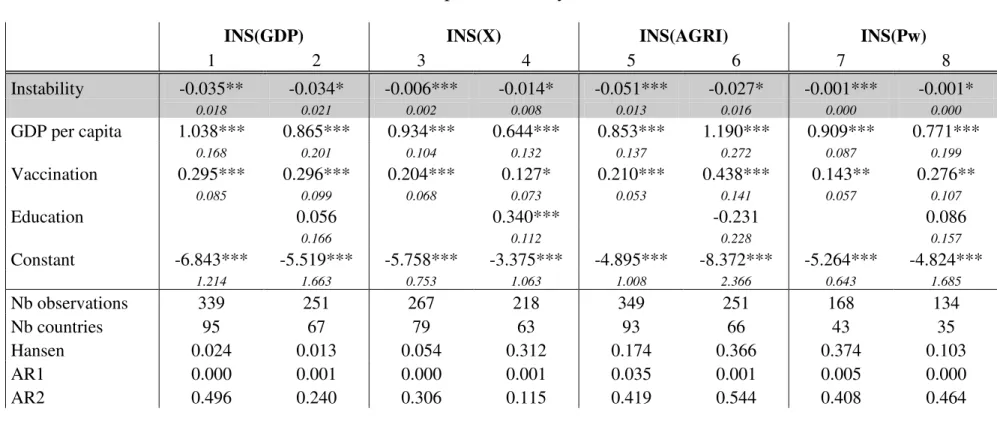
Table 5 presents the effect of "past instability" (income instability then primary instabilities), which appears significant on the two samples. Table 7a gives the marginal impact of "past instability" according to several values of child survival: when income instability increases by 5 points, the average child survival rate decreases by 0.0155 units (0.0205 units for the first quartile of child survival). In other words, the average mortality rate passes from 110 to 125 per thousand (from 160 to 180 per thousand for the first quartile of child survival).
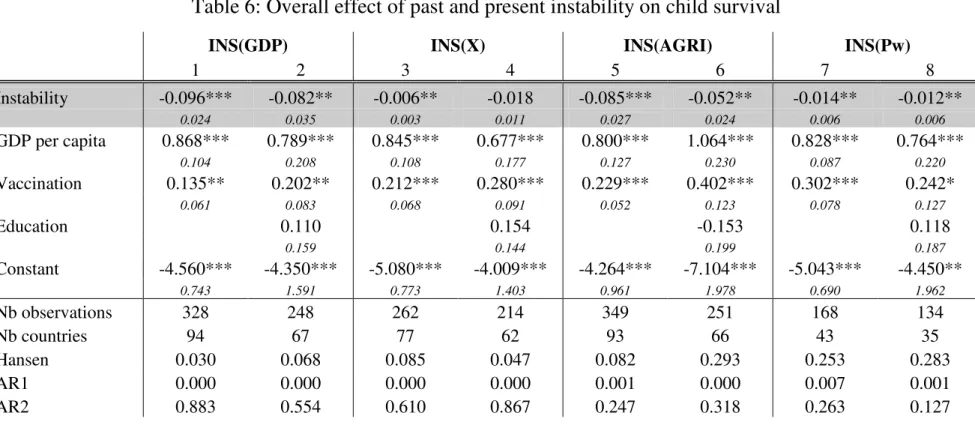
Table 6 shows as well a significant effect of "overall instability" (except for export instability which is significant only on the large sample). Note that the coefficients of "overall instability" are larger than the coefficients of "past instability" (Table 5) and of "present instability" (Table 3). Indeed, the "overall instability" may reflect both the irreversibility effect, which is likely to occur over the period, and the effect of instability over the previous years. Table 7b gives the marginal impact of "overall instability" on child survival: when income instability increases by 5 points, the average child survival rate decreases by 0.037 units (0.049 units for the first quartile of child survival). So, the average mortality rate is strongly affected since it passes from 110 to 147 per thousand (from 160 to 209 per thousand for the first quartile of child survival).
V - Conclusion
In this paper, we argue macroeconomic instabilities are likely to affect under-five survival beyond their effect through a lower economic growth. First, they have an irreversible influence on child mortality due to asymmetry in the reaction of child health to ups and downs in economic variables. Moreover, they may involve a stronger income inequality (as "almost poor" people are more likely to suffer from income shocks), which decreases the average child survival rate.
Our econometric analysis made it possible to establish, controlling for the impact of average income, several results relating to the relation between instabilities and under-five survival: average income instability, as well as primary instabilities (climatic instability, world commodity price instability, export instability), which are the main exogenous sources of income instability, appeared to have a direct effect ("present instability") on child survival in the developing countries of the sample. This effect proved to be of quite large scale, since, while increasing by 5 points, income instability is likely to involve an increase of 16% in the mortality rate. Moreover, income instability appeared to have also an effect on child survival in the longer run ("past instability"), although of smaller size.
These results, in conformity with our assumptions, must however be regarded as provisional and exploratory. The analysis here presented can be extended in several directions. One is to
work out a specification of the relation making it possible to test the existence of thresholds and other non-linearities: is there a minimum level of instability above which the effect matters? Is there a level of per capita income above which there is no longer significant effect of instability? What are the factors conditioning the effect of instability? It would also be interesting to compare the direct effects of macroeconomic instability on child survival with those resulting from a lower economic growth.
References
Acemoglu, D.; Johnson, S.; Robinson, J. & Thaicharoen, Y. (2003), 'Institutional Causes, Macroeconomic Symptoms, Volatility, Crises and Growth', Journal of Monetary Economics 50, pp. 49-123.
Adams, R.J. (2004), 'Economic Growth, Inequality and Poverty: Estimating the Growth Elasticity of Poverty', World Development 32(12), pp. 1989-2014.
Agénor, P. (2002), 'Macroeconomic Adjustment and the Poor, Analytical Issues and Cross-Country Evidence', World Bank Policy Research Working Paper 2788.
Ahmad, O.B.; Lopez, A.D. & Inoue, M. (2000), 'The Decline in Child Mortality: A Reappraisal', Bulletin of the World Health Organization 78 (10), 1175-1191.
Barro, R.J. & J.-W., L. (2000), 'International Data on Educational Attainment Updates and Implications', National Bureau of Economic Research Working Paper 7911.
Bourguignon, F. (2003), 'The Growth Elasticity of Poverty Reduction: Explaining Heterogeneity across Countries and Time Periods', in T. Eicher and S. Turnovski, Inequality
and Growth: Theory and Policy Implications, MIT Press, Cambridge.
Breen, R. & Garcia-Peñalosa, C. (2005), 'Income Inequality and Macroeconomic Volatility: An Empirical Investigation', Review of Development Economics 9 (3), pp. 380-398.
Combes, J. & Guillaumont, P. (2002), 'Commodity Price Volatility, Vulnerability and Development', Development Policy Review 20 (1). p. 25.
Cornia, G. & Paniccià, R. (2000), The Mortality Crisis of Transitional Economies, Oxford University Press.
Dercon, S. (2006), 'Vulnerability: A Micro Perspective', in Bourguignon F., Pleskovic B., van der Gaag J., Edrs, Securing Development in an Unstable World (Annual Bank Conference on Development Economics Europe, Amsterdam), pp. 117-146
Dollar, D. & Kraay, A. (2002), 'Growth is Good for the Poor', Journal of Economic Growth 7(3), pp. 195-225.
Gakusi, A.; Garenne, M. & Gaullier, G. (2005), 'Chocs Externes, Gestions de l'Etat et Mortalité des Enfants en Zambie de 1964 à 1998', African Development Review 17 (1), p. 70.
Grigoriou, C. (2005), 'Essais sur la vulnérabilité des enfants dans les pays en développement : l'impact de la politique économique', Thesis, Université d’Auvergne, Centre d'Etudes et de Recherches sur le Développement International
Grigoriou, C. et Guillaumont P.(2003), 'A Dynamic Child Survival Function: Natural Convergence and Economic Policy', CERDI Etudes et Documents Ec 2003.33.
Guillaumont, P. (1994), 'Politique d'ouverture et croissance économique : les effets de la croissance et de l'instabilité des exportations', Revue d'économie du développement 1, pp. 91-114.
Guillaumont, P. (2006), 'Macro Vulnerability in Low-Income Countries and Aid Responses', in Bourguignon F., Pleskovic B., van der Gaag J., Edrs, Securing Development in an Unstable
World, (Annual Bank Conference on Development Economics, Amsterdam), pp. 65-108.
Guillaumont, P.; Guillaumont Jeanneney, S. & Brun, J. (1999), 'How instability Lowers African Growth', Journal of African Economies 8 (1), pp. 87-107.
Guillaumont, P. & Korachais, C. (2006), 'Macroeconomic Instability Makes Growth Less Pro Poor, in Africa and Elsewhere: A Preliminary Examination', CSAE Conference 'Reducing Poverty and Inequality: How can Africa be included?', Oxford.
Guillaumont Jeanneney, S. & Kpodar, R (2005), 'Financial Development, Financial Instability and Poverty', Oxford, CSAE Working Paper Series/2005-09.
Hnatkovska, V. & Loayza, N. (2005), 'Volatility and Growth', in J. Aizenman and B. Pinto,
Managing Economic Volatility and Crises: A Practitioner's Guide, Cambridge University Press, pp. 65-100.
IMF (2003), 'Fund Assistance for Countries Facing Exogenous Shocks', Technical report, Policy Development and Review Department.
Laursen, T. & Mahajan, S. (2005), 'Volatility, Income Distribution, and Poverty', in J. Aizenman and B. Pinto, Managing Volatility and Crisis: A Practitioner’s Guide, Cambridge University Press, pp. 101-136.
Norrbin, S.C. & Yigit, F.P. (2005), 'The Robustness of the Link between Volatility and Growth of Output', Review of World Economics 141 (2), pp. 343-356.
Preston, S. (1975), 'The Changing Relation between Mortality and Level of Economic Development', Population Studies 29 (2), pp. 231-248.
Raddatz, C. (2005), 'Are External Shocks Responsible for the Instability of Output in Low-income Countries?', World Bank Policy Research Working Paper 3680.
Ramey, G. & Ramey, V. (1995), 'Cross-Country Evidence on the Link between Volatility and Growth', American Economic Review 85 (5), pp. 1138-1151.
Ravallion, M. & Chen, S. (1997), 'What Can New Survey Data Tell Us about Recent Changes in Distribution and Poverty?', World Bank Economic Review 11 (2), pp. 357-382.
Sachs, J.D. (2002), 'Macroeconomics and Health: Investing in Health for Economic
Development', Technical Report, World Health Organization, Commission on Macroeconomics and Health.
Sahn, D.E. & Stifel, D.C. (2003), 'Progress Toward the Millennium Development Goals in Africa', World Development 31 (1), pp. 23-52.
Sen, A. (1983), Poverty and Famines: An Essay on Entitlement and Deprivation, Oxford University Press.
Shkolnikov, V.M., Cornia, G.A, Leon, D.A. & Mesle, F. (1998), 'Causes of the Russian Mortality Crisis: Evidence and Interpretations', World Development 26 (11), pp. 1995-2011.
Table 1: Sample
* Algeria Eritrea * Mozambique
Angola Ethiopia Namibia
* Argentina * Fiji * Nepal
* Bangladesh Gabon * Nicaragua
Belize * Gambia * Niger
* Benin * Ghana Nigeria
* Bolivia * Guatemala Oman
* Botswana Guinea * Pakistan
* Brazil Guinea-Bissau * Papua New Guinea
Burkina Faso * Guyana * Paraguay
* Burundi * Haiti * Peru
Cambodia * Honduras * Philippines
* Cameroon * India * Rwanda
Cape Verde * Indonesia Samoa
* Central African Republic * Iran, Islamic Rep. Saudi Arabia
Chad * Jamaica * Senegal
* Chile * Jordan * Sierra Leone
* China * Kenya Solomon Islands
* Colombia Lao PDR * South Africa
Comoros Lebanon * Sri Lanka
* Congo, Dem. Rep. * Lesotho * Sudan
* Congo, Rep. Madagascar * Swaziland
* Costa Rica * Malawi * Syrian Arab Republic
Cote d'Ivoire * Malaysia Tanzania
Djibouti * Mali * Thailand
* Dominican Republic * Mauritania * Togo
* Ecuador * Mauritius * Trinidad and Tobago
* Egypt, Arab Rep. * Mexico * Tunisia
El Salvador Mongolia * Turkey
Equatorial Guinea Morocco * Uganda
* Uruguay Vanuatu * Venezuela Vietnam Yemen, Rep. * Zambia * Zimbabwe
Table 2: Descriptive Statistics
U5S U5M GDP VACCIN EDUC
min 0.67 0.01 494.11 1.00 0.10 max 0.99 0.33 18323.86 99.00 8.18 mean 0.89 0.11 3358.55 61.23 3.12 1st quartile 0.84 0.05 1283.18 42.25 1.37 2d quartile 0.90 0.10 2563.61 65.60 2.86 3rd quartile 0.95 0.16 4636.39 82.20 4.68 Nb countries 97 97 97 97 67
INS(GDP) INS(X) INS(AGRI) INS(Pw)
min 0.36 0.97 0.96 2.30 max 18.54 62.65 22.57 124.72 mean 4.14 10.83 6.22 16.63 1st quartile 2.34 5.87 3.22 8.94 2d quartile 3.58 8.81 4.71 12.75 3rd quartile 5.38 13.12 8.54 17.96 Nb countries 97 82 92 43
U5M Under-five mortality rate, bounded by 0 and 1.
U5S Under-five survival rate, bounded by 0 and 1 (U5S = 1 – U5M). GDP Gross domestic product per capita, based in purchasing power parity,
constant international dollars base year 2000.
VACCIN Rate of DPT vaccination of children less than one year of age.
EDUC Average number of schooling years of women more than 25 years of age.
INS(GDP) Instability of per capita income, constant dollars, base year 2000.
INS(X) Instability of exports of goods and services, constant dollars, base year 2000. INS(AGRI) Instability of agricultural production per capita.
Table 3: Effect of "present instability" on child survival
INS(GDP) INS(X) INS(AGRI) INS(Pw)
1 2 3 4 5 6 7 8 Instability -0.061*** -0.039*** -0.005 -0.010** -0.042*** -0.020* -0.008*** -0.010*** 0.012 0.014 0.004 0.005 0.012 0.012 0.003 0.004 GDP per capita 0.881*** 0.749*** 0.825*** 1.007*** 0.920*** 1.094*** 0.846*** 0.806*** 0.106 0.124 0.108 0.273 0.127 0.247 0.087 0.205 Vaccination 0.160*** 0.122* 0.208*** 0.357*** 0.175*** 0.370*** 0.283*** 0.246** 0.055 0.066 0.062 0.13 0.049 0.117 0.075 0.113 Education 0.215** -0.107 -0.133 0.078 0.103 0.245 0.203 0.163 Constant -4.935*** -3.995*** -4.883*** -6.780*** -5.278*** -7.436*** -5.217*** -4.821*** 0.769 0.964 0.787 2.27 0.958 2.06 0.692 1.766 Nb observations 353 254 293 225 345 247 168 134 Nb countries 97 67 82 61 92 65 43 35 Hansen 0.071 0.141 0.034 0.119 0.088 0.069 0.109 0.226 AR1 0.004 0.002 0.000 0.001 0.082 0.000 0.073 0.045 AR2 0.803 0.119 0.826 0.869 0.116 0.190 0.069 0.069 Estimator: GMM system
Dependent variable: logit of under-five survival rate (S)
INS(GDP): Instability of per capita income, constant dollars, base year 2000.
INS(X): Instability of exports of goods and services, constant dollars, base year 2000. INS(AGRI): Instability of agricultural production per capita.
INS(Pw): Instability of international agricultural prices. Instability is measured on each period t.
All variables are expressed in logarithms except instability Periods: 1980-1984, 1985-1989, 1990-1994, 1995-1999
Standard errors, corrected for heteroskedasticity, appear below the coefficients. * significant at 10%, ** significant at 5%, *** significant at 1%
Table 4a: Impact of instability (Ins) on under-five survival (s)
according to a semi-logistic specification
Specification Derivative
ds
dIns
=
β
Interpretation ln . 1 s Ins s α β = + − 1 . . .(1 ) ds dIns s −s =β . .(1 ) ds s s dIns =β − Marginal impact depending onβ and on .(1 ) s −s(Source: following the analysis of Grigoriou 2005)
Table 4b: Marginal impact of "present instability" on child survival
INS(GDP) INS(X) INS(AGRI) INS(Pw)
Mean of U5S -0.0036 -0.0009 -0.0019 -0.0010 First quartile of U5S -0.0047 -0.0012 -0.0025 -0.0013 Second quartile of U5S -0.0032 -0.0008 -0.0017 -0.0009 Third quartile of U5S -0.0017 -0.0004 -0.0009 -0.0004
Table 5: Effect of "past instability" on child survival
INS(GDP) INS(X) INS(AGRI) INS(Pw)
1 2 3 4 5 6 7 8 Instability -0.035** -0.034* -0.006*** -0.014* -0.051*** -0.027* -0.001*** -0.001* 0.018 0.021 0.002 0.008 0.013 0.016 0.000 0.000 GDP per capita 1.038*** 0.865*** 0.934*** 0.644*** 0.853*** 1.190*** 0.909*** 0.771*** 0.168 0.201 0.104 0.132 0.137 0.272 0.087 0.199 Vaccination 0.295*** 0.296*** 0.204*** 0.127* 0.210*** 0.438*** 0.143** 0.276** 0.085 0.099 0.068 0.073 0.053 0.141 0.057 0.107 Education 0.056 0.340*** -0.231 0.086 0.166 0.112 0.228 0.157 Constant -6.843*** -5.519*** -5.758*** -3.375*** -4.895*** -8.372*** -5.264*** -4.824*** 1.214 1.663 0.753 1.063 1.008 2.366 0.643 1.685 Nb observations 339 251 267 218 349 251 168 134 Nb countries 95 67 79 63 93 66 43 35 Hansen 0.024 0.013 0.054 0.312 0.174 0.366 0.374 0.103 AR1 0.000 0.001 0.000 0.001 0.035 0.001 0.005 0.000 AR2 0.496 0.240 0.306 0.115 0.419 0.544 0.408 0.464 Estimator: GMM system
Dependent variable: logit of under-five survival rate
INS(GDP): Instability of per capita income, constant dollars, base year 2000.
INS(X): Instability of exports of goods and services, constant dollars, base year 2000. INS(AGRI): Instability of agricultural production per capita.
INS(Pw): Instability of international agricultural prices. Instability is measured on each period (t-1).
All variables are expressed in logarithms except instability Periods: 1980-1984, 1985-1989, 1990-1994, 1995-1999
Standard errors, corrected for heteroskedasticity, appear below the coefficients. * significant at 10%, ** significant at 5%, *** significant at 1%
Table 6: Overall effect of past and present instability on child survival
INS(GDP) INS(X) INS(AGRI) INS(Pw)
1 2 3 4 5 6 7 8 Instability -0.096*** -0.082** -0.006** -0.018 -0.085*** -0.052** -0.014** -0.012** 0.024 0.035 0.003 0.011 0.027 0.024 0.006 0.006 GDP per capita 0.868*** 0.789*** 0.845*** 0.677*** 0.800*** 1.064*** 0.828*** 0.764*** 0.104 0.208 0.108 0.177 0.127 0.230 0.087 0.220 Vaccination 0.135** 0.202** 0.212*** 0.280*** 0.229*** 0.402*** 0.302*** 0.242* 0.061 0.083 0.068 0.091 0.052 0.123 0.078 0.127 Education 0.110 0.154 -0.153 0.118 0.159 0.144 0.199 0.187 Constant -4.560*** -4.350*** -5.080*** -4.009*** -4.264*** -7.104*** -5.043*** -4.450** 0.743 1.591 0.773 1.403 0.961 1.978 0.690 1.962 Nb observations 328 248 262 214 349 251 168 134 Nb countries 94 67 77 62 93 66 43 35 Hansen 0.030 0.068 0.085 0.047 0.082 0.293 0.253 0.283 AR1 0.000 0.000 0.000 0.000 0.001 0.000 0.007 0.001 AR2 0.883 0.554 0.610 0.867 0.247 0.318 0.263 0.127 Estimator: GMM system
Dependent variable: logit of under-five survival rate
INS(GDP): Instability of per capita income, constant dollars, base year 2000.
INS(X): Instability of exports of goods and services, constant dollars, base year 2000. INS(AGRI): Instability of agricultural production per capita.
INS(Pw): Instability of international agricultural prices.
Instability is measured on each past and present period (on (t-1) and t). All variables are expressed in logarithms except instability
Periods: 1980-1984, 1985-1989, 1990-1994, 1995-1999
Standard errors, corrected for heteroskedasticity, appear below the coefficients. * significant at 10%, ** significant at 5%, *** significant at 1%
Table 7a : Marginal impact of "past instability"
INS(PIB) INS(X) INS(AGRI) INS(Pw)
Mean of U5S -0.0031 -0.0013 -0.0025 -0.0001 First quartile of U5S -0.0041 -0.0017 -0.0033 -0.0001 Second quartile of U5S -0.0028 -0.0012 -0.0022 -0.0001 Third quartile of U5S -0.0014 -0.0006 -0.0011 0.0000
calculated from results in columns 2, 4, 6, and 8 table 5
Table 7b : Marginal impact of "overall instability"
INS(PIB) INS(X) INS(AGRI) INS(Pw)
Mean of U5S -0.0074 -0.0016 -0.0047 -0.0012 First quartile of U5S -0.0098 -0.0021 -0.0064 -0.0016 Second quartile of U5S -0.0066 -0.0014 -0.0043 -0.0011 Third quartile of U5S -0.0034 -0.0008 -0.0021 -0.0005