HAL Id: hal-02940624
https://hal.sorbonne-universite.fr/hal-02940624
Submitted on 16 Sep 2020
HAL is a multi-disciplinary open access archive for the deposit and dissemination of sci-entific research documents, whether they are pub-lished or not. The documents may come from teaching and research institutions in France or abroad, or from public or private research centers.
L’archive ouverte pluridisciplinaire HAL, est destinée au dépôt et à la diffusion de documents scientifiques de niveau recherche, publiés ou non, émanant des établissements d’enseignement et de recherche français ou étrangers, des laboratoires publics ou privés.
in Parkinson’s disease from the EARLYSTIM Study
Pablo Martinez-Martin, Guenther Deuschl, Lisa Tonder, Alfons Schnitzler,
Jean-Luc Houeto, Lars Timmermann, Joern Rau, Carmen Schade-Brittinger,
Valerie Stoker, Marie Vidailhet, et al.
To cite this version:
Pablo Martinez-Martin, Guenther Deuschl, Lisa Tonder, Alfons Schnitzler, Jean-Luc Houeto, et al.. Interpretation of health-related quality of life outcomes in Parkinson’s disease from the EARLYSTIM Study. PLoS ONE, Public Library of Science, 2020, 15 (8), pp.e0237498. �10.1371/jour-nal.pone.0237498�. �hal-02940624�
RESEARCH ARTICLE
Interpretation of health-related quality of life
outcomes in Parkinson’s disease from the
EARLYSTIM Study
Pablo Martinez-Martin1☯*, Guenther Deuschl2☯, Lisa Tonder3☯, Alfons Schnitzler4‡, Jean-Luc Houeto5‡, Lars Timmermann6‡, Joern Rau7‡, Carmen Schade-Brittinger7‡,
Valerie Stoker3☯, Marie Vidailhet8‡, Paul Krack9☯, on behalf of the EARLYSTIM Study Group¶
1 Center for Networked Biomedical Research in Neurodegenerative Diseases (CIBERNED), Carlos III Institute of Health, Madrid, Spain, 2 Department of Neurology, UKSH, Kiel Campus Christian-Albrechts-University, Kiel, Germany, 3 Medtronic, Minneapolis, Minnesota, United States of America, 4 Department of Neurology, Institute of Clinical Neuroscience and Medical Psychology, Heinrich-Heine University Duesseldorf, Duesseldorf, Germany, 5 Department of Neurology, CIC-INSERM 1402, CHU of Poitiers, University of Poitiers, Poitiers, France, 6 Universita¨tsklinikum Giessen und Marburg, Marburg Campus, Marburg, Germany, 7 The Coordinating Center for Clinical Trials, Philipps University, Marburg, Germany,
8 Department of Neurology, Sorbonne Universite´ , ICM UMR1127, INSERM &1127, CNRS 7225, Salpêtriere University Hospital, AP-HP, Paris, France, 9 Department of Neurology, University Hospital Bern, University of Bern, Bern, Switzerland
☯These authors contributed equally to this work. ‡ These authors also contributed equally to this work.
¶ Membership of the EARLYSTIM Study Group is listed in the Acknowledgments.
*pmartinez@ciberned.es
Abstract
The EARLYSTIM Study compared deep brain stimulation (DBS) with best medical treat-ment (BMT) over 2-years, showing a between-group difference of 8.0 from baseline in favor of DBS in health-related quality of life (HRQoL), measured with the PDQ-39 SI (summary index). This study obtained complementary information about the importance of the change in HRQoL as measured by the PDQ-39, using anchor-based (Patient Global Impression of Change, PGIC) and distribution-based techniques (magnitude of change, effect size, thresholds, distribution of benefit) applied to the EARLYSTIM study data. Anchor-based techniques showed a difference follow-up–baseline for patients who reported “minimal improvement” of -5.8 [-9.9, -1.6] (mean [95%CI]) in the DBS group vs -2.9 [-9.0, 3.1] in the BMT group. As the vast majority (80.8%) of DBS patients reported “much or very much improvement”, this difference was explored for the latter group and amounted to -8.7 for the DBS group and -6.5 in the BMT group. Distribution-based techniques that analyzed the rela-tive change and treatment effect size showed a moderate benefit of the DBS on the HRQoL, whereas a slight worsening was observed in the BMT group. The change in the DBS group (-7.8) was higher than the MIC (Minimally Important Change) estimated value (-5.8 by the anchor; -6.3 by triangulation of thresholds), but not in the BMT (0.2 vs. -3.0 to -5.4, respec-tively). Almost 90% of the patients in the DBS group declared some improvement (58.3% and 56.7% beyond the estimated MIC), which was significantly different from the BMT group whose proportions were 32.0% and 30.3%, respectively. The number needed to treat
a1111111111 a1111111111 a1111111111 a1111111111 a1111111111 OPEN ACCESS
Citation: Martinez-Martin P, Deuschl G, Tonder L,
Schnitzler A, Houeto J-L, Timmermann L, et al. (2020) Interpretation of health-related quality of life outcomes in Parkinson’s disease from the EARLYSTIM Study. PLoS ONE 15(8): e0237498.
https://doi.org/10.1371/journal.pone.0237498
Editor: Ve´ronique Sgambato, CNRS, FRANCE Received: April 4, 2020
Accepted: July 27, 2020 Published: August 21, 2020
Copyright:© 2020 Martinez-Martin et al. This is an open access article distributed under the terms of theCreative Commons Attribution License, which permits unrestricted use, distribution, and reproduction in any medium, provided the original author and source are credited.
Data Availability Statement: Some restrictions
apply to data sharing of a de-identified data set and relate to the ethical responsibility of overseeing data use per the EARLYSTIM lead investigators (i.e. steering committee) charter. The clinical study data availability is regulated through the oversight and review of this EARLYSTIM steering committee. A potential deidentified data set may be provided after this review process and approval by the steering committee. Requests for data must be sent to the steering committee chairperson Guenther Deuschl (contact viag.
to improve�1 MIC by DBS vs BMT was 3.8. Change in depression, disability and pain influ-enced the improvement of the DBS group. DBS improved HRQoL in a high proportion of patients to a significant and moderate degree, at 2 years follow-up.
Introduction
Parkinson’s disease (PD) is a neurodegenerative disorder, second in prevalence after Alzhei-mer disease in population greater than 60 years, and the global burden of Parkinson’s disease has more than doubled with aging of the population and longer disease duration [1]. The semi-ology of PD includes characteristic motor manifestations (bradykinesia, rest tremor, rigidity, gait disturbances, and impairment of postural reflexes) and a variety of non-motor symptoms (e.g., sleep, mood, and autonomic disorders). Progression of the disease over time bears pro-gressive disability, physical and mental complications (e.g., dyskinesia, dementia), psychoso-cial malfunction, and potential personal finanpsychoso-cial loss. All these factors can impact on and severely deteriorate the patients’ health-related quality of life (HRQoL) [2–6].
HRQoL is a component of the global QoL and may be defined as “the perception and evalu-ation, by patients themselves, of the impact that the disease and its consequences have caused in their life” [7]. The main components of the construct HRQoL are: Physical symptoms, Men-tal symptoms (mood and cognition), Functional ability, and Social functioning [8,9]. Derived from traditions such as the health and social indicators, and designed and validated through psychometric theories, HRQoL measures are available. These measures can be classified as “generic”, usable in any condition or population, and “specific” for populations with specific characteristics, symptoms, condition, or dysfunctions. Generally biometrical presentation of results does not reflect the changes or statistical distribution-based views leading to limitations in understanding which changes matter to the patient. The information provided by the analy-sis and interpretation of the HRQoL measures provides relevant information about the impact of the disease, its course over time, priority areas to be attended, and effect of the interventions. Therefore, the perspective of the disease from the patients’ point of view is invaluable comple-mentary information for a clinical practice and research, as recognized by the regulatory agen-cies [10,11]. Measures used for HRQoL assessment in PD have been reviewed by an ad hoc Movement Disorder Society Task Force [12].
The EARLYSTIM Study was a prospective randomized study comparing subthalamic nucleus deep brain stimulation (DBS) with best medical treatment (BMT) to BMT alone over a 2-year follow-up. The primary endpoint was HRQoL as measured with the Parkinson’s Dis-ease Questionnaire-39 items (PDQ-39) [13–20]. The “positive” results of the EARLYSTIM Study favor the use of DBS in PD patients with early motor complications. Consequently, the Food and Drug Administration (FDA) approved in November 2015 the use of DBS in PD patients with “at least 4 years duration and with recent onset motor complications, or motor complications of longer- standing duration that are not adequately controlled with medica-tion”. The proposal of earlier intervention and the FDA approval, however, have not been free of criticisms [21–23].
In the pivotal paper of the EARLYSTIM study [14] the results of the primary endpoint focused on the difference (comparison) pre- post-intervention and the percentage of change.
We now address the clinical importance of the change, the relationships between change in the HRQoL and change in clinical aspects, and the proportion of patients experiencing a sig-nificant improvement by the intervention. Therefore, the objectives of this secondary analysis Wittenberg, the Vice-Director at the Coordinating
Center for Clinical Trials of the Philipps-University of Marburg (contact viamichael.wittenberg@kks. uni-marburg.de).
Funding: The study was funded by the German
Federal Ministry of Education and Research (Klinische Studien 01KG0502), French Programme Hospitalier de Recherche Clinique National (P050909) and Medtronic Inc. These specific funders had no role in study design, data collection, decision to publish or preparation of the manuscript, beyond the scientific roles of the two co-authors employed by Medtronic. This included L Tonder conducting analysis under the supervision of the PMM and V Stoker’s role was supervised by GD. The funder provided support in the form of salaries for authors (LT and VS) but did not have any additional role in the study design, data collection and analysis, decision to publish, or preparation of the manuscript. The specific roles of these authors are articulated in the ‘author contributions’ section.
Competing interests: The following authors have
declared no competing interests: J Rau, C Schade-Brittinger, M Vidailhet These authors have declared the following: P. Martinez-Martin has received honoraria from National School of Public Health (ISCIII), Britannia, and Editorial Viguera for lecturing in courses; International Parkinson and Movement Disorder Society (MDS) for management of the Program on Rating Scales; Bial, and Zambon for advice in
clinical-epidemiological studies. Financial support by MDS for attending the MDS International Congress 2019. Grant for Research: International Parkinson and Movement Disorder Society, for development and validation of the MDS-NMS. G. Deuschl has received lecture fees from Boston Scientific and has been serving as a consultant for Boston Scientific, Cavion, Functional Neuromodulation. He received royalties from Thieme publishers. He is a government employee and receives through his institution funding for his research from the German Research Council, the German Ministry of Education and Research and Medtronic. L. Tonder is employed by Medtronic Inc. A. Schnitzler AS received financial support from University of Kiel, during the study; has served as a consultant for Medtronic, Boston Scientific, St Jude Medical, and Gru¨nenthal; and has received lecture fees from Abbvie, Boston Scientific, St Jude Medical, Medtronic, UCB, MEDA Pharma, Teva Pharma, and GlaxoSmithKline. J-L Houeto has received research grant from Agence National de la Recherche, Association France Parkinson, and AbbVie and fees for lectures and consultancies from Medtronic,
were: (1) to determine a set of parameters that allow translation to a pragmatic and clear mean-ing (i.e. negligible, mild, moderate, important, or very important) for the HRQoL outcomes of the EARLYSTIM Study, and (2) to assess what modifications in the manifestations of the dis-ease were associated with changes in HRQoL.
Methods
Design
Post hoc secondary analysis of the EARLYSTIM data (baseline and 24 months).
Population
Cohort of PD patients included in the EARLYSTIM Study which has been succinctly described as PD patients under age 61 with mild levodopa-responsive PD (motor response �50%), Hoehn & Yahr stage �2.5, and preserved psychosocial competence who experienced levo-dopa-induced motor complications for no more than 3 years [13].
Assessments
The outcome assessments evaluated in this analysis were the following: Unified Parkinson’s Disease Rating Scale (UPDRS) sections II, III, and IV; a gait subscore derived from the UPDRS (sum of the scores from items 27, 28, 29, and 30), motor diary, VAS for Pain, Stark-stein’s Apathy Scale, Scales for Outcomes in Parkinson’s Disease-Psychosocial (SCOPA-PS) for psychosocial adjustment, Social- and Occupational Functioning Assessment Scale (SOFAS), Beck Depression Inventory. Clinical Global Impression of Change (CGIC) and Patient Global Impression of Change (PGIC) were also assessed (the latter considered more appropriate to compare with a patient-reported outcome), and HRQoL was evaluated with MOS Short Form 36 items (SF-36), and PDQ-39 Summary Index (PDQ-39 SI). Note, that an increase in the PDQ-39 SI value means HRQoL worsening whereas a decrease means improvement.
Ethics statement
The EARLYSTIM study conformed to the Declaration of Helsinki and all patients provided written informed consent before randomization. Permission was approved by the local ethics committees of all centers (Ethik-Kommission, Medizinische Fakulta¨t der Christian-Albrechts-Universita¨t zu Kiel, Kiel, Germany; Comite´ de Protection des Personnes, Ile de France IV, Hoˆpital Saint-Louis, Paris, France). The study was registered at ClinicalTrials.gov
(NCT00354133).
Analysis methods
This analysis used the data from the EARLYSTIM Study and focused on HRQoL outcomes interpretability. The variable of interest was the change observed in the PDQ-39 SI at a 24-month follow-up (FU).
Objective 1: Quantifying the meaning of HRQoL outcomes
1. Anchor-based method. The Minimally Important Change (MIC) has been defined in
many ways [24], but we will use the concept “the smallest difference in score that patients per-ceive as important”.
Zambon, AbbVie, and Lundbeck. L. Timmermann has received in the past year payments as a consultant for Boston Scientific, and honoraria as a speaker on symposia sponsored by UCB, Desitin, Boston Scientific, Abbott. The institution of L.T., not L.T. personally received funding by the German Research Foundation, the German Ministry of Education and Research and the Deutsche Parkinson Vereinigung V Stoker is employed by Medtronic, Inc P. Krack reports grants from Swiss National Science Foundation, Roger de Spoelberch Foundation, Bertarelli Foundation, Michael J Fox Foundation grants and personal fees from Boston Scientific, grants from Annemarie Opprecht Foundation Parkinson Schweiz, and Michael J Fox Foundation outside the submitted work. This competing interest statement does not alter our adherence to PLOS ONE policies on sharing data and materials.
In the present study, the patient global impression of change (PGIC) [25,26] was used as the anchor for estimation of the MIC, this patient-reported outcome is the most appropriate to compare with another patient-reported outcome of HRQoL. The MIC was determined by the change observed in those patients who declared to be “minimally improved” at follow-up [24,
27–29].
2. Distribution-based methods. This section refers to statistical techniques based on the
distribution of scores, in order to provide information enough from different quantitative sources without reference of the patients’ point of view. The following parameters, whose for-mulas are shown in the Supporting information (S1 Text), were calculated:
2.1. Magnitude of the change. Although there are not standard or threshold values for these
magnitudes, they furnish an intuitive approach to the importance of change (a higher change will be more important than a small one).
1. Intragroup difference follow-up (FU)-baseline. Negative figures reflect improvement and positive differences worsening, according to the PDQ-39 SI. This outcome is available in the primary study publication [14], but is shown here again for completeness.
2. Comparison of the magnitude of the difference FU-baseline inter-group [14].
3. Relative change or percentage of change (intragroup) [30] and inter-group comparison of proportions.
2.2. Effect size. Intra- and inter-group (paired and unpaired effect size, respectively) [31,
32].
2.3. Threshold values and triangulation. Comparison between the observed change and
some thresholds proposed as representative of the MIC value (intra-group):
1. Standard error of the difference (Sdiff), as an estimate of the measurement error of change
in longitudinal studies [33]. From this perspective, the Sdiff(as the standard error of
mea-surement, SEM) could be considered the threshold for a minimal important change [34,
35] in absence of the SEM, which could not be calculated due to the low number of stable patients at FU (n = 6).
2. Half a standard deviation at baseline [36,37].
Different methods usually offer different results. Therefore, the calculation of an average value (“triangulation”) theoretically approaching the true MIC has been proposed [38,39]. For this purpose, the values averaged were the anchor-based difference FU-baseline, the Sdiff, and
½ standard deviation at baseline.
3. Distribution of benefit.
3.1. Proportion of patients who improved � 1 MIC, according to the average value. 3.2. Cumulative distribution function of responses [11].
3.3. Number needed to treat (NNT) for having one patient improved �1 MIC comparing DBS vs BMT groups [40,41].
Objective 2: Changes of disease characteristics associated with HRQoL
changes
• Correlation (Spearman or Pearson coefficient) between change in the HRQoL scores and change in motor impairment, disability, mood, gait disorder, and social functioning were determined. Coefficient values �0.30 and �0.60 were considered as moderate and high cor-relation, respectively.
• Multiple regression analysis models were built to identify the reliability of the associations and their strength, with the change in HRQoL as dependent variable and the other changes (after exclusion of interaction and collinearity) as explanatory variables.
Results
At baseline, the PDQ-39 SI of the 124 patients in the DBS arm was 30.18±14.1 (mean±SD), whereas it was 30.20±14.2 in the BMT group (n = 127). At 24-month follow-up, 120 patients remained in the DBS arm, with a PDQ-39 SI score of 22.40±1.41 (-7.8±1.2; p<0.001), and 123 patients in the BMT branch, with PDQ-39 SI of 30.44±1.40 (0.2 ± 1.1; p = 0.84) (inter-group difference, p = 0.002).
Patient global impression of change
At FU, 120 with DBS and 122 BMT patients remained in the study and were evaluated with the PGIC. According to the PGIC, 107 (89.2%) patients in the DBS group reported improve-ment; 6 (5%) no change; and 7 (5.8%) worsening, whereas the corresponding values in the BMT group were 42 (34.4%), 10 (8.2%), and 70 (57.4%) (p<0.001). The distribution of the sample in the corresponding PGIC categories is shown in theTable 1. It is evident that for some categories, the small sample size conditions yield extremely wide (and not all that mean-ingful) confidence intervals.
Quantifying the meaning of health-related quality of life outcomes
Using the anchor-based method, the mean improvement in the group of patients who felt to be “minimally improved” with respect to the baseline was -5.8±5.8 (CI: [-9.9, -1.6]) in the DBS group vs -2.9±11.0 (CI: [-9.0, 3.1]) in the BMT group (p = 0.468).
Table 1shows the mean PDQ-changes and confidence intervals as related to the
PGIC-level. It is evident that the PDQ-39 SI change related to ‘much improved’ (-7.7± 14.1 for DBS and -4.8± 10.4 for BMT groups) and ‘very much improved’ (-10.1 ± 13.2 for DBS and -14.1± 9.9 for BMT groups) shows a gradation in which subjective level of improvement or worsening is associated with a stepwise change in HRQoL.
Table 1. Patient global impression and related mean PDQ-39 SI change from baseline to 24 months.
DBS BMT
Total n 120 122�
PGIC level† Number (%) Mean [95% CI] Number (%) Mean [95% CI] Very much worse 0 (0.0) -- 2 (1.6) 5.8 [-48.4, 60.1]
Much worse 3 (2.5) 14.8 [-11.4, 41.0] 26 (21.3) 9.9 [5.7, 14.1]
Minimally worse 4 (3.3) -8.5 [-39.5, 22.5] 42 (34.4) -0.7 [-3.8, 2.4]
No change 6 (5.0) -7.5 [-23.5, 8.6] 10 (8.2) 0.5 [-7.0, 8.0]
Minimally improved 10 (8.3) -5.8 [-9.9, -1.6] 15 (12.3) -2.9 [-9.0, 3.1]
Much improved 59 (49.2) -7.7 [-11.4, -4.1] 22 (18.0) -4.8 [-9.4, -0.1]
Very much improved 38 (31.7) -10.1 [-14.5, -5.8] 5 (4.1) -14.1 [-26.4, -1.9]
Much + Very much improved 97 (80.8) -8.7 [-11.4, -5.9] 27 (22.0) -6.5 [-10.8, -2.2] PGIC, Patient Global Impression of Change; CI, Confidence interval
�One BMT patient missing for the Patient Global Impression of Change.
† Categories of worse, no change, and improved are statistically significant between DBS vs. BMT (P<0.001). Note: Negative mean changes indicate improvement as compared with baseline.
In theTable 2, the results of the distribution-based analysis in both treatment groups are shown. There was an evident change of PDQ-39 SI scores towards improvement in the DBS group, whereas change in the BMT group was towards impairment and negligible. The effect size value was �0.60 (“moderate”), both for the DBS group and inter-group difference, and negligible (0.02) for BMT. In regard to the Minimally Improved group inTable 2the two threshold values (Sdiffand½ SDbaseline) were, respectively, 6.0 and 7.1 for both the DBS group
and the BMT group. Average of these values plus that obtained from the anchor in both groups produced a MIC estimate of 6.3 and 5.4 (in absolute values), respectively, indicating that the observed change (difference follow-up–baseline) was higher than the estimated MIC in the DBS group, but much lower in the BMT group.
The proportion of patients who minimally improved at least 1MIC in the DBS group was 58.3% (70/120), whereas only 32.0% (39/122) improved in the BMT group (p<0.0001)
(Table 2). Subsequently, the NNT to observe one patient improving the MIC or more was 1.7
for DBS and 3.1 for BMT. As most (80.8%) of the DBS patients were ‘much or very much improved’, similar calculations were carried out for these subjects, collapsed to a unique level
(Table 2). The MIC for this level ‘much or very much improved’ was 6.9 for DBS and it was
reached or surpassed by 56.7% (68/120) of subjects in this group, whereas it was 6.2 for BMT, achieved by 30.3% (37/122) of patients in this group (p<0.0001). The corresponding NNT were similar for ‘minimally improved or more’ and ‘much or very much improved” (1.7 vs 1.8 for the DBS group; 3.1 vs 3.3 for BMT). The NNT for DBS compared to BMT was 3.8
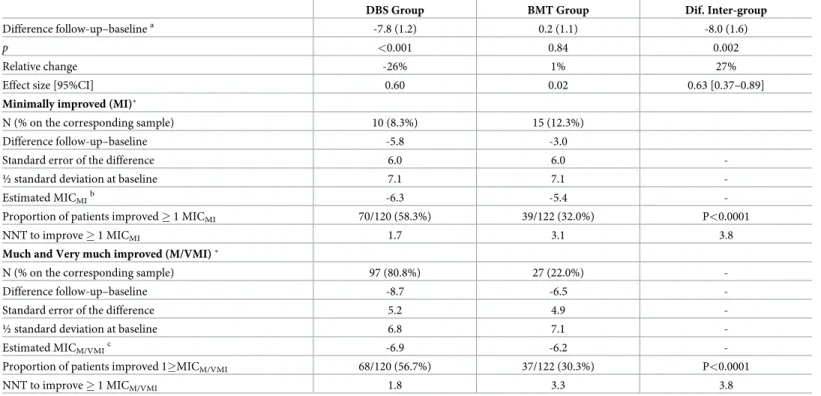
Table 2. Data for interpretation of change in the PDQ-39 SI.
DBS Group BMT Group Dif. Inter-group
Difference follow-up–baselinea -7.8 (1.2) 0.2 (1.1) -8.0 (1.6)
p <0.001 0.84 0.002
Relative change -26% 1% 27%
Effect size [95%CI] 0.60 0.02 0.63 [0.37–0.89]
Minimally improved (MI)�
N (% on the corresponding sample) 10 (8.3%) 15 (12.3%)
Difference follow-up–baseline -5.8 -3.0
Standard error of the difference 6.0 6.0
-½ standard deviation at baseline 7.1 7.1
-Estimated MICMIb -6.3 -5.4
-Proportion of patients improved � 1 MICMI 70/120 (58.3%) 39/122 (32.0%) P<0.0001
NNT to improve � 1 MICMI 1.7 3.1 3.8
Much and Very much improved (M/VMI)�
N (% on the corresponding sample) 97 (80.8%) 27 (22.0%)
-Difference follow-up–baseline -8.7 -6.5
-Standard error of the difference 5.2 4.9
-½ standard deviation at baseline 6.8 7.1
-Estimated MICM/VMIc -6.9 -6.2
-Proportion of patients improved 1�MICM/VMI 68/120 (56.7%) 37/122 (30.3%) P<0.0001
NNT to improve � 1 MICM/VMI 1.8 3.3 3.8
a
Mean (standard error) b
MICMI: Minimally important change for minimally improved. c
MICM/VMI: Minimally important change for much and very much improved.
�According to the Patient Global Impression of Change.
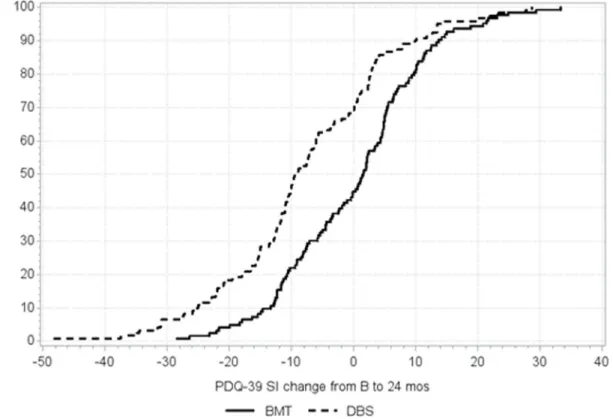
(Table 2).Fig 1shows the cumulative distribution function for both groups in the study, with more patients showing benefit of the respective MIC value in the DBS group.
Changes of disease characteristics associated health related quality of life
changes
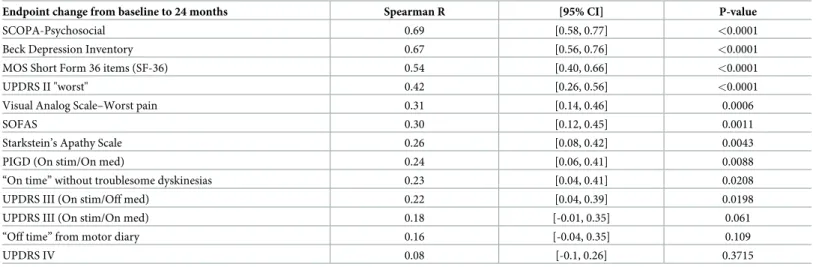
The change in the PDQ-39 SI was highly correlated with the improvement in psychosocial adjustment (SCOPA-PS) and depression (BDI), and a moderate association was found with the change in the activities of daily living (ADL, UPDRS II) and pain (VAS-Pain). The correla-tion was moderate/weak with SOFAS. Most of the classical motor parameters like UPDRS III in the worst or best condition, OFF-time or fluctuations and dyskinesia, were only weakly cor-related (Table 3).
Table 4shows the results of the regression model built to identify determinants of change
in QoL (PDQ-39 SI), which was the dependent variable. To this purpose, the independent vari-ables in the model were selected after discarding collinearity (intercorrelation coefficients
<0.75). Change in SCOPA-PS and SF-36 were not included due to their direct interaction
with the dependent variable, and "On time without troublesome dyskinesias" was discarded by potential interaction with UPDRS-IV.
Discussion
The EARLYSTIM Study showed a favorable outcome at FU in the primary endpoint, HRQoL measured with the PDQ-39 (improvement of 26%), in the group treated with DBS whereas the BMT group slightly worsened (1%) [14]. In this pivotal study, information about the effect of the intervention on HRQoL domains, UPDRS parts II to IV, psychosocial adjustment,
Fig 1. Cumulative distribution curves of PDQ-39 change from baseline to 24 months (1-cumulative %).
neuropsychiatric disorders, and levodopa-equivalent daily dose also showed a significant bene-ficial effect on these endpoints for the DBS group. However, neither the importance that the change in HRQoL entailed for the patient nor the relationship between this outcome and the change in the other variables in the study were explored. The present analysis was aimed, therefore, to investigate these gaps.
Objective 1
Two approaches are used for interpretation of change in patient-reported outcomes, in gen-eral, and HRQoL in particular: anchor-based and distribution-based methods [11,28,29]. The only finding of an anchor-based method we obtained was the difference baseline-FU for the group of patients who declared to be “minimally improved” (5.8 points for the DBS and 2.9 points for the BMT group). However, the number of patients in this situation was quite small (10 DBS and 15 BMT patients), representing 8.3% and 12.3% of the respective total samples (Table 1). These figures are insufficient for providing reliable information about the MIC, although they would indicate a significant benefit in the DBS group only
(Table 2). Given that most of DBS patients declared to be ‘much/very much improved’, the
same procedure that for ‘minimally improved’ category was performed for those patients, and the mean difference FU-baseline was -8.7 [-11.4, -5.9] in the DBS versus -6.5 [-10.8, -2.2] in the BMT group.
A variety of parameters with the distribution of score changes was subsequently calculated. Anchor-based methods are preferred [11,42] because they connect the concept measured by the patient-reported outcome with the anchor, making easy and reliable the interpretation of the outcome. Distribution-based methods, on the contrary, have not a connection with a directly interpretable measure and mainly provide information based on the magnitude of the change. This, however, exceeds the information of a merely ‘statistically significant difference’. Both approaches, anchor- and distribution-based methods, have advantages and disadvantages [28,39,42–44] (S1 Table).
Summarizing the results at FU of the distribution-based methods (Table 2):
Table 3. Correlations between change in PDQ-39 and change in other scales for the DBS group�.
Endpoint change from baseline to 24 months Spearman R [95% CI] P-value
SCOPA-Psychosocial 0.69 [0.58, 0.77] <0.0001
Beck Depression Inventory 0.67 [0.56, 0.76] <0.0001
MOS Short Form 36 items (SF-36) 0.54 [0.40, 0.66] <0.0001
UPDRS II "worst" 0.42 [0.26, 0.56] <0.0001
Visual Analog Scale–Worst pain 0.31 [0.14, 0.46] 0.0006
SOFAS 0.30 [0.12, 0.45] 0.0011
Starkstein’s Apathy Scale 0.26 [0.08, 0.42] 0.0043
PIGD (On stim/On med) 0.24 [0.06, 0.41] 0.0088
“On time” without troublesome dyskinesias 0.23 [0.04, 0.41] 0.0208
UPDRS III (On stim/Off med) 0.22 [0.04, 0.39] 0.0198
UPDRS III (On stim/On med) 0.18 [-0.01, 0.35] 0.061
“Off time” from motor diary 0.16 [-0.04, 0.35] 0.109
UPDRS IV 0.08 [-0.1, 0.26] 0.3715
SCOPA, Scales for Outcomes in Parkinson’s Disease; UPDRS, Unified Parkinson’s Disease Rating Scale; SOFAS, Social- and Occupational Functioning Assessment Scale; PIGD, Patient Global Impression of Change
�Coefficient values �0.30 and �0.60 were considered as moderate and high correlation, respectively.
1. The relative change and effect size showed a moderate benefit of DBS on HRQoL, whereas a slight impairment was observed in the BMT group.
2. The observed change (-7.8) was higher than the MIC estimated value for a minimal (-6.3) or even a better improvement (-6.9) in the DBS group, but not in the case of the BMT (0.2 vs. -5.4 and -6.2), respectively.
3. Almost 90% of the patients in the DBS group declared improvement (58.3% and 56.7% of them beyond the estimated MIC for this arm), whereas in the BMT group these proportions were 32.0% and 30.3%, respectively.
4. In both treatment groups there were patients declaring ‘much’ or ‘very much” improve-ment, but the proportions were significantly different (81% for DBS, 22% for BMT), as well as the proportion of patients who improved more than their respective minimal change for much and very much improved (56.7% for DBS, 30.3% for BMT).
5. The comparative NNT to improve �1 minimal change for much and very much improved by DBS vs BMT was 3.8.
According to these results at long-term, STN-DBS generated benefit in HRQoL in the vast majority of patients and such improvement was considerable in almost 60% of them (Fig 1). On the contrary, almost two thirds of patients on BMT were stable or worse at FU in the BMT group of patients.
Using a transition question as anchor, Peto et al. [45] carried out a postal survey with 728 responses (53.1% of the baseline sample) from members of the UK Parkinson’s Disease Soci-ety, at 6-month of the first evaluation with the PDQ-39. The mean change (impairment) in patients who declared to be “a little worse” (n = 192) was 1.60 (±8.89), with an effect size 0.10.
Fitzpatrick et al [33] determined by distribution-based methods (SEM and Sdiff) the
thresh-old for a real change and, next, compared these results to those from the anchor-based approach to explore the relationship between both methods. They found that one SEM values were relatively close to the MIC values obtained with the anchor-based, in turn usually smaller than the Sdiff. If SEM represents the minimal change beyond the measurement error, it
consti-tutes the lower threshold for considering a change as real and the Sdiff, which is higher than the
SEM, could be nearer of the MIC than the SEM (the limit of the “noise” by error). In the clini-cal sample of this study, eight patients declared improvement at follow-up (4 months), with a change in the PDQ-39 SI of– 2.15 (±6.62) points, whereas in 40 patients considered to be
Table 4. Model estimates from linear regression for the change in PDQ-39 SI.
Prob>F: P<0.0001 Parameter Estimate Standard Error t Value Pr > |t| Standardized Estimate Adjusted R2: 0.4679
Intercept 2.43 1.62 1.5 0.136 0
Beck Depression Inventory 0.791 0.15 5.12 <0.0001 0.411
UPDRS III (On stim/On med) 0.004 0.16 0.02 0.982 0.002
UPDRS II "worst" 0.647 0.18 3.63 0.0004 0.302
Visual Analog Scale—Worst pain 0.845 0.29 2.89 0.0047 0.226
UPDRS IV 0.064 0.32 0.2 0.844 0.015
Starkstein’s Apathy Scale 0.304 0.21 1.46 0.148 0.115
SOFAS -0.061 0.08 -0.76 0.448 -0.060
The independent variables represent the change observed in each of the listed scales UPDRS, Unified Parkinson’s Disease Rating Scale; SOFAS, Social- and Occupational Functioning Assessment Scale.
worse the change was 3.31 (±8.80). The Sdiffwas 5.39, clearly higher than the change observed,
and quite close to the Sdiffvalues found in the present analysis (6.0 for both arms). In the
pres-ent study, the SEM based on agreempres-ent (intraclass correlation coefficipres-ent of stable patipres-ents) [46] was not used due to the very small size of this group in both arms.
In another series of PD patients followed-up for one year by Martinez-Martin et al. [47], the sample tended to worsen and the SEM for the PDQ-39 SI was 4.26 (baseline) and 4.77 (fol-low-up). Horva´th et al. [48] found, through a transition question, a minimal clinically impor-tant difference (MCID) for improvement of– 4.72 points (–5.28 for patients with moderate; – 4.17 for patients with severe PD), effect size of 0.25, in a cohort of 365 PD patients in “regular care”, with a median of 4 follow-up visits at median intervals of 6-month intervals. The corre-sponding values for worsening in this study were: 4.22 points (moderate = 4.40; severe = 4.99), and effect size of 0.23. These MCID figures are very close to the SEM estimated by Martinez-Martin et al. [47] and agree with observations and proposals about the similarity between MID and SEM [34–36,43].
Holden et al. [49] also used a transition question, the Clinical Global impression of Change, and determine the MCID (improvement) in 90 patients with parkinsonism, after a palliative intervention clinical trial with six months follow-up. The absolute MCID obtained for the PDQ-39 (12.7), was considered valid by the authors for this kind of populations. Similar to our findings, a decrease in the PDQ-39 SI score was unexpectedly observed in patients with mini-mal worsening, a finding probably related with “the full spectrum of patient experience” [49] and expectations [50].
From the previous considerations, it is concluded that MIC varies with the populations, dis-ease severity, type of study (natural progression of disdis-ease vs. intervention), and length of the follow-up. Therefore, comparison with other studies performed in similar circumstances is not possible if these studies do not exist, like in the case with the EARLYSTIM study.
Concerning the effect size, most studies with conventional levodopa or dopamine agonists showed changes from 5–30% and weak to moderate effect sizes, whereas therapies for
advanced patients achieved 30–50% and moderate to large effect sizes [51–53]. Several reviews about the effect of the bilateral STN-DBS on the HRQoL, measured with the PDQ-39, found improvements of 19–34%, with effect sizes 0.60–0.80 [51,52,54]. Therefore, the results of the intervention in the present study, are in line with the published literature.
Objective 2
This analysis was performed to identify how the change in other variables captured in the study could be associated with the change in HRQoL. A close correlation was found with improvement in psychosocial adjustment and depression; moderate with improvement in the global HRQoL, activities in daily living, and pain; and a weak association was observed with the other variables (Table 3). According to the results of the multiple regression, the improve-ment in depression, functional state, and pain were independent and significant determinants of the change in HRQoL.
There are many factors associated with and able to influence the HRQoL of PD patients [2–
4,55–59]. Depression, disability, and pain are universal determinants of HRQoL, and they are very frequently present and combined in PD patients, causing a severe deterioration of their HRQoL. If these factors remain significantly improved at long-term after surgery, it would be expected that their improvement entailed a significant improvement in patients’ quality of life. Typically, patients have received DBS therapy due to motor complications. The current analy-sis as well as the data from the main study may prompt considerations about non-motor and quality-of-life aspects to become indication criteria for DBS. More studies are needed here.
Conclusions
From the previous discussion it may be concluded that DBS improved patients’ HRQoL in a significant and moderate degree, as a whole, over a two year follow up period. In this group, the beneficial effect was present in the vast majority of patients. These results are even more remarkable when compared to the BMT group, which tended to worsen their HRQoL over the observation time. MIC of the PDQ-39 SI for both populations in the study was determined by means of anchor- and distribution-based methods.
Supporting information
S1 Text. Applied distribution-based methods. Formulas.
(DOCX)
S1 Table. Advantages and disadvantages of the methods for interpretation of outcomes.
(DOCX)
Acknowledgments
Further members of the EARLYSTIM Study group
K. Knudsen, S. Paschen, J. Volkmann, D. Falk, M. Mehdorn—Departments of Neurology and Neurosurgery, University Hospital Schleswig–Holstein, Kiel, Germany. W.M Schu¨pbach, A. Hartmann, T.D. Ha¨lbig, H. Hesekamp, S.M. Navarro, N. Meier, Y. Agid—Assistance Publi-que–Hoˆpitaux de Paris, Centre d’Investigation Clinique 9503, Institut du Cerveau et de la Moelle E´pinière, De´partement de Neurologie et de Neurochirurgie, Universite´ Pierre et Marie Curie–Paris 6 and INSERM, Centre Hospitalier Universitaire Pitie´–Salpêtrière Paris, France. V. Fraix, E. Seigneuret, A. Kistner, P. Chaynes Departments of Neurology and Neurosurgery, University Hospital, INSERM Unite´ 836, Grenoble, France. C. Brefel-Courbon, F. Ory-Magne —Department of Neurology, Neurosurgery, and Pharmacology, University Hospital, Tou-louse, France. B. Bataille Department of Neurosurgery, Universite´ de Poitiers, Poitiers. P. Damier, S. Raoul—CIC, CHU Nantes, Nantes, France. T. Witjas, J.-M. Re´gis—Department of Functional Neurosurgery, Aix–Marseille University Marseille, France. S. Thobois, P. Mertens —Hoˆpital Neurologique Pierre Wertheimer, Department of Neurosurgery, University Hospi-tal Lyon, France. D Maltête- Department of Neurology, Rouen University HospiHospi-tal and Uni-versity of Rouen, France; D.Helwig, W.H. Oertel—Departments of Neurosurgery and Neurology, Philipps University, Marburg, Germany. F Sixel-Do¨ring- Paracelsus-Elena-Klinik Kassel, Germany. M. T. Barbe M. Maarouf, G.R. Fink Departments of Neurology and Neuro-surgery, University of Cologne, Cologne, Germany. A. Kuehn, A. Kupsch, D. Gruber, G.-H. Schneider—Departments of Neurology and Neurosurgery, Charite´ Campus Virchow Hospital, Berlin, Germany. L. Wojtecki, J. Vesper—Departments of Neurosurgery and Neurology, Hein-rich-Heine University, Duesseldorf, Germany. D. Weiss, A. Gharabaghi, R. Kru ¨ger—Depart-ment of Neurosurgery and Center of Neurology and Hertie Institute for Clinical Brain Research, University Hospital, Tuebingen, Germany. M Pinsker, F. Amtage Department of Neurology, University Hospital, Freiburg, Germany.
Author Contributions
Conceptualization: Pablo Martinez-Martin, Guenther Deuschl, Valerie Stoker, Paul Krack. Data curation: Guenther Deuschl, Alfons Schnitzler, Jean-Luc Houeto, Lars Timmermann,
Carmen Schade-Brittinger, Marie Vidailhet, Paul Krack.
Funding acquisition: Guenther Deuschl.
Methodology: Pablo Martinez-Martin, Lisa Tonder, Joern Rau, Paul Krack. Project administration: Valerie Stoker.
Supervision: Guenther Deuschl, Alfons Schnitzler, Jean-Luc Houeto, Lars Timmermann,
Car-men Schade-Brittinger, Marie Vidailhet, Paul Krack.
Writing – original draft: Pablo Martinez-Martin.
Writing – review & editing: Pablo Martinez-Martin, Guenther Deuschl, Lisa Tonder, Alfons
Schnitzler, Jean-Luc Houeto, Lars Timmermann, Joern Rau, Carmen Schade-Brittinger, Valerie Stoker, Marie Vidailhet, Paul Krack.
References
1. Global, regional, and national burden of Parkinson’s disease, 1990–2016: a systematic analysis for the Global Burden of Disease Study 2016. GBD 2016 Parkinson’s Disease Collaborators. Lancet Neurol. 2018; 17:939–953https://doi.org/10.1016/S1474-4422(18)30295-3PMID:30287051
2. Martinez-Martin P, Rodriguez-Blazquez C, Kurtis MM, Chaudhuri KR; NMSS Validation Group. The impact of non-motor symptoms on health-related quality of life of patients with Parkinson’s disease. Mov Disord. 2011; 26:399–406.https://doi.org/10.1002/mds.23462PMID:21264941
3. Soh SE, Morris ME, McGinley JL. Determinants of health-related quality of life in Parkinson’s disease: A systematic review. Parkinsonism Relat Disord. 2011; 17:1–9.https://doi.org/10.1016/j.parkreldis.2010. 08.012PMID:20833572
4. Martinez-Martin P, Rodriguez-Blazquez C, Forjaz MJ, et al. Relationship between the MDS- UPDRS domains and the health-related quality of life of Parkinson’s disease patients. Eur J Neurol. 2014; 21:519–524.https://doi.org/10.1111/ene.12349PMID:24447695
5. Balestrino R, Martinez-Martin P. Neuropsychiatric symptoms, behavioural disorders, and quality of life in Parkinson’s disease. J Neurol Sci. 2017; 373:173–178.https://doi.org/10.1016/j.jns.2016.12.060 PMID:28131182
6. Tu XJ, Hwang WJ, Ma HI, Chang LH, Hsu SP. Determinants of generic and specific health- related qual-ity of life in patients with Parkinson’s disease. PLoS One. 2017; 12:e0178896.https://doi.org/10.1371/ journal.pone.0178896PMID:28650957
7. Martinez-Martin P. An introduction to the concept of "quality of life in Parkinson’s disease". J Neurol. 1998; 245 (Suppl 1):S2–6.
8. Berzon R, Hays RD, Shumaker SA. International use, application and performance of health- related quality of life instruments. Qual Life Res. 1993; 2:367–368.https://doi.org/10.1007/BF00422214PMID: 8161974
9. Fitzpatrick R, Alonso J. Quality of life in health care: Concepts and components. In: Martinez- Martin P & Koller WC, eds. Quality of life in Parkinson’s disease. Masson S.A.: Barcelona, 1999; pp: 1–15. 10. Reflection paper on the regulatory guidance for the use of health-related quality of life (HRQL)
mea-sures in the evaluation of medicinal products. European Medicines Agency, London, UK, 2005. 11. Food and Drug Administration. Guidance for Industry Patient-Reported Outcome Measures: Use in
medical product development to support labeling claims. U.S. Department of Health and Human Ser-vices Food and Drug Administration, December 2009.
12. Martinez-Martin P, Jeukens-Visser M, Lyons KE, et al. Health-related quality-of-life scales in Parkin-son’s disease: critique and recommendations. Mov Disord. 2011; 26:2371–2380.https://doi.org/10. 1002/mds.23834PMID:21735480
13. Deuschl G, Schu¨pbach M, Knudsen K, et al. Stimulation of the subthalamic nucleus at an earlier dis-ease stage of Parkinson’s disdis-ease: concept and standards of the EARLYSTIM-study. Parkinsonism Relat Disord. 2013; 19:56–61.https://doi.org/10.1016/j.parkreldis.2012.07.004PMID:22841616 14. Schuepbach WM, Rau J, Knudsen K, et al. Neurostimulation for Parkinson’s disease with early motor
complications. N Engl J Med. 2013; 368:610–622.https://doi.org/10.1056/NEJMoa1205158PMID: 23406026
15. Deuschl G, Schade-Brittinger C, Agid Y; EARLYSTIM Study Group. Neurostimulation for Parkinson’s disease with early motor complications. N Engl J Med. 2013; 368:2038.
16. Sprenger FS, Seppi K, Wolf E, Poewe W. Relevance of EARLYSTIM in a tertiary movement disorders center. Mov Disord. 2014; 29:1220–1221.https://doi.org/10.1002/mds.25631PMID:24038441 17. Schu¨pbach WM, Rau J, Houeto JL, Krack P, Schnitzler A, Schade-Brittinger C, et al. Myths and facts
about the EARLYSTIM study. Mov Disord. 2014; 29:1742–1750.https://doi.org/10.1002/mds.26080 PMID:25399678
18. Dams J, Balzer-Geldsetzer M, Siebert U, et al. Cost-effectiveness of neurostimulation in Parkinson’s disease with early motor complications. Mov Disord. 2016; 31:1183–1191.https://doi.org/10.1002/mds. 26740PMID:27506638
19. Lhomme´ e E, Wojtecki L, Czernecki V, et al. Behavioural outcomes of subthalamic stimulation and medi-cal therapy versus medimedi-cal therapy alone for Parkinson’s disease with early motor complications (EAR-LYSTIM trial): secondary analysis of an open-label randomised trial. Lancet Neurol. 2018; 17:223–231. https://doi.org/10.1016/S1474-4422(18)30035-8PMID:29452685
20. Schuepbach WMM, Tonder L, Schnitzler A, et al. Quality of life predicts outcome of deep brain stimula-tion in early Parkinson disease. Neurology. 2019; 92(10):e1109–e1120.https://doi.org/10.1212/WNL. 0000000000007037PMID:30737338
21. Mestre TA, Espay AJ, Marras C, Eckman MH, Pollak P, Lang AE. Subthalamic nucleus-deep brain stim-ulation for early motor complications in Parkinson’s disease: the EARLYSTIM trial: early is not always better. Mov Disord 2014; 29:1751–1756.https://doi.org/10.1002/mds.26024PMID:25227325 22. Sperens M, Hamberg K, Hariz GM. Are Patients Ready for "EARLYSTIM"? Attitudes towards Deep
Brain Stimulation among Female and Male Patients with Moderately Advanced Parkinson’s Disease. Parkinsons Dis. 2017; 2017:1939831.https://doi.org/10.1155/2017/1939831PMID:28458943 23. Cabrera LY, Goudreau J, Sidiropoulos C. Critical appraisal of the recent US FDA approval for earlier
DBS intervention. Neurology. 2018; 91:133–136.https://doi.org/10.1212/WNL.0000000000005829 PMID:29898975
24. King MT. A point of minimal important difference (MID): a critique of terminology and methods. Expert Rev Pharmacoecon Outc Res 2011; 11:171–184.
25. Fischer D, Stewart AL, Bloch DA, Lorig K, Laurent D, Holman H. Capturing the patient’s view of change as a clinical outcome measure. JAMA. 1999; 282(12):1157–62.https://doi.org/10.1001/jama.282.12. 1157PMID:10501119
26. Forkmann T, Scherer A, Boecker M, Pawelzik M, Jostes R, Gauggel S. The Clinical Global Impression Scale and the influence of patient or staff perspective on outcome. BMC Psychiatry. 2011; 11:83. https://doi.org/10.1186/1471-244X-11-83PMID:21569566
27. Jaeschke R., Singer J., & Guyatt G. H. Measurement of health status. Ascertaining the minimal clinically important difference. Contr Clin Trials 1989; 10:407–415.
28. Crosby RD, Kolotkin RL, Williams GR. Defining clinically meaningful change in health-related quality of life. J Clin Epidemiol 2003; 56: 395–407.https://doi.org/10.1016/s0895-4356(03)00044-1PMID: 12812812
29. Wyrwich KW, Norquist JM, Lenderking WR, Acaster S; Industry Advisory Committee of International Society for Quality of Life Research (ISOQOL). Methods for interpreting change over time in patient-reported outcome measures. Qual Life Res. 2013; 22:475–483.
30. Deyo RA, Centor RM. Assessing the responsiveness of functional scales to clinical change: an analogy to diagnostic test performance. J Chronic Dis. 1986; 39: 897–906.https://doi.org/10.1016/0021-9681 (86)90038-xPMID:2947907
31. Nakagawa S, Cuthill IC. Effect size, confidence interval and statistical significance: a practical guide for biologists. Biol Rev Camb Philos Soc. 2007; 82: 591–605.https://doi.org/10.1111/j.1469-185X.2007. 00027.xPMID:17944619
32. Lakens D. Calculating and reporting effect sizes to facilitate cumulative science: a practical primer for t-tests and ANOVAs. Front Psychol. 2013; 4: 863.https://doi.org/10.3389/fpsyg.2013.00863PMID: 24324449
33. Fitzpatrick R, Norquist JM, Jenkinson C. Distribution-based criteria for change in health-related quality of life in Parkinson’s disease. J Clin Epidemiol. 2004; 57: 40–44.https://doi.org/10.1016/j.jclinepi.2003. 07.003PMID:15019009
34. Wyrwich KW, Tierney WM, Wolinsky FD. Further evidence supporting an SEM-based criterion for iden-tifying meaningful intra-individual changes in health-related quality of life. J Clin Epidemiol 1999; 52:861–873.https://doi.org/10.1016/s0895-4356(99)00071-2PMID:10529027
35. Rejas J, Pardo A, Ruiz MA. Standard error of measurement as a valid alternative to minimally important difference for evaluating the magnitude of changes in patient-reported outcomes measures. J Clin Epi-demiol. 2008; 61: 350–356.https://doi.org/10.1016/j.jclinepi.2007.05.011PMID:18313559
36. Norman GR, Sloan JA, Wyrwich KW. Interpretation of changes in health-related quality of life: the remarkable universality of a half a standard deviation. Med Care 2003; 41:582–592.https://doi.org/10. 1097/01.MLR.0000062554.74615.4CPMID:12719681
37. Sloan JA, Cella D, Hays RD, RAND. Clinical significance of patient-reported questionnaire data: another step toward consensus. J Clin Epidemiol 2005; 58:1217–1219.https://doi.org/10.1016/j. jclinepi.2005.07.009PMID:16291464
38. Bowling A. 2002. Research Methods in Health: Investigating Health and Health Services Research. Buckingham, UK: Open University Press. Pp. 202
39. Revicki D, Hays RD, Cella D, Sloan J. Recommended methods for determining responsiveness and minimally important differences for patient-reported outcomes. J Clin Epidemiol. 2008; 61:102–109. https://doi.org/10.1016/j.jclinepi.2007.03.012PMID:18177782
40. Norman GR, Sridhar FG, Guyatt GH, Walter SD. Relation of distribution- and anchor-based approaches in interpretation of changes in health-related quality of life. Med Care. 2001; 39:1039–47.https://doi. org/10.1097/00005650-200110000-00002PMID:11567167
41. Wyrwich KW, Bullinger M, Aaronson N, et al. Estimating clinically significant differences in quality of life outcomes. Qual Life Res 2005; 14:285–295.https://doi.org/10.1007/s11136-004-0705-2PMID: 15892420
42. de Vet HC, Terwee CB, Ostelo RW, Beckerman H, Knol DL, Bouter LM. Minimal changes in health sta-tus questionnaires: distinction between minimally detectable change and minimally important change. Health Qual Life Outcomes. 2006; 4:54.https://doi.org/10.1186/1477-7525-4-54PMID:16925807 43. Turner D, Schu¨nemann HJ, Griffith LE, Beaton DE, Griffiths AM, Critch JN, et al. The minimal
detect-able change cannot reliably replace the minimal important difference. J Clin Epidemiol. 2010; 63(1):28– 36.https://doi.org/10.1016/j.jclinepi.2009.01.024PMID:19800198
44. Martinez-Martin P, Kurtis MM. Health-related quality of life as an outcome variable in Parkinson’s dis-ease. Ther Adv Neurol Disord. 2012; 5(2):105–17.https://doi.org/10.1177/1756285611431974PMID: 22435075
45. Peto V, Jenkinson C, Fitzpatrick R. Determining minimally important differences for the PDQ-39 Parkin-son’s disease questionnaire. Age Ageing. 2001; 30(4):299–302.https://doi.org/10.1093/ageing/30.4. 299PMID:11509307
46. de Vet HC, Terwee CB, Knol DL, Bouter LM. When to use agreement versus reliability measures. J Clin Epidemiol. 2006; 59(10):1033–9.https://doi.org/10.1016/j.jclinepi.2005.10.015PMID:16980142 47. Martı´nez-Martin P, Carod-Artal FJ, da Silveira Ribeiro L, Ziomkowski S, Vargas AP, Kummer W, et al.
Longitudinal psychometric attributes, responsiveness, and importance of change: An approach using the SCOPA-Psychosocial questionnaire. Mov Disord. 2008; 23(11):1516–23.https://doi.org/10.1002/ mds.22202PMID:18649392
48. Horva´th K, Aschermann Z, Kova´cs M, Makkos A, Harmat M, Janszky J, et al. Changes in quality of life in Parkinson’s disease: How large must they be to be relevant? Neuroepidemiology. 2017; 48(1–2):1–8. https://doi.org/10.1159/000455863PMID:28161701
49. Holden SK, Koljack CE, Prizer LP, Sillau SH, Miyasaki JM, Kluger BM. Measuring quality of life in pallia-tive care for Parkinson’s disease: A clinimetric comparison. Parkinsonism Relat Disord. 2019; 65: 172– 177.https://doi.org/10.1016/j.parkreldis.2019.06.018PMID:31253494
50. Reddy P, Martinez-Martin P, Brown RG, Chaudhuri KR, Lin JP, Selway R, et al. Perceptions of symp-toms and expectations of advanced therapy for Parkinson’s disease: preliminary report of a Patient-Reported Outcome tool for Advanced Parkinson’s disease (PRO-APD). Health Qual Life Outcomes. 2014; 12: 11.https://doi.org/10.1186/1477-7525-12-11PMID:24460704
51. Martinez-Martin P, Deuschl G. Effect of medical and surgical interventions on health-related quality of life in Parkinson’s disease. Mov Disord. 2007; 22(6):757–65.https://doi.org/10.1002/mds.21407PMID: 17343275
52. Martinez-Martin P. Cua´nto ha mejorado la calidad de vida de los pacientes con enfermedad de Parkin-son?. Rev Esp Trast Mov 2014; 6: 14–21.
53. Martinez-Martin P, Rodriguez-Blazquez C, Forjaz MJ, Kurtis MM. Impact of pharmacotherapy on quality of life in patients with Parkinson’s disease. CNS Drugs. 2015; 29(5):397–413.https://doi.org/10.1007/ s40263-015-0247-xPMID:25968563
54. Kleiner-Fisman G, Herzog J, Fisman DN, Tamma F, Lyons KE, Pahwa R, et al. Subthalamic nucleus deep brain stimulation: summary and meta-analysis of outcomes. Mov Disord. 2006; 21 Suppl 14: S290–304.
55. Damiano AM, Snyder C, Strausser B, Willian MK. A review of health-related quality-of-life concepts and measures for Parkinson’s disease. Qual Life Res.; 8(3):235–43.https://doi.org/10.1023/
56. Schrag A, Jahanshahi M, Quinn N. What contributes to quality of life in patients with Parkinson’s dis-ease? J Neurol Neurosurg Psychiatry. 2000; 69(3):308–12.https://doi.org/10.1136/jnnp.69.3.308 PMID:10945804
57. Carod-Artal FJ, Vargas AP, Martinez-Martin P. Determinants of quality of life in Brazilian patients with Parkinson’s disease. Mov Disord. 2007; 22(10):1408–15.https://doi.org/10.1002/mds.21408PMID: 17516479
58. Soh SE, McGinley JL, Watts JJ, Iansek R, Murphy AT, Menz HB, et al. Determinants of health-related quality of life in people with Parkinson’s disease: a path analysis. Qual Life Res. 2013; 22(7):1543–53. https://doi.org/10.1007/s11136-012-0289-1PMID:23070750
59. Wu Y, Guo XY, Wei QQ, Song W, Chen K, Cao B, et al. Determinants of the quality of life in Parkinson’s disease: results of a cohort study from Southwest China. J Neurol Sci. 2014;15; 340(1–2):144–9. https://doi.org/10.1016/j.jns.2014.03.014PMID:24679837