HAL Id: inserm-00383725
https://www.hal.inserm.fr/inserm-00383725
Submitted on 13 May 2009
HAL is a multi-disciplinary open access archive for the deposit and dissemination of sci-entific research documents, whether they are
pub-L’archive ouverte pluridisciplinaire HAL, est destinée au dépôt et à la diffusion de documents scientifiques de niveau recherche, publiés ou non,
Drug-drug interaction predictions with PBPK models
and optimal multiresponse sampling time designs:
application to midazolam and a phase I compound. Part
2: clinical trial results.
Marylore Chenel, François Bouzom, Fanny Cazade, Kayode Ogungbenro, Leon Aarons, France Mentré
To cite this version:
Marylore Chenel, François Bouzom, Fanny Cazade, Kayode Ogungbenro, Leon Aarons, et al.. Drug-drug interaction predictions with PBPK models and optimal multiresponse sampling time designs: application to midazolam and a phase I compound. Part 2: clinical trial results.. Journal of Phar-macokinetics and Pharmacodynamics, Springer Verlag, 2008, 35 (6), pp.661-81. �10.1007/s10928-008-9105-5�. �inserm-00383725�
Drug-Drug Interaction Predictions with PBPK models and
Optimal Multiresponse Sampling Time Designs:
Application to Midazolam and a phase I compound.
Part 2: Clinical trial results
Marylore Chenel
1, François Bouzom
2, Fanny Cazade
1, Kayode
Ogungbenro
3,4, Leon Aarons
3,4, France Mentré
51Institut de Recherches Internationales Servier, 6 place des Pléiades, 92415 Courbevoie Cedex, France. 2Technologie Servier, 27 rue Eugene Vignat, BP 11749, 45007 Orléans Cedex 1, France. 3School of
Pharmacy and Pharmaceutical Sciences, University of Manchester, Oxford road, Manchester, M13 9PL, United Kingdom. 4Centre for Applied Pharmacokinetic Research, University of Manchester, United
Kingdom. 5 INSERM, U738, Paris, France; University Paris Diderot, Paris, France.
*Correspondance to: Marylore Chenel
Institut de Recherches Internationales Servier, 6, place des Pléiades
92415 Courbevoie Cedex, France
Email adresses: marylore.chenel@fr.netgrs.com, marylore_chenel@hotmail.com
KEY WORDS: Optimal multiresponse experimental design; midazolam; physiologically
ABSTRACT
Purpose. To compare results of population PK analyses obtained with a full empirical
design (FD) and an optimal sparse design (MD) in a Drug-Drug Interaction (DDI) study aiming to evaluate the potential CYP3A4 inhibitory effect of a drug in development, SX, on a reference substrate, midazolam (MDZ). Secondary aim was to evaluate the interaction of SX on MDZ in the in vivo study.
Methods. To compare designs, real data were analysed by population PK modelling using
either FD or MD with NONMEM FOCEI for SX and with NONMEM FOCEI and MONOLIX SAEM for MDZ. When applicable a Wald’s test was performed to compare model parameter estimates, such as apparent clearance (CL/F), across designs. To conclude on the potential interaction of SX on MDZ PK, a Student paired test was applied to compare the individual PK parameters (i.e. log(AUC) and log(Cmax)) obtained
either by a non-compartmental approach (NCA) using FD or from empirical Bayes estimates (EBE) obtained after fitting the model separately on each treatment group using either FD or MD.
Results. For SX, whatever the design, CL/F was well estimated and no statistical
differences were found between CL/F estimated values obtained with FD (CL/F = 8.2 L/h) and MD (CL/F = 8.2 L/h). For MDZ, only MONOLIX was able to estimate CL/F and to provide its standard error of estimation with MD. With MONOLIX, whatever the design and the administration setting, MDZ CL/F was well estimated and there were no statistical differences between CL/F estimated values obtained with FD (72 L/h and 40 L/h for MDZ alone and for MDZ with SX, respectively) and MD (77 L/h and 45 L/h for
MDZ alone and for MDZ with SX, respectively). Whatever the approach, NCA or population PK modelling, and for the latter approach, whatever the design, MD or FD, comparison tests showed that there was a statistical difference (p<0.0001) between individual MDZ log(AUC) obtained after MDZ administration alone and co-administered with SX. Regarding Cmax, there was a statistical difference (p<0.05) between individual
MDZ log(Cmax) obtained under the 2 administration settings in all cases, except with the
sparse design with MONOLIX. However, the effect on Cmax was small. Finally, SX was
shown to be a moderate CYP3A4 inhibitor, which at therapeutic doses increased MDZ exposure by a factor 2 in average and almost did not affect the Cmax.
Conclusion. The optimal sparse design enabled the estimation of CL/F of a CYP3A4
substrate and inhibitor when co-administered together and to show the interaction leading to the same conclusion than the full empirical design.
INTRODUCTION
Metabolic drug-drug interactions (DDIs) have recently led to prescribing restrictions, non-approval of drugs and withdrawal from the market by regulatory agencies (1, 2). Thus, the evaluation of the potential risk of metabolic DDI is of high importance within the pharmaceutical industry in order to improve safety but also reduce the attrition rate of new drugs. According to the guidance for industry from the Food and Drug Administration (FDA) (3) dealing with drug interaction studies (Study Design, Data Analysis and Implications for Dosing and Labeling), “ (…) drug development should follow a sequence in which early in vitro and in vivo investigations can either fully address a question of interest or provide information to guide further studies. Optimally, a sequence of studies could be planned, moving from in vitro studies to in vivo human studies, including those employing special study designs and methodologies where appropriate. Indeed, in many cases, negative findings from early in vitro and early clinical studies allow to eliminate the need for later clinical investigations”. In this context, the aim of this work was to evaluate a global strategy to design early clinical DDI studies using only early in vitro study results.
Based on early in vitro study results, a DDI study was planned to evaluate the potential inhibitory effect of a phase I compound from Servier research (called SX in the present paper) on a reference CYP3A4 substrate, midazolam (MDZ). At this stage of SX development, only in vitro information was available regarding the potential DDI and the goal for the pharmacokinetic (PK) department was to determine the design of the in vivo
To achieve this goal, a global approach including physiologically based pharmacokinetic (PBPK) model predictions, population PK modelling and multiresponse optimal design, was applied to advise an optimal sampling time schedule. Methods and results from this study are presented in a joint paper (4). A full empirical design (FD) in which the optimal sampling times were included was used in the clinical trial. The FD contained 11 and 13 sampling times for MDZ and SX, respectively, whereas the MD had only 5 joint sampling times for both drugs.
To evaluate if this global approach could be applied in drug development, the main objective of the present work was to analyse real data by population PK modelling using either FD or MD and then to compare population PK parameters between the two designs. Secondary objectives were to evaluate the potential metabolism interaction of SX on MDZ, and to compare observations to PBPK predictions.
MATERIAL AND METHODS
Study design of the DDI clinical trial
The study was conducted in 12 Caucasian male healthy volunteers aged between 18 and 40 years (inclusive), with a weight between 50 kg and 100 kg and a Body Mass Index (BMI) less than or equal to 28 kg/m² (BMI= Weight (kg)/Height2 (m2)). All subjects gave
informed written consent to participate in the study.
Subjects were hospitalized in the clinical unit from the morning of day 0 (D0) to the morning of D8 remaining under permanent medical and nursing supervision. Treatments prohibited in the 4 weeks before inclusion and during the study were any treatment which could lead to induction or inhibition of hepatic microsomial enzymes P450 3A4 (such as ketoconazole and other antifungal azole derivatives, macrolides antibiotics, cisapride, cimetidine, omeprazole, tricyclic antidepressant drugs, sildenafil, phenobarbital). Grapefruit consumption (juice or fruit) was stopped at least 2 weeks before inclusion of subjects and during the study.
Before drug administration, the subjects were fasting since the previous evening. Study drugs were administered with a standard glass of still water (180 ml) and a standard meal was allowed no sooner than 2 hours after drug administration.
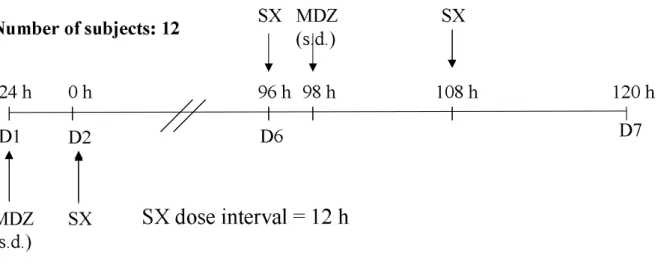
On D1, the 12 subjects received a single dose of MDZ (7.5 mg, per os) in order to assess its PK after administration of MDZ alone. From D2, SX was administered twice a day to reach approximately steady-state (SS) at D6 (96 h after first SX dose). On D6, 2 hours after the first daily dose of SX, a single dose of MDZ (7.5 mg, po) was administered in order to reach maximal concentrations (Cmax) at the same time for both compounds. SX
was administered once again on D6, 12h after the morning SX dose (Study design schema in Fig. 1).
For PK assessment of MDZ, the sampling times were as follows: on D1, prior to MDZ administration (H0) and 15min, 30min, 1h, 2h, 3h, 4h, 5h30min, 8h30min, 10h30min, 12h30min and 22h after D1 MDZ administration; on D6, the sampling times were the same as those on D1. This full sampling design with 11 sampling times (without taking into account the predose sample) each day was called MDZ FD.
For PK assessment of SX, the sampling times were as follows: on D6, prior to the first daily dose of SX (H0) and 40min, 1h, 2h, 2h15min, 2h30min, 3h, 4h, 5h, 6h, 7h30min, 10h30min and 12h after D6 morning SX administration, and then 30min, 40min, 2h30min, 4h, 6h, 7h30min and 12h after the second daily dose of SX. This full sampling design with 13 sampling times (including the predose sample) over the first daily dose interval was called SX FD. Amongst these 13 sampling times, 8 were the same as those of MDZ FD.
A multiresponse optimal design approach has been previously performed (4) to determine joint optimal sampling times for both MDZ and SX. Thus, among the sampling times of the full sampling design, the 5 joint optimal sampling times each day determined previously by a multiresponse design approach were as follows: on D1, 15min, 1h, 5h30min, 10h30min and 22h after D1 MDZ administration; on D6, 2h15min, 3h, 7h30min, 12h30min and 24h after the
first daily dose of SX, which corresponds to15min, 1h, 5h30min, 10h30min and 22 h after D6 MDZ administration.
Thus, for MDZ, the 5 optimal sampling times were the same over the 2 periods (D1 and D6), and by definition they were the same for SX on D6. This optimal sparse sampling time design was denoted MD (for multiresponse design) throughout the paper.
Population PK modelling
To analyze observed data of the clinical trial by population PK modelling, models previously developed from PBPK simulations were directly applied and PK model parameters were estimated. See the first part of this work (4) for the details about building and evaluation of the population PK models built from PBPK simulated data. Briefly, the SX population PK model was a two-compartment model with a first-order absorption constant (ka) which was fixed. Estimated fixed-effect parameters were the
apparent elimination clearance (CL/F), the apparent central compartment volume (Vc/F),
the apparent distribution clearance (Q/F) and the apparent peripheral volume (Vp/F).
Exponential random-effects were added on all fixed-effect parameters to describe inter-individual variability (IIV) and a correlation between the random variables of CL/F and Vc/F was estimated. The residual error model was a combined (additive and proportional)
error model in which the additive part was fixed. SX parameter estimates from PBPK simulations are in the Table VIII of the first part of this work (4).
For MDZ the population PK model was a two-compartment model with a zero-order absorption constant. Estimated fixed-effect parameters were CL/F, Vc/F, Q/F, Vp/F and the duration of the absorption (Tk0). Exponential random-effects were added on all
fixed-effect parameters to describe IIV and a correlation between the random variables of CL/F and Vc/F was estimated. The residual error model was a combined (additive and proportional) error model in which the additive part was fixed. MDZ parameter estimates from PBPK simulations are in Table IX of the first part of this work (4).
The population PK models were applied separately to fit SX and MDZ observed concentration-time profiles obtained in the clinical trial from either FD or MD. For MDZ, the MDZ model was applied to observed PK data of both administration settings (without and with SX co-administration) but each occasion was analysed separately. Population PK parameters were estimated using NONMEM (5) with the FOCEI (First Order Conditional Estimation with Interaction) method. When, the minimization was not successful or when the covariance step was not obtained in NONMEM with FOCEI, population PK parameters were estimated using MONOLIX version 2.1 with the SAEM (Stochastic Approximation version of the Expectation Maximization algorithm) method. MONOLIX (www.monolix.org) is a new software dedicated to the analysis of non-linear mixed effect models developed by Lavielle and Mentré (6). The algorithm used in this software combines the SAEM algorithm with a Markov Chain Monte Carlo procedure. The convergence of this algorithm and its good statistical properties have been proven and published (7, 8, 9, 10). The algorithm is fast and efficient and converges in situations
where other reference methods (including NONMEM) do not. It has already been used with success for different PK and PK/PD (Pharmacodynamic) applications (6, 11).
SX and MDZ population PK parameter estimates obtained with MD were compared statistically to those obtained with FD using a Wald test (p<0.05). For each parameter, we tested whether the difference between the estimates obtained with each design, FD and MD, was statistically significant using the following Wald statistic (12):
( )
FD 2( )
MD 2 MD FD SE SE w ψ ψ ψ ψ + − = (Equation 1)where ψFD and ψMD are the population PK estimates obtained using FD and MD,
respectively, and, SE(ψFD) and SE(ψMD) are the standard error of estimation of the
corresponding population PK parameter using FD and MD, respectively. Asymptotically, maximum likelihood estimators follow a normal distribution. Therefore, under H0 (null hypothesis), w should follow a normal distribution with a mean equals to 0 and a variance equals to 1 (N(0,1)) and can be compared to the corresponding critical value of a N(0,1). Individual empirical Bayes estimates (EBEs) of the MDZ PK parameters were derived from the results in each group independently i.e. for each administration setting, for each design and for each estimation method.
Non-compartmental analysis from full design
Based on the MDZ and SX individual concentration-time profiles obtained in the clinical trial with the FD, a non-compartmental approach (NCA) analysis was performed using
the method described in the first part of this work (4). PK parameters were calculated for each subject, under each administration setting for MDZ (alone or co-administered with SX), and for SX after the two SX administrations at D6 (dose interval=12h). Calculated parameters are the maximal concentration (Cmax), the area under the curve of
concentrations over the dose interval (AUCτ) for SX and the area under the curve between 0 and the infinity (AUC) for MDZ. Results are expressed as median [minimum-maximum] values.
The NCA analysis was performed with WinNonlin® Professional version 3.3 and SAS
version 8.
Analysis of the potential metabolism interaction: comparison tests
To study the interaction of SX on MDZ, comparison tests were performed to test the difference between MDZ individual PK parameters (i.e. AUC and Cmax) obtained after
administration of MDZ alone and when co-administered with SX. The Student paired test with n-1 degrees of freedom is the usual test for the comparison between the two groups of the mean of log(AUC) estimated by NCA. As described by Panhard and Mentré (13, 14), this test can also be applied to compare the mean log(AUC) between the two treatment arms estimated from the individual EBE after fitting the population model separately on each treatment group. AUC are derived from CL/F by AUC= D/CL/F where D is the dose. Therefore, the Student paired test was applied to compare the log(AUC) between the two treatment groups (MDZ alone and MDZ co-administered with SX) obtained by NCA using FD but also by population PK modelling using either FD or MD.
In the same way, Student paired tests were applied to compare the log(Cmax) between the
two treatment groups for each approach. In the population PK modelling approach, individual Cmax were obtained by simulation (step of 0.1h for time interval).
90% confidence intervals (CI) of geometric means were computed for MDZ AUC and Cmax ratios (AUCMDZ+SX/ AUCMDZ and Cmax MDZ+SX/ Cmax MDZ) obtained either by NCA or
by population PK modelling.
Comparison of in vivo results with PBPK predictions
PBPK predictions described in the first part of this work (4) were compared with in vivo
concentration-time profiles observed in the clinical trial. Firstly, for both compounds, MDZ and SX, at D1 for MDZ only and D6 for both drugs, median, 5th and 95th
percentiles of PBPK simulated concentration-time profiles were computed and compared graphically to observed concentration-time data obtained in the clinical trial.
Secondly, PK parameters previously computed from PBPK predictions by NCA (4) were compared to PK parameters obtained by NCA of the in vivo concentrations-time profiles observed in the clinical trial. For in vivo data analysis, observed AUC and Cmax inhibition
ratios (AUCMDZ+SX/ AUCMDZ and Cmax MDZ+SX/ Cmax MDZ) were compared to predicted
RESULTS
Analysis of the in vivo data by population PK modelling SX population PK model
The SX population PK model previously developed was applied to data observed in the clinical trial with FD and MD. There were 240 and 60 SX concentrations obtained in the 12 subjects after repeated oral doses of SX (dose interval of 12h for 5 days) in the FD and the MD, respectively.
For FD and MD, SX parameter estimates with their relative standard errors (RSE%) obtained with NONMEM are in Table I (a). Using NONMEM, the minimization was successful and the covariance step was obtained for the 2 designs with the FOCEI method. With the FD, parameters were well estimated (RSE% were less than or equal to 16% for fixed-effect parameters, except for Q/F for which RSE was 28%). With MD, RSEs were higher than with FD (between 5 and 64% for fixed-effect parameters). SX CL/F was very well estimated whatever the design as CL/F RSEs were 6 and 5% with FD and MD, respectively. There were no statistical differences (p<0.05, Wald’s test) between parameters estimated using FD and MD, except for the estimates of Vp/F and of the
proportional part of the residual error. The difference of estimates between the two designs was high only for Vp/F. This could be due to the FOCEI algorithm in NONMEM,
which stopped in a local minimum.
The MDZ population PK model previously developed was applied to observed data when MDZ was given alone (D1) or co-administered with SX (D6) using FD or MD.
There were 142 and 58 MDZ concentrations obtained in the 12 subjects after a single 7.5mg MDZ oral dose administration with or without SX co-administration in the FD and the MD, respectively.
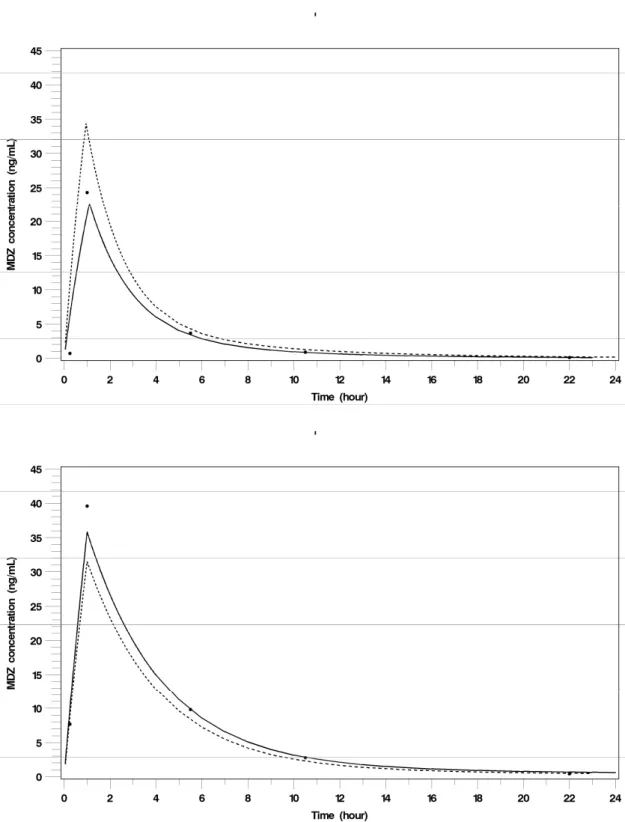
MDZ parameter estimates with their relative standard errors (RSE%) obtained with NONMEM and MONOLIX, are in Table I (b) for FD and MD, and for the two administration settings, with or without SX co-administration. Fits of MDZ concentration-time profiles after administration of a single dose of MDZ (7.5mg, per os) alone and co-administered with SX, obtained with MONOLIX using the optimal sparse design (MD) are displayed in Fig. 2 for a typical subject.
Using NONMEM, the minimization was successful for 3 out of the 4 population PK analyses of MDZ using the FOCEI method. The minimization was not successful for the sparse sampling time design, MD, when MDZ was co-administered with SX. The run was terminated due to rounding errors (error 134 in NONMEM), but parameter estimates were close to those obtained with the full sampling time design, FD. Moreover, for MD, the covariance step was not obtained when MDZ was administered alone. For all these analyses, only IIV on CL/F and Vc/F were estimated.
With FD, whatever the administration setting, with or without SX co-administration, parameters were well estimated (less than or equal to 21% for fixed-effect parameters). With MD, the accuracy of estimation was not obtained. Thus, with NONMEM, parameter
estimates were not compared across designs, as the covariance step was not obtained with MD (Wald’s test not applicable). Therefore, MONOLIX was used in order to try to obtain parameter estimates with their standard errors of estimation for the 4 population analyses.
Using MONOLIX, convergence was obtained in the 4 MDZ population analyses. Only IIV on CL/F and Vc/F were estimated, except for MD without co-administration of SX
for which IIV was also estimated on Tk0 (absorption duration of the zero-order absorption
constant).
RSE (%) given by MONOLIX were always obtained and were always higher than those given by NONMEM (when obtained). For FD, RSEs were between 11 and 34% for fixed-effect parameters. RSEs were higher for MD than for FD, and particularly much higher for Vp/F and Q/F. However, CL/F were always adequately estimated with MD
whatever the administration setting. With MONOLIX, there were no statistical differences (p<0.05, Wald’s test) between parameters estimated using FD and MD. With FD, MDZ inhibition ratios of CL/F (CL/FMDZ alone /CL/FMDZ+SX ) were 1.9 and 1.8
with NONMEM and MONOLIX, respectively, and with MD, they were 2.0 and 1.7 with NONMEM and MONOLIX, respectively. Whatever the design and the estimation method used, MDZ CL/F inhibitory ratios were in the same range and led to the conclusion of a moderate interaction between the two drugs. MDZ CL/F was about 2 fold smaller with SX co-administration.
Results of the analysis of the potential metabolism interaction: comparison tests
MDZ NCA results are displayed in Table 2. Tests of comparison based on individual parameters (i.e. log(AUC) and log(Cmax)) were performed using either individual
parameters obtained by NCA or individual EBEs assessed by population PK modelling. This latter approach was performed with both designs (FD and MD) and for both estimation methods (FOCEI in NONMEM and SAEM in MONOLIX). Results are displayed in Table II. Whatever the approach, NCA or population PK modelling, AUC of MDZ were statistically different (p<0.001) when administered without SX or with SX. 90% confidence intervals of geometric means of AUC were similar whatever the approach and showed that SX can be considered as a moderate CYP3A4 inhibitor. In the population PK approach, the same conclusions were obtained whatever the design, MD or FD, and whatever the estimation method, FOCEI in NONMEM or SAEM in MONOLIX.
Whatever the approach, NCA or population PK modelling, Cmax of MDZ were
statistically different (p<0.05) when administered without SX or with SX, except for the MD with MONOLIX. 90% confidence intervals of geometric means of Cmax were in the
same range whatever the approach, although for the MD with MONOLIX, the 90%CI was slightly lower than for the others. Therefore, clinical conclusions based on Cmax were
the same whatever the approach and whatever the design in the population PK modelling approach: SX had little effect on MDZ Cmax.
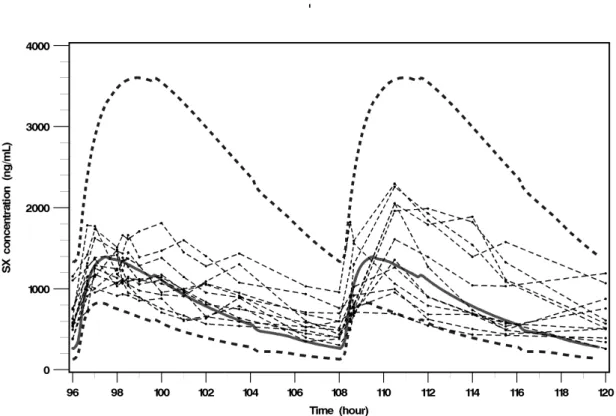
For both compounds, SX and MDZ, and on both periods (D1 for MDZ only and D6 for both compounds), medians, 5th and 95th percentiles of PBPK simulated
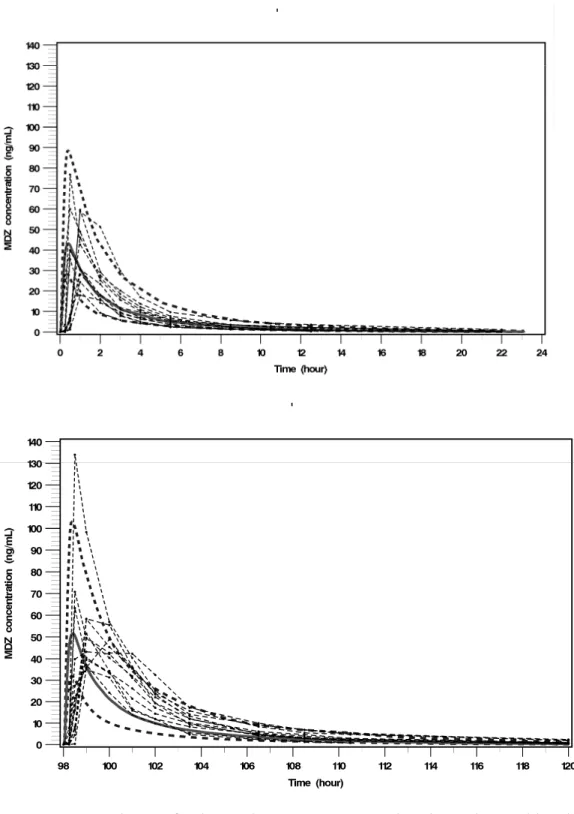
concentration-time profiles and observed concentration-concentration-time data obtained in the clinical trial are displayed on Fig. 3 and 4 (a &b). Observed SX concentration-time profiles were well predicted by the SX PBPK model (Fig. 3), however the SX PBPK model over-predicted the inter-individual variability. The MDZ PBPK model predicted the MDZ concentration-time profiles well when MDZ was administered alone (Fig. 4a) but slightly under-predicted the MDZ concentration-time profiles when MDZ was co-administered with SX (Fig. 4b).
Regarding PK parameters computed by NCA using the full design, SX Cmax and AUC
obtained in the in vivo study in 12 subjects after repeated doses were in the range of SX Cmax and AUC predicted by the SX PBPK model in 100 (simulated) subjects. However,
predicted SX Cmax and AUC ranges were very wide. Indeed, predicted SX median
[min-max] Cmax and AUC by the SX PBPK model were 1394 [743-6023] ng/mL and 18721
[8555-121484] ng.h/mL, respectively, whereas observed SX [min-max] Cmax were
[714-2296] ng/mL and observed SX median [min-max] AUC were 26647 [18987-53799] ng.h/mL.
After a single dose administration of MDZ (7.5mg, per os), observed MDZ Cmax and
AUC obtained in the clinical trial in 12 subjects were quite well predicted by the MDZ PBPK model since observed MDZ median [min-max] Cmax and AUC were 40 [18-77]
ng/mL and 103 [57-224] ng.h/mL, respectively, and predicted MDZ median [min-max] Cmax and AUC were 43 [21-143] ng/mL and 114 [47-455] ng.h/mL, respectively.
After a single dose administration of MDZ (7.5mg per os) co-administered with SX at steady-state, observed MDZ Cmax obtained in the clinical trial in 12 subjects were well
predicted by the DDI PBPK models (observed Cmax median [min-max] = 51 [35-134]
ng/mL, and predicted Cmax median [min-max] = 52 [25-151] ng/mL). However observed
inhibitory ratio for Cmax were slightly under-predicted by the DDI PBPK models
(observed RI Cmax median [min-max] = 1.3 [0.76-2.6] and predicted RI Cmax median
[min-max] = 1.1 [1.1-1.5]). Observed MDZ AUC were slightly under-predicted by the DDI PBPK models (observed AUC median [min-max] = 201 [110-367] ng.h/mL, and predicted AUC median [min-max] = 140 [47-455] ng.h/mL). Hence, observed inhibitory ratio for AUC were slightly under-predicted by the DDI PBPK models (observed RI AUC
median [min-max] = 1.9 [1.4-2.6] and predicted RI AUC median [min-max] = 1.2
DISCUSSION
A DDI study was planned to assess the potential inhibitory effect of a phase I compound (SX) on a reference CYP3A4 substrate, MDZ. This clinical study was optimally designed, without any in vivo data, using PBPK predictions, population PK modelling and multiresponse design optimization. A first paper (4) described the methods and results of PBPK predictions, population PK modelling and sampling time optimization with evaluation by simulation. The present paper compared full (FD) and optimal sparse (MD) sampling time designs by population PK modelling using real data, analysed the results of the clinical trial by population PK modelling and non-compartmental approach, and then compared results of the clinical trial with PBPK predictions.
Analysis of the SX in vivo data, using the SX model previously developed, showed that even if, as expected, RSEs were higher with the optimal sparse design, SX CL/F was well estimated by NONMEM with both designs. There were no statistical differences (p<0.05, Wald’s test) between parameters estimated using FD and MD, except for the estimates of Vp/F and of the proportional part of the residual error. Analysis of the MDZ in vivo data,
using the MDZ model previously developed, showed that MDZ CL/F was adequately estimated with both designs whatever the administration setting (without or with SX co-administration) using MONOLIX. With NONMEM, the covariance step was not obtained with the sparse design (MD) and therefore, the standard errors of CL/F estimation were not assessed. However, using NONMEM, MDZ CL/F estimates obtained with MD were close to those obtained with FD and therefore inhibitory CL/F ratios were 1.9 and 2.0 with FD and MD, respectively. With MONOLIX, there were no statistical differences
(p<0.05, Wald’s test) between parameters estimated using FD and MD and inhibitory CL/F ratios were 1.8 and 1.7 with FD and MD, respectively. Thus, whatever the estimation method and the design (full or sparse), we concluded that SX is a moderate CYP3A4 inhibitor, which given at maximum therapeutic doses reduced the apparent clearance of MDZ by half. These results were also in agreement with those obtained by non-compartmental analysis since the median inhibition ratio of AUC was 1.9.
Using NONMEM, the minimization was successful and the covariance step was obtained in 4 out of 6 runs whereas with MONOLIX, the 6 runs converged and accuracies of parameter estimation were always obtained. Moreover MONOLIX (version 2.1) was by far faster than NONMEM (version V).
Inter-individual variability was estimated only on MDZ CL/F and Vc/F whereas the MDZ
population PK model developed using MDZ PBPK simulations had inter-individual variability on all parameters; this is likely due to the small number of subjects (n=12) in the clinical trial. The PBPK models correctly predicted the concentration-time profiles of SX and MDZ when administered separately, but under-predicted the interaction of SX on MDZ. Although the PBPK model did not predict a 2-fold decrease in MDZ CL/F, the MDZ population PK model developed from the simulated PBPK MDZ concentration-time profiles was able to fit the observed data.
In the present work, the analysis of observed PK data by population PK modelling was performed by estimating model parameters of the population PK models previously
developed with PBPK simulations. As no in vivo PK data were used to develop these population PK models, this was a challenge due to a high risk of model misspecification. However, whatever the design and the compound, model runs were successful at least with MONOLIX and results in terms of fit were satisfactory. Moreover, according to usual GOF plots, the models did not suffer from model misspecification except in one case, i.e. MDZ co-administered with SX and with the optimal sparse design. Comparison of reference model parameter estimates (those obtained from model buildings from PBPK simulations) with those obtained from observed PK data showed that both models suffered from parameter misspecification. PK modelling results may have been improved if models had been built from in vivo data.
Whatever the compound, the design and the software, proportional error estimates of the residual error models were much higher with observed data than with PBPK simulations and therefore it may be more realistic to increase the noise in the simulated data.
For MDZ CL/F, the expected RSE given by PopDes (15) with MD was around 20% (4), which was in agreement with CL/F RSE obtained with MONOLIX (17%) when MDZ was administered alone (i.e. no interaction) and not too far from that obtained when MDZ was co-administered with SX (29%). Thus, CL/F RSEs obtained with MONOLIX were in agreement with expected RSEs given by PopDes (the software used to estimate the joint optimal sampling times). For SX CL/F, the expected RSE given by PopDes with MD was 31%, which was high in comparison with NONMEM CL/F RSE (5%).
Comparisons were performed to test the difference between MDZ PK without and with SX co-administration. This was performed on the logarithms of AUC and Cmax since the
Food and Drug Administration (16, 17) and the European Agency for the Evaluation of Medicinal Product (EMEA) (18, 19) guidelines recommend to test comparison or equivalence as the ratio of the geometric means of PK parameters such as the AUC and Cmax. AUC and Cmax are usually estimated by NCA, which is a method that typically uses
a large number of samples per subject. Since in the present work, we were interested in comparing two designs, a full design and an optimal sparse design, on their capability to detect a potential interaction between two drugs, data were analyzed by a population approach and the same tests were applied on AUC and Cmax derived from EBE (13, 14).
Indeed, Panhard and Mentré showed that results of EBE and NCA tests are similar except when the number of samples per subject is very low. Thus, NCA tests are applicable when the number of sample per subject is large, whereas non-linear mixed-effects modelling is very powerful for cross-over studies where the number of samples per subject is limited. However, the shrinkage in parameter must be low (less than 20%) to apply this method to EBE. As the shrinkage in CL/F was always satisfactory, the method based on EBE was applicable to AUC. In only one case, the optimal sparse design with MONOLIX when drugs are co-administered, the shrinkage was higher than 20% for one parameter, the apparent central volume. Consequently we can have some reserves about the method when applied to Cmax in this case only.
Regarding AUC, results of NCA and EBE tests were similar with FD whatever the estimation method used for the population PK modelling, and results of EBE tests performed with the full design were similar to those obtained with the optimal sparse
design (MD) with SAEM (MONOLIX) as well as with FOCEI (NONMEM). All methods led to the same conclusion with respect to the difference of AUC between the two administration settings, without and with SX co-administration. Regarding Cmax, all
tests concluded to the difference of MDZ Cmax between the 2 administration settings
except with the optimal sparse design with MONOLIX. However, the effect on Cmax was
smaller than on AUC.
According to the general strategies of drug-drug interaction studies reported in the guidance for industry (3), drug development should follow a sequence of studies from in vitro studies to in vivo human studies, including those employing special study designs and methodologies where appropriate. A complete understanding of the quantitative relationship between the in vitro findings and in vivo results of metabolism/drug-drug interaction studies is still emerging. Nonetheless, in vitro studies can frequently serve as a screening mechanism to rule out the importance of a metabolic pathway and the drug-drug interactions that could occur through this pathway so that subsequent in vivo testing is unnecessary. In the present example, in vitro studies showed a potential inhibitory effect of SX on a reference CYP3A4 substrate, MDZ.
On the one hand, using the current recommended approach, in which the likelihood of an
in vivo interaction is projected based on the [I]/Ki ratio where [I] represents the mean steady-state Cmax value for total drug (bound plus unbound) following administration of
the highest proposed clinical dose of the inhibitor, the predicted interaction was considered possible but not likely (0.1<[I]/Ki<1) and therefore in vivo evaluation was recommended. On the other hand, using a PBPK modelling approach, which allowed the
concentration-time profiles of the two co-administered drugs in each tissue of the whole body, such as the liver, to be taken into account, the predicted inhibitory AUC ratio was 1.2 [1.1-2.1] (median [min-max]) and SX was considered as a weak inhibitor of CYP3A4. The discrepancy between the two approaches could be due to the high binding of SX to plasma proteins, which was taken into account with the PBPK modelling approach whereas it was not with the classical recommended approach and also to the use of liver concentrations in the PBPK approach. Bearing in mind that drug development must be as fast as possible with limited costs and limited investigations in healthy volunteers, our objective was to evaluate the global approach used in the present work with real data to further apply it to assess DDI directly in patients in phase II studies for drugs with weak predicted inhibitory effect (PBPK approach) or for which the predicted interaction was possible but not likely (classical approach with 0.1<[I]/Ki<1).
Although the DDI was slightly under predicted by PBPK predictions, the population PK analysis with the optimal sparse design determined from PBPK predictions allowed the measurement of the same extent of drug interaction from observed data as the non-compartmental analysis with the full design. Moreover, the optimal sampling time design would allow the use of 12 fewer sampling times for MDZ clearance estimation in comparison to the full empirical design and therefore the sparse optimal design could be used in phase II studies and limit costs. By performing some DDI studies directly in patients, the development could be faster and information could be directly obtained in the target population. In the present work, no PK differences were expected between healthy volunteers and patients. Nevertheless, the PBPK modelling approach is capable to predict patient PK profiles when necessary (19, 20, 21)
The present example was particularly challenging as only in vitro data were used to perform PBPK predictions, but we could imagine applying this approach just after the first dose in man study and therefore including prior knowledge of the drug PK into the PBPK model.
In the present example, the maximum therapeutic dose of the inhibitor, the drug in development, was known at early stage of the development, and therefore it was possible to design a study in agreement with guidelines (i.e. to test the maximum therapeutic dose of the inhibitor). This is a very rare case. However this global approach can be applied to evaluate the effects of well-know inhibitors on drugs in development (substrate), and therefore it is not necessary to know the therapeutic dose of the substrate to use this approach.
Lastly, if an interaction is expected between a drug in development (inhibitor/ substrate) with a drug (substrate/ inhibitor) likely to be co-administered in the target population, an optimal study design with joint sampling times for the two co-administered drugs could allow the assessment of the PK DDI and the characterization of the clinical impact of the drug interaction in large-scale clinical studies (phase III) by linking the drug exposure to potential adverse events.
CONCLUSION
For the first time, a global strategy including PBPK predictions, population PK modelling and multiresponse optimal design was applied to design a drug-drug interaction study without any in vivo prior information. While a first paper (4) described the method to design the clinical trial, the present paper analyzed the results of the clinical trial. Although, the drug-drug interaction was slightly under predicted by PBPK predictions, population PK analysis with the optimal sparse design allowed the assessment of the drug interaction equally well as the non-compartmental analysis with the full design. Thus, this global approach allows the quantification of the drug-drug interaction with an ethical and cost limited design, and can be applied in drug development. This global approach could be extended to assessment of DDI in phase II and III clinical trials.
REFERENCES
1. J. C. Krayenbühl, S. Vozeh, M. Kondo-Oestreicher, P. Dayer. Drug-drug interactions of new active substances: mibefradil example. Eur J Clin Pharmacol.
55(8): 559-65. Review (1999).
2. R. R. Shah. Pharmacogenetic aspects of drug-induced torsade de pointes: potential tool for improving clinical drug development and prescribing. Drug Saf.
27(3): 145-172 (2004).
3. FDA. Guidance for Industry - Drug Interaction Studies – Study Design, Data Analysis, and Implications for Dosing and Labeling. 2006.
http://www.fda.gov/cder/Guidance/6695dft.pdf.
4. M. Chenel, F. Bouzom, L. Aarons, and K. Ogungbenro. Drug-Drug Interaction Predictions with PBPK models and Optimal Multiresponse Sampling Time Designs: Application to Midazolam and a phase I compound. Part 1: Comparison of uniresponse and multiresponse designs using PopDes. Submitted to J. Pharmacokinet. Pharmacodyn.
5. S. L. Beal, and L. B. Sheiner. NONMEM Users Guides, Version 5, NONMEM Project Group, University of California at San Francisco, 1996.
6. M. Lavielle, and F. Mentré. Estimation of population pharmacokinetic parameters of saquinavir in HIV patients and covariate analysis with the saem algorithm implemented in MONOLIX. J. Pharmacokinet. Pharmacodyn. 34(2): 229-249 (2007).
8. S. Donnet, and A. Samson. Estimation of parameters in incomplete data models defined by dynamical systems. J. Stat. Plan. Infer. 137: 2815-2831 (2007).
9. E. Kuhn, and M. Lavielle. Coupling a stochastic approximation version of EM with a MCMC procedure. ESAIM P&S: 115-131 (2004).
10.E. Kuhn, and M. Lavielle. Maximum likelihood estimation in nonlinear mixed effects models. Comput. Stat.& Data Analysis.49(4): 1020-1038 (2005).
11.E. Comets, C. Verstuyft, M. Lavielle, P. Jaillon, P. Becquemont, and F. Mentré. Modelling the influence of MDR1 polymorphism on digoxin pharmacokinetic parameters. Eur. J. Clin. Pharmacol.63(5): 437-449 (2007).
12.K. Brendel, E. Comets, C. Laffont, C. Laveille, and F. Mentré. Metrics for external model evaluation with an application to the population pharmacokinetics of Gliclazide. Pharm. Res.23(9): 2036-49 (2006).
13.X. Panhard and F. Mentré. Evaluation by simulation of tests based on non-linear mixed-effects models in pharmacokinetic interaction and bioequivalence cross-over trials. Statist. Med.24: 1509-1524 (2005).
14.X. Panhard, A.-M. Taburet, C. Piketti and F. Mentré. Impact of modelling intra-subject variability on tests based on non-linear mixed-effects models in cross-over pharmacokinetic trials with application to the interaction of tenofovir on atazanavir in HIV patients. Statist. Med.26: 1268-1284 (2007).
15.I. Gueorguieva, K. Ogungbenro, G. Graham, S. Glatt, and L. Aarons. A program for individual and population optimal design for univariate and multivariate response pharmacokinetic and pharmacodynamic models. Comput. Methods Programs Biomed.86(1): 51-61 (2007).
16.FDA. Guidance for Industry – Population Pharmacokinetics. 1999. http://www.fda.gov/guidance/1852fnl.pdf
17.FDA. Guidance for Industry – Bioavailability and Bioequivalence Studies for Orally Administered Drug Products – General Considerations. 2003. http://www.fda.gov/cder/guidance/5356fnl.pdf
18.EMEA. Note for Guidance on the Investigation of Bioavailability and Bioequivalence.2002. http://www.emea.europa.eu/pdfs/human/ewp/140198en.pdf 19.EMEA. Note for Guidance on the Investigation of Drug Interactions. 1998.
http://www.emea.europa.eu/pdfs/human/ewp/056095en.pdf
20.S. Björkman, D.R. Wada, B.M. Berling and G. Benoni. Prediction of the disposition of midazolam in surgical patients by a physiologically based pharmacokinetic model. J. Pharm Sci.90(9): 1226-41 (2001).
21.M. Tod, F. Lagneau, V. Jullien and O. Mimoz. A Physiological Model to Evaluate Drug Kinetics in Patients with Hemorrhagic Shock Followed by Fluid Resuscitation: Application to Amoxicillin-clavulanate. Pharm Res.6 (2008). 22.J. Li and P. Gwilt.The effect of malignant effusions on methotrexate disposition.
Table I (a). SX population PK model parameter estimates using either the FD or the MD with NONMEM at day 6 (repeated doses with a dose interval of 12h for 5 days).
Estimate (RSE%) FD MD Wald’s test
CL/F (L/h) 8.2 (6) 8.2 (5) ns Vc/F (L) 17 (16) 24 (35) ns Q/F (L/h) 8.1 (28) 14 (64) ns Vp/F (L) 1000 (14) 19 (58) p<0.001 ka (h-1) 0.19 FIXED 0.19 FIXED na ω2_CL/F 0.04 (125) 0.04 (56) ns ω2_Vc/F 0.14 (49) 0.51 (94) ns correlation CL/F - Vc/F -0.035 (0.015) 0.027 (0.081) ns Prop (CV%) 26 (8) 20 (11) p=0.048
Add (ng/mL) 0.2 FIXED 0.2 FIXED na
ns stands for no statistical difference between parameter estimates obtained with both designs (Wald’s test, p<0.05), na stands for not applicable.
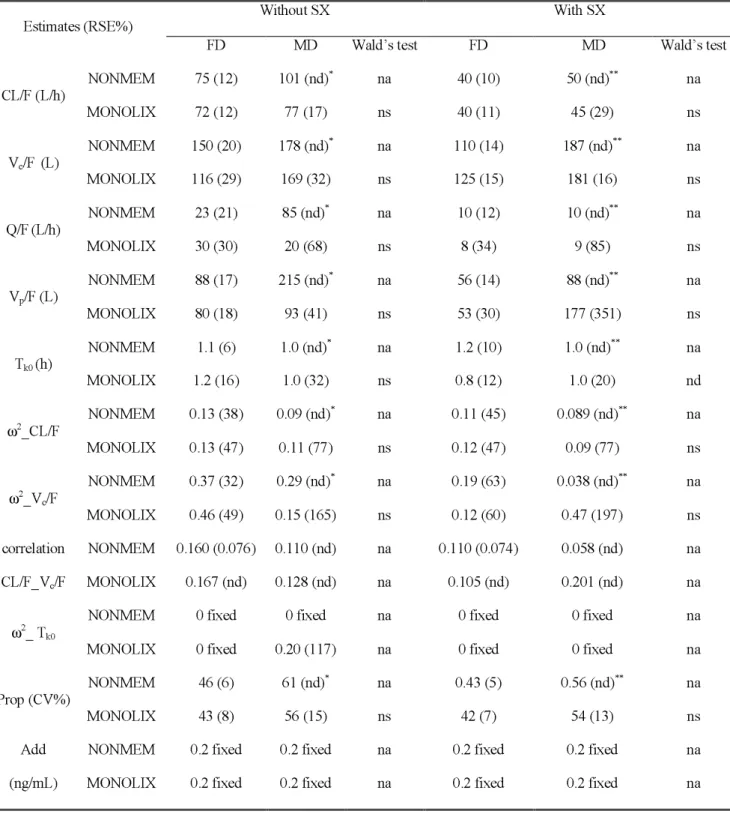
Table I (b). MDZ population PK model parameter estimates using either the FD or the MD with NONMEM and MONOLIX under the 2 administration settings, without and with co-administration of SX.
Without SX With SX
Estimates (RSE%)
FD MD Wald’s test FD MD Wald’s test
NONMEM 75 (12) 101 (nd)* na 40 (10) 50 (nd)** na CL/F (L/h) MONOLIX 72 (12) 77 (17) ns 40 (11) 45 (29) ns NONMEM 150 (20) 178 (nd)* na 110 (14) 187 (nd)** na Vc/F (L) MONOLIX 116 (29) 169 (32) ns 125 (15) 181 (16) ns NONMEM 23 (21) 85 (nd)* na 10 (12) 10 (nd)** na Q/F(L/h) MONOLIX 30 (30) 20 (68) ns 8 (34) 9 (85) ns NONMEM 88 (17) 215 (nd)* na 56 (14) 88 (nd)** na Vp/F (L) MONOLIX 80 (18) 93 (41) ns 53 (30) 177 (351) ns NONMEM 1.1 (6) 1.0 (nd)* na 1.2 (10) 1.0 (nd)** na Tk0 (h) MONOLIX 1.2 (16) 1.0 (32) ns 0.8 (12) 1.0 (20) nd NONMEM 0.13 (38) 0.09 (nd)* na 0.11 (45) 0.089 (nd)** na ω2_CL/F MONOLIX 0.13 (47) 0.11 (77) ns 0.12 (47) 0.09 (77) ns NONMEM 0.37 (32) 0.29 (nd)* na 0.19 (63) 0.038 (nd)** na ω2_V c/F MONOLIX 0.46 (49) 0.15 (165) ns 0.12 (60) 0.47 (197) ns NONMEM 0.160 (0.076) 0.110 (nd) na 0.110 (0.074) 0.058 (nd) na correlation CL/F_Vc/F MONOLIX 0.167 (nd) 0.128 (nd) na 0.105 (nd) 0.201 (nd) na
NONMEM 0 fixed 0 fixed na 0 fixed 0 fixed na
ω2_ T k0
MONOLIX 0 fixed 0.20 (117) na 0 fixed 0 fixed na
NONMEM 46 (6) 61 (nd)* na 0.43 (5) 0.56 (nd)** na
Prop (CV%)
MONOLIX 43 (8) 56 (15) ns 42 (7) 54 (13) ns
NONMEM 0.2 fixed 0.2 fixed na 0.2 fixed 0.2 fixed na Add
na stands for not applicable, ns stands for no statistical difference between parameter estimates obtained with both designs (Wald’s test, p<0.05), nd stands for not determined, * stands for run for which the
covariance step was not obtained, ** stands for run for which the minimization was not successful. ω2_Q/F
and ω2_V
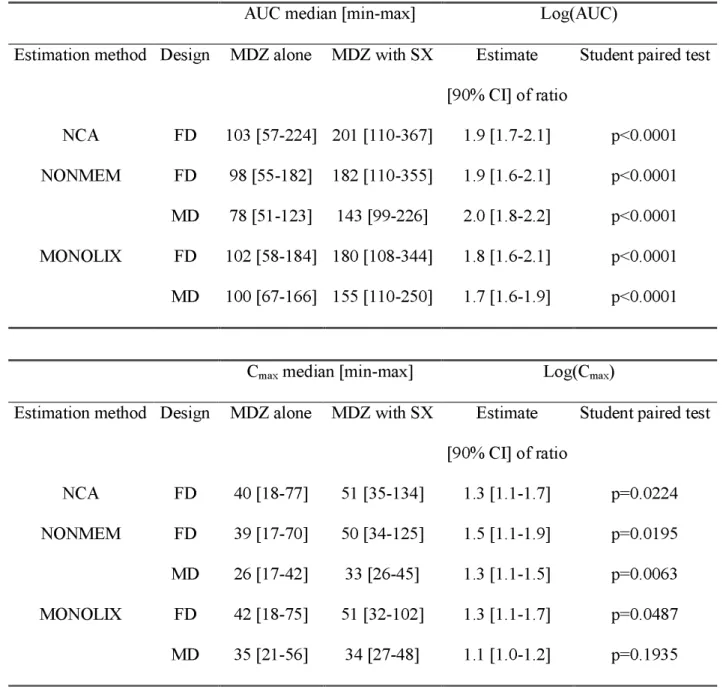
Table II. Comparison tests based on log (AUC) and log(Cmax) individual parameters
between groups (MDZ without SX and MDZ co-administered with SX).
AUC median [min-max] Log(AUC)
Estimation method Design MDZ alone MDZ with SX Estimate [90% CI] of ratio
Student paired test NCA FD 103 [57-224] 201 [110-367] 1.9 [1.7-2.1] p<0.0001 FD 98 [55-182] 182 [110-355] 1.9 [1.6-2.1] p<0.0001 NONMEM MD 78 [51-123] 143 [99-226] 2.0 [1.8-2.2] p<0.0001 FD 102 [58-184] 180 [108-344] 1.8 [1.6-2.1] p<0.0001 MONOLIX MD 100 [67-166] 155 [110-250] 1.7 [1.6-1.9] p<0.0001
Cmax median [min-max] Log(Cmax)
Estimation method Design MDZ alone MDZ with SX Estimate [90% CI] of ratio
Student paired test
NCA FD 40 [18-77] 51 [35-134] 1.3 [1.1-1.7] p=0.0224 FD 39 [17-70] 50 [34-125] 1.5 [1.1-1.9] p=0.0195 NONMEM MD 26 [17-42] 33 [26-45] 1.3 [1.1-1.5] p=0.0063 FD 42 [18-75] 51 [32-102] 1.3 [1.1-1.7] p=0.0487 MONOLIX MD 35 [21-56] 34 [27-48] 1.1 [1.0-1.2] p=0.1935
Fig. 1. Study design of the drug-drug interaction clinical trial. MDZ stands for
Midazolam, SX for a phase I compound, s.d. for single dose and Di for the ith Day of the
study. D1 D6 -24 h 96 h 120 h D2 0 h MDZ (s.d.) SX MDZ (s.d.) 98 h SX SX D7 108 h Number of subjects: 12 SX dose interval = 12 h
Fig. 2 MDZ concentration-time profile in a typical subject after a 7.5 mg MDZ single dose administration (top) and after a 7.5 mg MDZ single dose administration given to 2h
concentration-time data, lines correspond to individual predicted profiles and dotted lines correspond to population predicted profiles. Concentrations used were those measured at the optimal sampling times (sparse optimal sampling time design, MD) and modelling was performed with MONOLIX version 2.1.
Fig. 3. Comparison of observed SX concentration-time data with simulated concentration-time profiles obtained using SX PBPK model. Thin dashed lines with dots correspond to observed SX concentration-time data, and plain line and both large dotted lines correspond to the median and the 5th and 95th percentiles of simulated SX
Fig. 4 Comparison of observed MDZ concentration-time data with simulated concentration-time profiles obtained using MDZ PBPK model. These results correspond to MDZ concentration-time data after a 7.5mg MDZ single oral dose (top) without SX
co-administration, (bottom) with SX co-administration. Thin dashed lines with dots correspond to observed MDZ concentration-time data and plain line and both large dotted lines correspond to the median and the 5th and 95th percentiles of simulated MDZ