HAL Id: hal-02637688
https://hal.inrae.fr/hal-02637688
Submitted on 27 May 2020
HAL is a multi-disciplinary open access archive for the deposit and dissemination of sci-entific research documents, whether they are pub-lished or not. The documents may come from teaching and research institutions in France or abroad, or from public or private research centers.
L’archive ouverte pluridisciplinaire HAL, est destinée au dépôt et à la diffusion de documents scientifiques de niveau recherche, publiés ou non, émanant des établissements d’enseignement et de recherche français ou étrangers, des laboratoires publics ou privés.
Distributed under a Creative Commons Attribution| 4.0 International License
Cluster analysis of polyphenol intake in a French
middle-aged population (aged 35-64 years)
Chantal Julia, Mathilde Touvier, Camille Lassale, Leopold Fezeu, Pilar Galan,
Serge Hercberg, Emmanuelle Kesse-Guyot
To cite this version:
Chantal Julia, Mathilde Touvier, Camille Lassale, Leopold Fezeu, Pilar Galan, et al.. Cluster analysis of polyphenol intake in a French middle-aged population (aged 35-64 years). Journal of Nutritional Science, Nutrition Society, 2016, 5, �10.1017/jns.2016.16�. �hal-02637688�
RESEARCH ARTICLE
Cluster analysis of polyphenol intake in a French middle-aged population
(aged 35
–64 years)
Chantal Julia
1,2*, Mathilde Touvier
1, Camille Lassale
1, Léopold Fezeu
1, Pilar Galan
1, Serge Hercberg
1,2and Emmanuelle Kesse-Guyot
11Université Paris 13, Equipe de Recherche en Epidémiologie Nutritionnelle (EREN), Centre de Recherche en Epidémiologie et Statistiques, Inserm
(U1153), Inra (U1125), Cnam, COMUE Sorbonne Paris Cité, F-93017 Bobigny, France
2Department of Public Health, Avicenne Hospital (AP-HP), Bobigny, France
(Received 27 November 2015– Final revision received 8 March 2016 – Accepted 17 March 2016)
Journal of Nutritional Science(2016), vol. 5, e28, page 1 of 9 doi:10.1017/jns.2016.16
Abstract
Polyphenols have been suggested as protective factors for a range of chronic diseases. However, studying the impact of individual polyphenols on health is hindered by the intrinsic inter-correlations among polyphenols. Alternatively, studying foods rich in specific polyphenols fails to grasp the ubiquity of these components. Studying overall dietary patterns would allow for a more comprehensive description of polyphenol intakes in the population. Our objective was to identify clusters of dietary polyphenol intakes in a French middle-aged population (35–64 years old). Participants from the primary prevention trial SUpplementation en VItamines et Minéraux AntioXydants (SU.VI.MAX) study were included in the present cross-sectional study (n 6092; 57·8 % females; mean age 48·7 (SD6·4) years). The fifty most consumed individual dietary polyphenols were divided into energy-adjusted tertiles and introduced in a
mul-tiple correspondence analysis (MCA), leading to comprehensive factors of dietary polyphenol intakes. The identified factors discriminating polyphenol intakes were used in a hierarchical clustering procedure. Four clusters were identified, corresponding broadly to clustered preferences for their respective food sources. Cluster 1 was characterised by high intakes of tea polyphenols. Cluster 2 was characterised by high intakes of wine polyphenols. Cluster 3 was characterised by high intakes offlavanones and flavones, corresponding to high consumption of fruit and vegetables, and more broadly to a healthier diet. Cluster 4 was characterised by high intakes of hydroxycinnamic acids, but was also associated with alcohol consumption and smoking. Profiles of poly-phenol intakes allowed for the identification of meaningful combinations of polyphenol intakes in the diet.
Key words:Polyphenol intakes: Cluster analysis: Profiles of consumption
Polyphenols represent a complex family occurring in most plant foods, consisting of more than 500 identified com-pounds in the human diet, from low-molecular-weight phenolic acids to highly polymerised proanthocyanidins(1,2). Bioavailability and biological properties of polyphenols depend on their chemical structure, including the number and position of hydroxyl groups, glycosylation and acylation of the com-pound(1,3–6). Polyphenols are classified as phenolic acids, fla-vonoids, stilbenes and lignans according to their chemical structure(7). Intakes of individual polyphenols or subclasses of polyphenols (particularlyflavonoids) have been investigated
in various populations and related to their main food sources(8–17).
Polyphenols are powerful antioxidants and they have been suggested to be associated with protection against a wide range of chronic diseases(18–26). Individual polyphenols or sub-classes of polyphenols have shown protective effects in CVD and inflammation(19,20,23). Regarding cancer, however, the most recent reviews have found inconsistent results(18,22,24).
However, studies on the impact of individual polyphenols on health are hindered by the intrinsic intercorrelations among polyphenols sharing common food sources(19). Some
Abbreviations:MCA, multiple correspondence analysis; SU.VI.MAX, SUpplementation en VItamines et Minéraux AntioXydants.
* Corresponding author: C. Julia, emailc.julia@uren.smbh.univ-paris13.fr
© The Author(s) 2016. This is an Open Access article, distributed under the terms of the Creative Commons Attribution licence (http://creative-commons.org/licenses/by/4.0/), which permits unrestricted reuse, distribution, and reproduction in any medium, provided the original work is properly cited.
JOURNAL OF NUTRITIONAL SCIENCE
1
authors have bypassed this limitation by assessing the impact of polyphenol-rich foods (e.g. tea or cocoa) on health(27,28). However, studying specific foods is subject to the same kind of limitations, as foods are eaten in combination, within meals(29). Therefore synergistic or interactive combinations of polyphenols within one food source are likely to also interfere between various foods eaten together(13). To over-come the limitation of investigating individual polyphenols or foods, some have argued for the investigation of overall dietary patterns(30,31).
Studying overall dietary patterns would allow for a more comprehensive description of combinations of individual poly-phenols within an individual’s diet. Our objective was to iden-tify mutually exclusive groups of dietary polyphenol intakes in a French middle-aged population, in order to identify mean-ingful combinations of individual polyphenol intakes within the diet.
Material and methods Population
Subjects included in the present study were selected from par-ticipants in the SUpplementation en VItamines et Minéraux AntioXydants (SU.VI.MAX) study. Briefly, middle-aged parti-cipants from the general population (35–64 years old) were included in 1994–1995 in a randomised, double-blind, placebo-controlled, primary prevention trial (Trial Registration clinicaltrials.gov no. NCT00272428) designed to evaluate the effect of a planned 8-year supplementation in antioxidant vita-mins and minerals at nutritional doses on the incidence of CVD and cancer(32). This study is a cross-sectional observa-tional study using baseline data from the SU.VI.MAX study.
Ethics
The SU.VI.MAX study was approved by the Ethics Committee for Studies with Human Subjects of Paris-Cochin Hospital (no. 706) and the Commission Nationale Informatique et Liberté (no. 334641). All subjects gave written informed consent to participate in the study.
Dietary data assessment
Dietary assessment was carried out via repeated 24 h records (1994–1996), collected by computerised questionnaires using the Minitel Telematic Network loaded with study-specific soft-ware, as described before(32). The Minitel was a small terminal widely used in France as an adjunct to the telephone. Dietary collection dates were randomised and fixed for each partici-pant so that each day of the week and all seasons were cov-ered. A validated instruction manual was used to code food portions, including more than 250 generic items, correspond-ing to 1000 specific foods(33). Foods were classified into
thirty-two food groups. A French published food composition table was used to calculate nutrient intakes from 24 h dietary records(34). A specific food composition table was used to compute dietary polyphenol intake, based on the published
Phenol-Explorer Database (www.phenol-explorer.eu)(1). The database contains food-composition data for all known poly-phenols (flavonoids, phenolic acids, lignans, stilbenes and other minor polyphenols) in foods. Moreover, it includes data on glycosides and esters. It contains data on a total of 502 polyphenols(1). Individual polyphenols’ contents in foods were determined by chromatography (most often reverse-phase HPLC and gas chromatography), except for proantho-cyanidins > 4mers, for which content data obtained by normal-phase HPLC were used.
Subjects having at least six dietary records available in the first 2 years of the study (1994–1996), with at least three records during the autumn–winter months and three during the spring–summer months, were included in the present study. The number of dietary records retained and the balance of dietary records between seasons were chosen in order to take into account day-to-day and seasonal intra-individual vari-ability in food intake.
Sociodemographic and anthropometric data
Educational level (primary, secondary, superior), physical activity (irregular, <1 h equivalent walking/d,≥1 h equivalent walking/d) and smoking status, including cigarettes, cigars and pipes (never smoked, former smoker, current smoker) data were obtained through self-administered questionnaires at baseline.
Anthropometric measurements were taken at a clinical examination 1 year after inclusion in the SU.VI.MAX study. Weight was measured in subjects in light clothing and with no shoes to the nearest 0·1 kg and height was measured to the nearest 1 cm with a wall-mounted stadiometer under the same conditions. When measured weight and height were not available, self-reported weight and height were used instead of measured data (n 988; 16·2 %).
Statistical analysis
BMI was calculated as weight (in kg) divided by the square of height (in m).
Adherence to the traditional Mediterranean diet was com-puted using the Mediterranean Diet Score, as described by Trichopoulou et al.(35).
Mean daily intake of each nutrient and polyphenol was cal-culated for each subject across their 24 h dietary records. Then, median intakes of individual polyphenols were com-puted for the whole population, and thefifty most consumed polyphenols (according to median intake) were considered for the subsequent analysis of clusters of polyphenol intakes. The objective of the analysis was to group individuals in mutually exclusive groups according to their overall intakes in thefifty selected polyphenols.
Polyphenol intakes, nutrient intakes and food group con-sumption were considered in terms of energy-adjusted intakes using the residual method(36). Energy-adjusted intakes of the fifty selected individual polyphenols were divided in tertiles and then introduced as input variables in a multiple corres-pondence analysis (MCA). Factors extracted from the MCA
2
journals.cambridge.org/jns
https://doi.org/10.1017/jns.2016.16
were selected for a subsequent cluster analysis. The number of dimensions used for cluster analysis was selected using the explained inertia (% of the initial variability) that they repre-sented. The dimensions were retained in the analyses if they represented >7 % of total inertia and the number of clusters to include in the model was selected using the plot of semi-partial R2 and the cubic clustering criterion by the number of clusters.
The identified clusters of polyphenol intakes were described in terms of individual polyphenol intakes, sociodemographic, lifestyle and anthropometric data and finally dietary intake (nutrients and food groups). All results for individual polyphe-nol intakes, nutrient intakes or food group consumption are presented as mean energy-adjusted variables. Clusters were compared using χ2 tests for categorical variables and ANOVA for continuous variables, given the normal distribu-tion of the variables, in particular energy-adjusted residuals.
All tests were two-sided and P < 0·001 was considered stat-istically significant, correcting for multiple comparisons. SAS version 9.3 (SAS Institute, Inc.) was used for analyses
Results
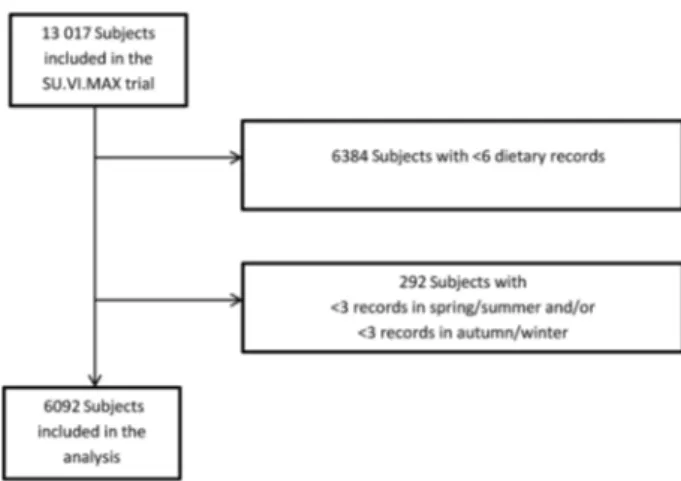
Among the 13 017 subjects included in the initial SU.VI.MAX study, 6092 had at least six dietary records available (Fig. 1), with at least three in the spring–summer months and three in the autumn–winter months and were included in the study (mean number of dietary records = 11·0 (SD2·1);
mean number of spring–summer dietary records = 5·0 (SD
1·2); mean number of autumn–winter months dietary records = 6·0 (SD1·6)). The sample included 57·8 % of women, with a
mean age of 48·7 (SD6·4) years.
The fifty most consumed polyphenols belonged mostly to flavonoids and phenolic acids. Selected individual polyphenols includedflavanols (six catechins, nine proanthocyanidins (six individual trimers or dimers, three measured using normal-phase HPLC by degree of polymerisation)), one dihydro flavo-nol, four anthocyanins, threeflavanones, three flavones, eight flavonols, two hydroxybenzoic acids, thirteen hydroxycinnamic
acids and one other polyphenols (tyrosol). No lignans or stil-bens were represented in the selection.
Four main factors were extracted from the MCA procedure, explaining 39 % of total inertia. Plots of the cubic clustering criteria and semi-partial R2by the number of clusters allowed us to identify four clusters of dietary polyphenol intakes as the best solution.
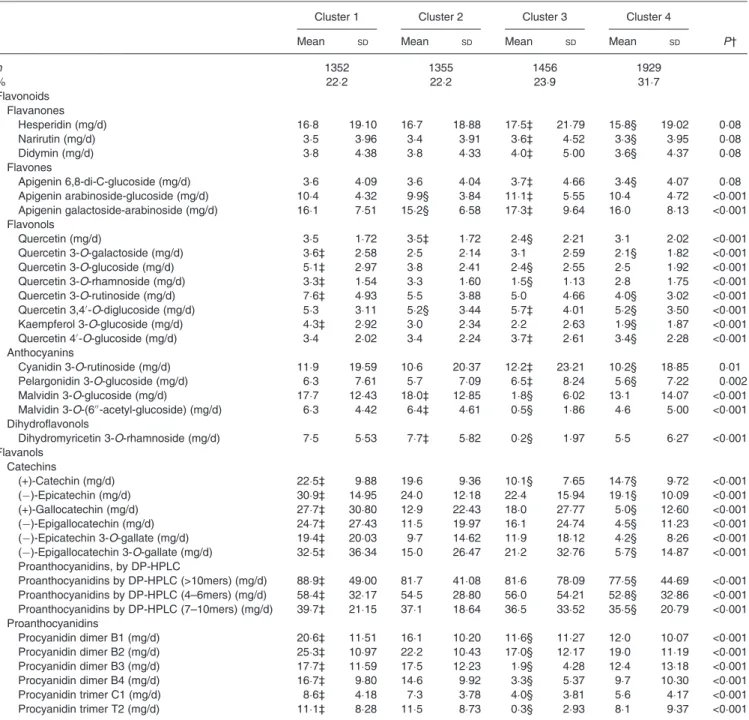
The four clusters regrouped 1352 (22·2 %), 1355 (22·2 %), 1456 (23·9 %) and 1929 (31·7 %) subjects, respectively (Tables 1and2). Cluster 1 corresponded to higher intakes of individual catechins, proanthocyanidins, hydroxybenzoic acids and someflavonols, and lower intakes of individual hydroxycinnamic acids. Cluster 2 corresponded to higher intakes of malvidin, dihydromyricetin 3-O-rhamnoside, quercetin, caffeic acid, caffeoyl tartaric acid and tyrosol and lower intakes of apigenin, quercetin 3,4′-O-diglucoside and ferulic acid. Cluster 3 corresponded to higher intakes of the selected flavanones, flavones and lower intakes of individual proanthocyanidins. Cluster 4 corresponded to higher intakes of hydroxycinnaminic acids and lower intakes offlavonols, catechins, flavanones and proanthocyanidins (mea-sured by normal-phase HPLC by degree of polymerisation). Detailed intakes of main classes and subclasses of polyphenols are available in Supplementary Table S3.
Sociodemographic and lifestyle characteristics of participants according to clusters of dietary polyphenol intakes are shown in
Table 3. Compared with other clusters, cluster 1 had the lowest percentage of subjects with no diploma and primary education and had the highest mean age. Cluster 2 had the highest percent-age of subjects with irregular physical activity, as well as subjects with the highest BMI. Cluster 3 had the highest percentage of subjects with university education and the lowest percentage of smokers, the lowest mean age and lowest BMI. Cluster 4 had the highest percentage of subjects with no diploma or pri-mary education, the highest percentage of smokers and the high-est percentage of subjects with≥1 h equivalent walking/d.
Consumption of food groups across clusters is shown in
Table 4. Cluster 1 was characterised by very high consumption of tea and low consumption of coffee, sweetened beverages, starchy foods (pasta, rice, potatoes), meat, processed meat and snacks (sweet and savoury). Cluster 2 was characterised by a high consumption of wine, and low consumption of bread and legumes, dairy products, fruit and vegetables,fish and low Mediterranean Diet Scores. Cluster 3 was charac-terised by high consumption of almost all food groups, but more importantly of fruit, vegetables,fish, milk and dairy pro-ducts and starchy foods, but also sweetened beverages and snacks. It was also characterised by a high Mediterranean Diet Score. It also had the lowest consumption of wine. Cluster 4 was characterised by high consumption of coffee, spirits and beer, meat and processed meat, and low consump-tion of tea, milk and breakfast cereals.
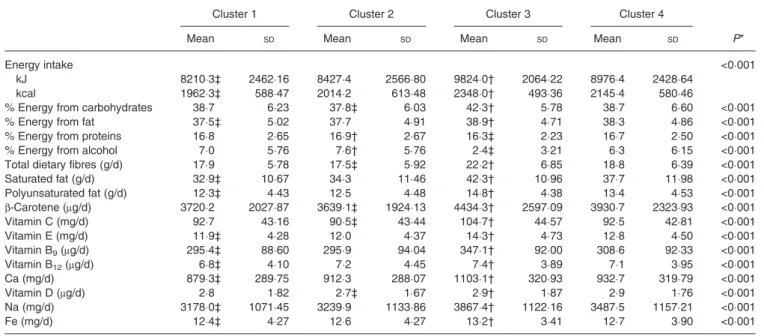
Nutrient intakes across clusters are shown in Table 5. Cluster 1 had the lowest energy intake, and the lowest intakes of saturated and polyunsaturated fat, as well as lowest intakes of vitamins E and B9, Ca, Na and Fe. Cluster 2 had the lowest
energy intake from carbohydrates, highest energy intake from proteins and alcohol; cluster 2 had the lowest intake of dietary fibres, β-carotene, vitamin C and vitamin D. Cluster 3 had the highest energy intake, highest energy intake from
Fig. 1. Flowchart of inclusion in the study. SU.VI.MAX, SUpplementation en VItamines et Minéraux AntioXydants.
3
carbohydrates and fat, and the lowest energy intake from pro-teins and alcohol and the highest intakes of all nutrients:fibres, saturated and polyunsaturated fat, vitamins and trace elements. Participants in cluster 4 did not have particularly high or low nutrient intakes compared with other clusters.
Discussion
Using detailed dietary data from a large sample from the gen-eral population, we were able to identify specific profiles of
polyphenol intake. Given the fact that most polyphenol com-pounds share food sources, ascertaining independent effects of dietary components is often subject to multicollinearity and therefore challenging. Thus, it is difficult to disentangle the potential effect of each individual polyphenol and of over-all dietary polyphenols from the effect of other food constitu-ents (such as antioxidant vitamins and minerals) provided by the same vector food.
Our results show that individual polyphenols from a single subclass can be associated with different patterns of intakes
Table 1. Intake of fifty individual polyphenols for the identified clusters – flavonoid compounds* (Mean values and standard deviations)
Cluster 1 Cluster 2 Cluster 3 Cluster 4
Mean SD Mean SD Mean SD Mean SD P†
n 1352 1355 1456 1929 % 22·2 22·2 23·9 31·7 Flavonoids Flavanones Hesperidin (mg/d) 16·8 19·10 16·7 18·88 17·5‡ 21·79 15·8§ 19·02 0·08 Narirutin (mg/d) 3·5 3·96 3·4 3·91 3·6‡ 4·52 3·3§ 3·95 0·08 Didymin (mg/d) 3·8 4·38 3·8 4·33 4·0‡ 5·00 3·6§ 4·37 0·08 Flavones Apigenin 6,8-di-C-glucoside (mg/d) 3·6 4·09 3·6 4·04 3·7‡ 4·66 3·4§ 4·07 0·08 Apigenin arabinoside-glucoside (mg/d) 10·4 4·32 9·9§ 3·84 11·1‡ 5·55 10·4 4·72 <0·001 Apigenin galactoside-arabinoside (mg/d) 16·1 7·51 15·2§ 6·58 17·3‡ 9·64 16·0 8·13 <0·001 Flavonols Quercetin (mg/d) 3·5 1·72 3·5‡ 1·72 2·4§ 2·21 3·1 2·02 <0·001 Quercetin 3-O-galactoside (mg/d) 3·6‡ 2·58 2·5 2·14 3·1 2·59 2·1§ 1·82 <0·001 Quercetin 3-O-glucoside (mg/d) 5·1‡ 2·97 3·8 2·41 2·4§ 2·55 2·5 1·92 <0·001 Quercetin 3-O-rhamnoside (mg/d) 3·3‡ 1·54 3·3 1·60 1·5§ 1·13 2·8 1·75 <0·001 Quercetin 3-O-rutinoside (mg/d) 7·6‡ 4·93 5·5 3·88 5·0 4·66 4·0§ 3·02 <0·001 Quercetin 3,4′-O-diglucoside (mg/d) 5·3 3·11 5·2§ 3·44 5·7‡ 4·01 5·2§ 3·50 <0·001 Kaempferol 3-O-glucoside (mg/d) 4·3‡ 2·92 3·0 2·34 2·2 2·63 1·9§ 1·87 <0·001 Quercetin 4′-O-glucoside (mg/d) 3·4 2·02 3·4 2·24 3·7‡ 2·61 3·4§ 2·28 <0·001 Anthocyanins Cyanidin 3-O-rutinoside (mg/d) 11·9 19·59 10·6 20·37 12·2‡ 23·21 10·2§ 18·85 0·01 Pelargonidin 3-O-glucoside (mg/d) 6·3 7·61 5·7 7·09 6·5‡ 8·24 5·6§ 7·22 0·002 Malvidin 3-O-glucoside (mg/d) 17·7 12·43 18·0‡ 12·85 1·8§ 6·02 13·1 14·07 <0·001 Malvidin 3-O-(6′′-acetyl-glucoside) (mg/d) 6·3 4·42 6·4‡ 4·61 0·5§ 1·86 4·6 5·00 <0·001 Dihydroflavonols Dihydromyricetin 3-O-rhamnoside (mg/d) 7·5 5·53 7·7‡ 5·82 0·2§ 1·97 5·5 6·27 <0·001 Flavanols Catechins (+)-Catechin (mg/d) 22·5‡ 9·88 19·6 9·36 10·1§ 7·65 14·7§ 9·72 <0·001 (−)-Epicatechin (mg/d) 30·9‡ 14·95 24·0 12·18 22·4 15·94 19·1§ 10·09 <0·001 (+)-Gallocatechin (mg/d) 27·7‡ 30·80 12·9 22·43 18·0 27·77 5·0§ 12·60 <0·001 (−)-Epigallocatechin (mg/d) 24·7‡ 27·43 11·5 19·97 16·1 24·74 4·5§ 11·23 <0·001 (−)-Epicatechin 3-O-gallate (mg/d) 19·4‡ 20·03 9·7 14·62 11·9 18·12 4·2§ 8·26 <0·001 (−)-Epigallocatechin 3-O-gallate (mg/d) 32·5‡ 36·34 15·0 26·47 21·2 32·76 5·7§ 14·87 <0·001 Proanthocyanidins, by DP-HPLC Proanthocyanidins by DP-HPLC (>10mers) (mg/d) 88·9‡ 49·00 81·7 41·08 81·6 78·09 77·5§ 44·69 <0·001 Proanthocyanidins by DP-HPLC (4–6mers) (mg/d) 58·4‡ 32·17 54·5 28·80 56·0 54·21 52·8§ 32·86 <0·001 Proanthocyanidins by DP-HPLC (7–10mers) (mg/d) 39·7‡ 21·15 37·1 18·64 36·5 33·52 35·5§ 20·79 <0·001 Proanthocyanidins Procyanidin dimer B1 (mg/d) 20·6‡ 11·51 16·1 10·20 11·6§ 11·27 12·0 10·07 <0·001 Procyanidin dimer B2 (mg/d) 25·3‡ 10·97 22·2 10·43 17·0§ 12·17 19·0 11·19 <0·001 Procyanidin dimer B3 (mg/d) 17·7‡ 11·59 17·5 12·23 1·9§ 4·28 12·4 13·18 <0·001 Procyanidin dimer B4 (mg/d) 16·7‡ 9·80 14·6 9·92 3·3§ 5·37 9·7 10·30 <0·001 Procyanidin trimer C1 (mg/d) 8·6‡ 4·18 7·3 3·78 4·0§ 3·81 5·6 4·17 <0·001 Procyanidin trimer T2 (mg/d) 11·1‡ 8·28 11·5 8·73 0·3§ 2·93 8·1 9·37 <0·001
DP-HPLC, normal-phase HPLC by degree of polymerisation.
* Mean intakes are calculated from residuals after taking into account energy intake. † P value from mean comparison by ANOVA.
‡ Clusters with the highest mean intake of individual polyphenols. § Clusters with the lowest mean intake of individual polyphenols.
4
journals.cambridge.org/jns
https://doi.org/10.1017/jns.2016.16
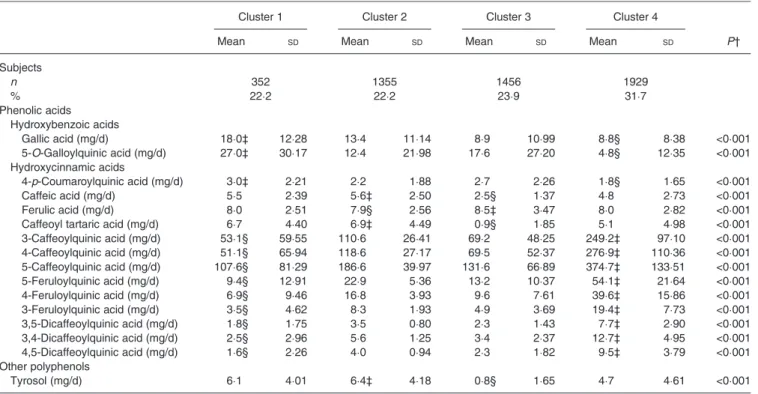
Table 2. Intake of fifty individual polyphenols for the identified clusters – phenolic acids and other polyphenols* (Mean values and standard deviations; number of subjects and percentages)
Cluster 1 Cluster 2 Cluster 3 Cluster 4
Mean SD Mean SD Mean SD Mean SD P†
Subjects n 352 1355 1456 1929 % 22·2 22·2 23·9 31·7 Phenolic acids Hydroxybenzoic acids Gallic acid (mg/d) 18·0‡ 12·28 13·4 11·14 8·9 10·99 8·8§ 8·38 <0·001 5-O-Galloylquinic acid (mg/d) 27·0‡ 30·17 12·4 21·98 17·6 27·20 4·8§ 12·35 <0·001 Hydroxycinnamic acids 4-p-Coumaroylquinic acid (mg/d) 3·0‡ 2·21 2·2 1·88 2·7 2·26 1·8§ 1·65 <0·001 Caffeic acid (mg/d) 5·5 2·39 5·6‡ 2·50 2·5§ 1·37 4·8 2·73 <0·001 Ferulic acid (mg/d) 8·0 2·51 7·9§ 2·56 8·5‡ 3·47 8·0 2·82 <0·001
Caffeoyl tartaric acid (mg/d) 6·7 4·40 6·9‡ 4·49 0·9§ 1·85 5·1 4·98 <0·001
3-Caffeoylquinic acid (mg/d) 53·1§ 59·55 110·6 26·41 69·2 48·25 249·2‡ 97·10 <0·001 4-Caffeoylquinic acid (mg/d) 51·1§ 65·94 118·6 27·17 69·5 52·37 276·9‡ 110·36 <0·001 5-Caffeoylquinic acid (mg/d) 107·6§ 81·29 186·6 39·97 131·6 66·89 374·7‡ 133·51 <0·001 5-Feruloylquinic acid (mg/d) 9·4§ 12·91 22·9 5·36 13·2 10·37 54·1‡ 21·64 <0·001 4-Feruloylquinic acid (mg/d) 6·9§ 9·46 16·8 3·93 9·6 7·61 39·6‡ 15·86 <0·001 3-Feruloylquinic acid (mg/d) 3·5§ 4·62 8·3 1·93 4·9 3·69 19·4‡ 7·73 <0·001 3,5-Dicaffeoylquinic acid (mg/d) 1·8§ 1·75 3·5 0·80 2·3 1·43 7·7‡ 2·90 <0·001 3,4-Dicaffeoylquinic acid (mg/d) 2·5§ 2·96 5·6 1·25 3·4 2·37 12·7‡ 4·95 <0·001 4,5-Dicaffeoylquinic acid (mg/d) 1·6§ 2·26 4·0 0·94 2·3 1·82 9·5‡ 3·79 <0·001 Other polyphenols Tyrosol (mg/d) 6·1 4·01 6·4‡ 4·18 0·8§ 1·65 4·7 4·61 <0·001
* Mean intakes are calculated from residuals after taking into account energy intake. † P value from mean comparison by ANOVA.
‡ Clusters with the highest mean intake of individual polyphenols. § Clusters with the lowest mean intake of individual polyphenols.
Table 3. Characteristics of the study population by polyphenol cluster (n 6092) (Number of subjects and percentages; mean values and standard deviations)
Cluster 1 Cluster 2 Cluster 3 Cluster 4
n % n % n % n % P* Subjects 1352 22·2 1355 22·2 1456 23·9 1929 31·7 Sex Men 537 39·7 587 43·3 618 42·4 831 43·1 0·19 Women 815† 60·3 768‡ 56·7 838 57·6 1098 56·9 Educational level
No diploma and primary 229‡ 17·1 291 21·9 282 19·7 443† 23·3 <0·0001
Secondary 551 41·2 522 39·3 538 37·5 718 37·8 University 557 41·7 516 38·8 614† 42·8 737 38·8 Smoking status Never smoker 678 51·4 585 45·0 846 60·0 730 39·0 <0·0001 Former smoker 488 37·0 548 42·1 466 33·0 785 42·0 Current smoker 154 11·7 168 12·9 98‡ 7·0 355† 19·0 Physical activity Irregular 326 24·4 350† 26·5 319‡ 22·4 483 25·4 0·01 <1 h walking/d 429 32·1 418 31·7 476† 33·4 540‡ 28·4 ≥1 h walking/d 582 43·5 552‡ 41·8 631 44·2 877† 46·2 Age (years) <0·0001 Mean 49·5† 49·4 47·9‡ 48·4 SD 6·37 6·16 6·64 6·28 BMI (kg/m2) <0·0001 Mean 23·8 24·3† 23·6‡ 24·2 SD 3·50 3·61 3·64 3·62
*P from mean comparison by ANOVA.
† Clusters with the highest mean intake of individual polyphenols. ‡ Clusters with the lowest mean intake of individual polyphenols.
5
Table 4. Food group intake (g/d) by polyphenol cluster (n 6092) (Mean values and standard deviations)
Cluster 1 Cluster 2 Cluster 3 Cluster 4
Mean SD Mean SD Mean SD Mean SD P*
Coffee 74·4‡ 110·47 191·6 51·13 119·5 90·82 462·6† 185·74 <0·001
Tea 260·6† 286·03 121·7 207·76 156·8 258·84 43·3‡ 111·73 <0·001
Spirits 18·7 36·43 21·8 34·27 15·0 32·14 23·2† 45·91 <0·001
Beer and cider 29·4 62·94 36·9 78·89 33·5 91·40 39·7† 83·56 0·002
Wine 194·5 191·74 208·6† 190·73 61·3‡ 93·72 168·6 188·12 <0·001 Sweetened beverages 14·0‡ 32·40 14·5 36·85 23·5† 58·73 19·4 47·80 <0·001 Fruit juice 40·8 61·49 39·3‡ 61·32 43·8† 62·35 39·5 59·71 0·16 Vegetables juice 1·0 7·33 0·8 5·06 1·3 10·44 1·1 10·13 0·40 Breakfast cereals 6·5 13·23 5·7 13·57 8·1† 16·64 4·9‡ 11·84 <0·001 Flour 3·2 2·64 2·9‡ 2·53 3·9† 3·26 3·2 2·83 <0·001 Pasta, rice 52·8‡ 38·23 54·3 40·21 69·0† 52·55 58·1 41·30 <0·001 Potatoes 65·4‡ 44·93 68·0 45·94 84·0† 60·41 76·5 55·93 <0·001 Bread 110·1 60·77 109·2‡ 63·13 147·0† 70·98 123·9 66·37 <0·001 Legumes 10·7 15·41 10·4‡ 15·38 13·6† 18·74 11·5 16·82 <0·001 Milk 110·4 129·94 135·9 127·93 197·4† 162·58 96·1‡ 131·31 <0·001 Yogurt 73·6 64·79 70·0‡ 64·51 80·4† 67·79 76·4 72·78 0·001 Cream cheese 18·3 31·38 16·7‡ 28·18 20·7† 33·99 19·3 32·32 0·006 Cheese 42·3‡ 27·64 43·1 28·50 50·1† 32·12 48·6 33·09 <0·001 Fruit 182·7 111·82 172·1‡ 107·99 216·8† 131·86 184·1 120·62 <0·001 Dried fruit 3·7 5·77 3·0‡ 4·17 4·6† 6·48 3·3 5·37 <0·001 Vegetables 200·5 77·11 198·5‡ 80·79 226·4† 90·20 208·8 87·84 <0·001 Animal fat 17·7 10·37 17·3‡ 10·55 23·5† 12·64 20·6 11·95 <0·001 Vegetable fat 18·3‡ 9·23 18·3‡ 9·00 21·0† 10·19 19·2 9·41 <0·001 Fish 34·8 25·82 32·6‡ 25·01 35·7† 27·74 32·8 26·06 0·002 Seafood 11·0 14·49 10·8 13·86 9·8 15·00 10·7 14·69 0·1 Meat 112·1‡ 47·00 118·1 48·85 120·9 49·54 125·1† 50·63 <0·001 Processed meat 25·2‡ 20·11 27·5 22·31 29·8† 23·25 29·8† 22·32 <0·001 Salty snacks 4·7‡ 4·42 5·3 5·30 6·1† 6·16 5·6 5·59 <0·001
Sweets and snacks 80·1‡ 46·96 84·7 47·79 115·5† 55·83 95·3 54·25 <0·001
Mediterranean Diet Score 4·53 1·57 4·27 1·60 4·56 1·57 4·53 1·52 <0·001
*P value from mean comparison by ANOVA.
† Clusters with the highest mean intake of individual polyphenols. ‡ Clusters with the lowest mean intake of individual polyphenols.
Table 5. Nutrient intake by polyphenol cluster (n 6092) (Mean values and standard deviations)
Cluster 1 Cluster 2 Cluster 3 Cluster 4
Mean SD Mean SD Mean SD Mean SD P*
Energy intake <0·001
kJ 8210·3‡ 2462·16 8427·4 2566·80 9824·0† 2064·22 8976·4 2428·64
kcal 1962·3‡ 588·47 2014·2 613·48 2348·0† 493·36 2145·4 580·46
% Energy from carbohydrates 38·7 6·23 37·8‡ 6·03 42·3† 5·78 38·7 6·60 <0·001
% Energy from fat 37·5‡ 5·02 37·7 4·91 38·9† 4·71 38·3 4·86 <0·001
% Energy from proteins 16·8 2·65 16·9† 2·67 16·3‡ 2·23 16·7 2·50 <0·001
% Energy from alcohol 7·0 5·76 7·6† 5·76 2·4‡ 3·21 6·3 6·15 <0·001
Total dietary fibres (g/d) 17·9 5·78 17·5‡ 5·92 22·2† 6·85 18·8 6·39 <0·001
Saturated fat (g/d) 32·9‡ 10·67 34·3 11·46 42·3† 10·96 37·7 11·98 <0·001 Polyunsaturated fat (g/d) 12·3‡ 4·43 12·5 4·48 14·8† 4·38 13·4 4·53 <0·001 β-Carotene (μg/d) 3720·2 2027·87 3639·1‡ 1924·13 4434·3† 2597·09 3930·7 2323·93 <0·001 Vitamin C (mg/d) 92·7 43·16 90·5‡ 43·44 104·7† 44·57 92·5 42·81 <0·001 Vitamin E (mg/d) 11·9‡ 4·28 12·0 4·37 14·3† 4·73 12·8 4·50 <0·001 Vitamin B9(μg/d) 295·4‡ 88·60 295·9 94·04 347·1† 92·00 308·6 92·33 <0·001 Vitamin B12(μg/d) 6·8‡ 4·10 7·2 4·45 7·4† 3·89 7·1 3·95 <0·001 Ca (mg/d) 879·3‡ 289·75 912·3 288·07 1103·1† 320·93 932·7 319·79 <0·001 Vitamin D (μg/d) 2·8 1·82 2·7‡ 1·67 2·9† 1·87 2·9 1·76 <0·001 Na (mg/d) 3178·0‡ 1071·45 3239·9 1133·86 3867·4† 1122·16 3487·5 1157·21 <0·001 Fe (mg/d) 12·4‡ 4·27 12·6 4·27 13·2† 3·41 12·7 3·90 <0·001
*P value from mean comparison by ANOVA.
† Clusters with the highest mean intake of individual polyphenols. ‡ Clusters with the lowest mean intake of individual polyphenols.
6
journals.cambridge.org/jns
https://doi.org/10.1017/jns.2016.16
(for example, individualflavonols are associated with three dif-ferent clusters). However, to date, polyphenol intakes have been mostly investigated as classes and subclasses (flavonoids, anthocyanins or‘coffee polyphenols’), focusing on major con-tributing foods or relating their intake to specific health out-comes(7,9–14,37,38). In the light of our results, such an approach could lead some elements of differing dietary beha-viours to be integrated into a single indicator. Our study shows that taking into account dietary patterns of polyphenols is crucial, given the observed associations of polyphenol intakes within individuals’ diets. To our knowledge, this is the first study investigating clusters of polyphenol intakes in a general population sample. A holistic approach combining polyphenol intakes in a single a priori score has been recently developed, and has been shown to be associated with the Mediterranean diet and low-grade inflammation(39,40)
. Such an approach is complementary to a posteriori patterns, as it builds on current knowledge on the relationships between polyphenol intakes and health, while our approach aimed at investigating natural occurring associations of dietary polyphe-nols within the population’s diets.
Interestingly, tea appeared as a major discriminant factor for cluster identification. Polyphenols contained in tea include catechins (tea contributing from 15 to 63 % of intake), procya-nidin dimers and trimers (tea contributing from 12 to 48 % of intake),flavonols (kaempferol and quercetin compounds, tea contributing from 3 to 56 % of intake) and theaflavins (tea contributing to 100 % of their intake). However, only four catechins out of thefifty selected individual polyphenols for analyses had tea as their main food source; for these five, tea contributed to about 55 % of intake for each (see Supplementary Tables S1 and S2). Besides, cluster 1 was char-acterised by high levels of other polyphenol intakes (proantho-cyanidins and quercetin compounds) for which tea appeared but as a minor contributor. Conversely, specific flavonoid compounds of tea, theaflavins, which are obtained through tea leaf processing, were not consumed in the population in sufficiently high amounts to be included in the individual poly-phenols selected for the MCA procedure(41). Tea is one of the major sources of polyphenols in Western diets(7,9,12,37). In a study using a sample of subjects from the National Health and Nutrition Examination Survey (NHANES), 21·3 % of the population consumed tea(37), yet tea was the major poly-phenol source for the whole sample(9). Consistent with our results, tea consumers had higher intakes of flavonols and catechins(37). Moreover, sociodemographic profiles identified in the NHANES were similar to those from our study, as tea consumers were more likely to be women and older; how-ever, they also tended to have lower levels of physical activity, which was not observed in our cluster 1(37). Similarly, in the European Prospective Investigation into Cancer and Nutrition (EPIC) study, determinants of intake of theaflavins were higher diplomas and lower BMI(11).
Opposing consumptions were observed between tea and coffee. Coffee and tea compete with each other at a world level, countries having a preference for either one beverage or the other(42). However, competing patterns of consumption have not always been identified at the individual level. Frary
et al. analysed patterns of beverage consumption in the USA, and among the six identified clusters, one included consumers of both tea and coffee(43). However, although the USA shares Europe’s preference for coffee over tea(42)
, overall beverage consumption patterns differ(44).
Cluster 4 was characterised by high intakes of coffee, beer and spirits associated with smoking. Paired associations between alcohol and tobacco have long been identified(45)
, as well as a clustering of risky behaviours in smokers: smokers tend to have higher intakes of alcohol, unhealthier diets and lower levels of physical activity(46,47). Paired associations have also been observed between coffee intake and smoking, and alcohol consumption and coffee intake(45,48). Consistent with our results, associations were observed in the French pro-spective cohort study E3N-EPIC (Etude Epidémiologique auprès des femmes de la Mutuelle Générale de l’Education Nationale – European Prospective Investigation into Cancer and Nutrition) between alcohol intake, smoking status and consumption of coffee(49). Moreover, as in cluster 4, alcohol consumption was associated with intakes of processed meat(49). This clustered association between coffee, smoking and alcohol, could in part explain the conflicting results observed in the associations between coffee intake and CVD(50,51).
Cluster 2 was characterised by high consumption of wine, intermediate consumption of both coffee and tea and low con-sumption of other food groups. Cluster 3 was characterised by high consumption in almost all food groups considered. Our results confirm that results from single sources of polyphenols, such as tea, coffee or wine, should be considered with caution, given the high level of correlations observed in intakes of these polyphenols. Approaching these correlations through the iden-tification of profiles of intake should allow for complementary information as to the association between polyphenols and mortality and health events, taking into account interactions and confounding with sociodemographic factors (sex in particular).
The most consumed polyphenols identified in our sample were in accordance with previous results from the same popu-lation(13). In the EPIC study, which used also in part data from the Phenol-Explorer Database, intakes of catechins in the French sample were somewhat lower, but comparable with intakes in our study(11). Comparison with other populations is, however, difficult, due to the heterogeneity in the food composition data used (for example, in the Finnish cohort, only aglycone compounds were considered in the analyses)(12). Strengths of our study include the use of very detailed and validated dietary information, from repeated 24 h dietary records. Seasonality in intakes was taken into account, through the balanced number of dietary records available for each sub-ject. Moreover, we used comprehensive data from the Phenol-Explorer Database, which builds on current scientific literature to expand data on individual polyphenol content of foods(2).
The present study is subject to limitations. Dietary assess-ment is based on self-reported data, and therefore subject to some subjectivity on portion size estimation or subject to desirability or memory bias. Polyphenol content of foods
7
can vary considerably depending on various factors such as the degree of ripeness of fruits and vegetables, the degree of sun-light exposure, storage conditions or culinary methods which could not be assessed in our sample(7). Moreover, the Phenol-Explorer Database is based on scientific publications on the content in polyphenols of foods in the English lan-guage, which could lead to a selection bias of data excluding some from European countries. Finally, our sample popula-tion was selected from a study including middle-aged partici-pants that started in 1994–1996. Profiles of polyphenol intakes could have changed in the general population since then. Moreover, the analyses were conducted on a sample of the total population in the cohort, thus limiting the represen-tativeness of our analyses. Repeated analyses on a different sample population could allow us to confirm our results.
Conclusion
Patterns of polyphenol intakes were identified from a large sample from the general population. Future studies should investigate the association between such patterns and subse-quent health outcomes, in order to identify meaningful combi-nations of polyphenols within the diet.
Supplementary material
The supplementary material for this article can be found at
http://dx.doi.org/10.1017/jns.2016.16
Acknowledgements
C. J. developed the overall research plan, conducted research, performed statistical analyses, wrote the paper and had primary responsibility for final content. E. K. G. participated in project conception, development of the overall research plan, critically reviewed the manuscript and supervised research. M. T. C. L. and L. F. participated in the development of the research plan and critically reviewed the manuscript. S. H. designed the SU.VI.MAX study, provided essential material and critically reviewed the manuscript. All authors read and approved the final manuscript.
All authors report no conflicts of interests.
References
1. Perez-Jimenez J, Neveu V, Vos F, et al. (2010) Systematic analysis of the content of 502 polyphenols in 452 foods and beverages: an application of the Phenol-Explorer Database. J Agric Food Chem 58, 4959–4969.
2. Neveu V, Perez-Jimenez J, Vos F, et al. (2010) Phenol-Explorer: an online comprehensive database on polyphenol contents in foods. Database (Oxford) 2010, bap024.
3. Manach C, Williamson G, Morand C, et al. (2005) Bioavailability and bioefficacy of polyphenols in humans. I. Review of 97 bioavail-ability studies. Am J Clin Nutr 81, Suppl., 230S–242S.
4. Loke WM, Proudfoot JM, Stewart S, et al. (2008) Metabolic trans-formation has a profound effect on anti-inflammatory activity of flavonoids such as quercetin: lack of association between antioxi-dant and lipoxygenase inhibitory activity. Biochem Pharmacol 75, 1045–1053.
5. Lafay S, Morand C, Manach C, et al. (2006) Absorption and metab-olism of caffeic acid and chlorogenic acid in the small intestine of rats. Br J Nutr 96, 39–46.
6. Nielsen ILF, Chee WSS, Poulsen L, et al. (2006) Bioavailability is improved by enzymatic modification of the citrus flavonoid hesper-idin in humans: a randomized, double-blind, crossover trial. J Nutr 136, 404–408.
7. Manach C, Scalbert A, Morand C, et al. (2004) Polyphenols: food sources and bioavailability. Am J Clin Nutr 79, 727–747. 8. Brat P, George S, Bellamy A, et al. (2006) Daily polyphenol intake in
France from fruit and vegetables. J Nutr 136, 2368–2373. 9. Chun OK, Chung SJ & Song WO (2007) Estimated dietary
flavon-oid intake and major food sources of US adults. J Nutr 137, 1244– 1252.
10. Dilis V & Trichopoulou A (2010) Antioxidant intakes and food sources in Greek adults. J Nutr 140, 1274–1279.
11. Knaze V, Zamora-Ros R, Lujan-Barroso L, et al. (2012) Intake esti-mation of total and individualflavan-3-ols, proanthocyanidins and theaflavins, their food sources and determinants in the European Prospective Investigation into Cancer and Nutrition (EPIC) study. Br J Nutr 108, 1095–1108.
12. Ovaskainen ML, Torronen R, Koponen JM, et al. (2008) Dietary intake and major food sources of polyphenols in Finnish adults. J Nutr 138, 562–566.
13. Perez-Jimenez J, Fezeu L, Touvier M, et al. (2011) Dietary intake of 337 polyphenols in French adults. Am J Clin Nutr 93, 1220– 1228.
14. Wang Y, Chung SJ, Song WO, et al. (2011) Estimation of daily proanthocyanidin intake and major food sources in the U.S. Diet. J Nutr 141, 447–452.
15. Zamora-Ros R, Knaze V, Lujan-Barroso L, et al. (2011) Estimated dietary intakes of flavonols, flavanones and flavones in the European Prospective Investigation into Cancer and Nutrition (EPIC) 24 hour dietary recall cohort. Br J Nutr 106, 1915–1925. 16. Zamora-Ros R, Andres-Lacueva C, Lamuela-Raventos RM, et al.
(2010) Estimation of dietary sources and flavonoid intake in a Spanish adult population (EPIC-Spain). J Am Diet Assoc 110, 390–398.
17. Zamora-Ros R, Knaze V, Lujan-Barroso L, et al. (2011) Estimation of the intake of anthocyanidins and their food sources in the European Prospective Investigation into Cancer and Nutrition (EPIC) study. Br J Nutr 106, 1090–1099.
18. Arts ICW & Hollman PCH (2005) Polyphenols and disease risk in epidemiologic studies. Am J Clin Nutr 81, Suppl., 317S–325S. 19. Erdman JW, Balentine D, Arab L, et al. (2007) Flavonoids and heart
health: proceedings of the ILSI North America Flavonoids Workshop, May 31–June 1, 2005, Washington, DC. J Nutr 137, Suppl., 718S–737S.
20. Gonzalez R, Ballester I, Lopez-Posadas R, et al. (2011) Effects of flavonoids and other polyphenols on inflammation. Crit Rev Food Sci Nutr 51, 331–362.
21. Knekt P, Kumpulainen J, Jarvinen R, et al. (2002) Flavonoid intake and risk of chronic diseases. Am J Clin Nutr 76, 560–568. 22. Scalbert A, Manach C, Morand C, et al. (2005) Dietary polyphenols
and the prevention of diseases. Crit Rev Food Sci Nutr 45, 287–306. 23. Tangney CC & Rasmussen HE (2013) Polyphenols, inflammation,
and cardiovascular disease. Curr Atheroscler Rep 15, 324.
24. Chen AY & Chen YC (2013) A review of the dietaryflavonoid, kaempferol on human health and cancer chemoprevention. Food Chem 138, 2099–2107.
25. Kesse-Guyot E, Fezeu L, Andreeva VA, et al. (2012) Total and spe-cific polyphenol intakes in midlife are associated with cognitive function measured 13 years later. J Nutr 142, 76–83.
26. Touvier M, Druesne-Pecollo N, Kesse-Guyot E, et al. (2013) Dual association between polyphenol intake and breast cancer risk according to alcohol consumption level: a prospective cohort study. Breast Cancer Res Treat 137, 225–236.
27. Peters U, Poole C & Arab L (2001) Does tea affect cardiovascular disease? A meta-analysis. Am J Epidemiol 154, 495–503.
8
journals.cambridge.org/jns
https://doi.org/10.1017/jns.2016.16
28. Rimbach G, Melchin M, Moehring J, et al. (2009) Polyphenols from cocoa and vascular health– a critical review. Int J Mol Sci 10, 4290– 4309.
29. Jacobs DR, Gross MD & Tapsell LC (2009) Food synergy: an oper-ational concept for understanding nutrition. Am J Clin Nutr 89, S1543–S1548.
30. Hu FB (2002) Dietary pattern analysis: a new direction in nutrition-al epidemiology. Curr Opin Lipidol 13, 3–9.
31. Moeller SM, Reedy J, Millen AE, et al. (2007) Dietary patterns: challenges and opportunities in dietary patterns research an Experimental Biology workshop, April 1, 2006. J Am Diet Assoc 107, 1233–1239.
32. Hercberg S, Galan P, Preziosi P, et al. (2004) The SU.VI.MAX Study: a randomized, placebo-controlled trial of the health effects of antioxidant vitamins and minerals. Arch Intern Med 164, 2335– 2342.
33. Le Moullec N, Deheeger M, Preziosi P, et al. (1996) Validation du manuel photos utilisé pour l’enquête alimentaire de l’étude SU.VI. MAX (Validation of the photo manual used for the collection of dietary data in the food survey SU.VI.MAX). Cah Nutr Diet 31, 158–164.
34. Hercberg Sc (2005) Table de composition SU.VI.MAX des aliments (Food Composition Table for SU.VI.MAX). Paris: INSERM/ Economica.
35. Trichopoulou A, Costacou T, Bamia C, et al. (2003) Adherence to a Mediterranean diet and survival in a Greek population. N Engl J Med 348, 2599–2608.
36. Willett W & Stampfer MJ (1986) Total energy intake: implications for epidemiologic analyses. Am J Epidemiol 124, 17–27.
37. Song WO & Chun OK (2008) Tea is the major source of flavan-3-ol and flavonol in the US diet. J Nutr 138, 1543–1547. 38. Tresserra-Rimbau A, Medina-Remon A, Perez-Jimenez J, et al.
(2013) Dietary intake and major food sources of polyphenols in a Spanish population at high cardiovascular risk: the PREDIMED study. Nutr Metab Cardiovasc Dis 23, 953–959.
39. Pounis G, Di CA, Bonaccio M, et al. (2016) Flavonoid and lignan intake in a Mediterranean population: proposal for a holistic
approach in polyphenol dietary analysis, the Moli-sani Study. Eur J Clin Nutr 70, 338–345.
40. Pounis G, Bonaccio M, Di CA, et al. (2016) Polyphenol intake is associated with low-grade inflammation, using a novel data analysis from the Moli-sani study. Thromb Haemost 115, 344–352.
41. Subramanian N, Venkatesh P, Ganguli S, et al. (1999) Role of poly-phenol oxidase and peroxidase in the generation of black tea thea-flavins. J Agric Food Chem 47, 2571–2578.
42. Grigg D (2002) The worlds of tea and coffee: patterns of consump-tion. GeoJournal 57, 283–294.
43. Frary CD, Johnson RK & Wang MQ (2005) Food sources and intakes of caffeine in the diets of persons in the United States. J Am Diet Assoc 105, 110–113.
44. Drewnowski A, Rehm CD & Constant F (2013) Water and bever-age consumption among adults in the United States: cross-sectional study using data from NHANES 2005–2010. BMC Public Health 13, 1068.
45. Istvan J & Matarazzo JD (1984) Tobacco, alcohol, and caffeine use – a review of their interrelationships. Psychol Bull 95, 301–326. 46. Chiolero A, Wietlisbach V, Ruffieux C, et al. (2006) Clustering of
risk behaviors with cigarette consumption: a population-based sur-vey. Prev Med 42, 348–353.
47. Dallongeville J, Marecaux N, Fruchart JC, et al. (1998) Cigarette smoking is associated with unhealthy patterns of nutrient intake: a meta-analysis. J Nutr 128, 1450–1457.
48. Tavani A, Bertuzzi M, Negri E, et al. (2001) Alcohol, smoking, cof-fee and risk of non-fatal acute myocardial infarction in Italy. Eur J Epidemiol 17, 1131–1137.
49. Kesse E, Clavel-Chapelon F, Slimani N, et al. (2001) Do eating habits differ according to alcohol consumption? Results of a study of the French cohort of the European Prospective Investigation into Cancer and Nutrition (E3N-EPIC). Am J Clin Nutr 74, 322–327. 50. Bonita JS, Mandarano M, Shuta D, et al. (2007) Coffee and
cardio-vascular disease: in vitro, cellular, animal, and human studies. Pharmacol Res 55, 187–198.
51. Cornelis MC & El-Sohemy A (2007) Coffee, caffeine, and coronary heart disease. Curr Opin Lipidol 18, 13–19.
9