HAL Id: hal-00296256
https://hal.archives-ouvertes.fr/hal-00296256
Submitted on 18 Jun 2007
HAL is a multi-disciplinary open access
archive for the deposit and dissemination of
sci-entific research documents, whether they are
pub-lished or not. The documents may come from
teaching and research institutions in France or
abroad, or from public or private research centers.
L’archive ouverte pluridisciplinaire HAL, est
destinée au dépôt et à la diffusion de documents
scientifiques de niveau recherche, publiés ou non,
émanant des établissements d’enseignement et de
recherche français ou étrangers, des laboratoires
publics ou privés.
A modeling analysis of a heavy air pollution episode
occurred in Beijing
X. An, T. Zhu, Z. Wang, C. Li, Y. Wang
To cite this version:
X. An, T. Zhu, Z. Wang, C. Li, Y. Wang. A modeling analysis of a heavy air pollution episode
occurred in Beijing. Atmospheric Chemistry and Physics, European Geosciences Union, 2007, 7 (12),
pp.3103-3114. �hal-00296256�
www.atmos-chem-phys.net/7/3103/2007/ © Author(s) 2007. This work is licensed under a Creative Commons License.
Chemistry
and Physics
A modeling analysis of a heavy air pollution episode occurred in
Beijing
X. An1,2, T. Zhu1, Z. Wang2, C. Li1, and Y. Wang2
1State Key Joint Laboratory of Environmental Simulation and Pollution Control, Center for Environmental Sciences, Peking
University, Beijing 100871, China
2LAPC/NZC, Institute of Atmospheric Physics, Chinese Academy of Sciences, Beijing 100029, China
Received: 17 July 2006 – Published in Atmos. Chem. Phys. Discuss.: 29 August 2006 Revised: 8 January 2007 – Accepted: 28 May 2007 – Published: 18 June 2007
Abstract. The concentrations of fine particulate matter (PM) and ozone in Beijing often exceed healthful levels in recent years, therefore China is to taking steps to improve Beijing’s air quality for the 2008 Olympic Games. In this paper, the Models-3 Community Multiscale Air Quality (CMAQ) Mod-eling System was used to investigate a heavy air pollution episode in Beijing during 3–7 April 2005 to obtain the basic information of how heavy air pollution formed and the con-tributions of local sources and surround emissions. The mod-eling domain covered from East Asia with four nested grids with 81 to 3 km horizontal resolution focusing on urban Bei-jing. This was coupled with a regional emissions inventory with a 10 km resolution and a local 1 km Beijing emissions database. The trend of predicted concentrations of various pollutants agreed reasonably well with the observations and captured the main features of this heavy pollution episode. The simulated column concentration distribution of PM was correlated well with the MODIS remote sensing products. Control runs with and without Beijing emissions were con-ducted to quantify the contributions of non-Beijing sources (NBS) to the Beijing local air pollution. The contributions of NBS to each species differed spatially and temporally with
the order of PM2.5>PM10>SO2>soil for this episode. The
percentage contribution of NBS to fine particle (PM2.5) in
Beijing was averaged about 39%, up to 53% at the northwest of urban Beijing and only 15% at southwest. The spatial
dis-tribution of NBS condis-tributions for PM10 was similar to that
for PM2.5, with a slightly less average percentage of about
30%. The average NBS contributions for SO2and soil
(di-ameter between 2.5 µm and 10 µm) were 18% and 10%. In addition, the pollutant transport flux was calculated and com-pared at different levels to investigate transport pathway and magnitude. It was found that the NBS contribution correlated
with the transport flux, contributing 60% of PM10
concen-Correspondence to: Z. Wang
(zifawang@mail.iap.ac.cn)
tration in Beijing at the time of transport flux peak during a strong episode with a transport path from southwest to north-east.
1 Introduction
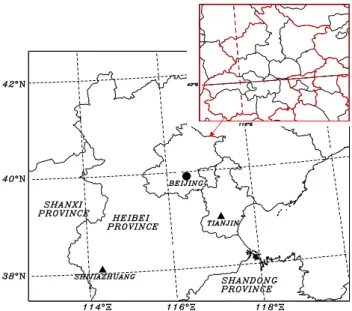
Regional air pollution over Mega-city clusters has been ac-companied with the quick economical expansion in China. Mega-cities are significant sources of aerosols and oxidants, which are important atmospheric components having direct impacts on air quality and climate on a regional and even global scale. It is critical to understand the key chemical and physical processes controlling the concentrations of these species in these polluted regions. As a research hotspot, one of the dominant mega-city clusters is located in Beijing, the capital of China, and its surroundings areas (Fig. 1). With a population more than 14 million, Beijing’s economy growth has been rapidly growing with an annual increasing rate ex-ceeding 10% continuously. For example, the total energy consumption is increased from 38.5 million ton standard coal in 1999 to 45.1 million-ton standard coal in 2002, result-ing in a very serious air pollution problem. After Beijresult-ing succeeded in the competition for the bid to host the 2008 Olympic Games, improving the air quality in Beijing has been one of the most important tasks for the Chinese gov-ernment. After a series of air antipollution measures includ-ing increasinclud-ing the natural gas supply, centralizinclud-ing the heat supply, removing electric heat devices, and using of low sul-fur coals, air quality in Beijing has improved gradually since 1997. The number of days of meeting Air Pollution Stan-dard II or better increased from 56 days in 1998 to 254 days in 2005. However, the average concentration of main con-taminants remained high in the past three years, indicating that emissions controls only in Beijing are not enough to solve the regional pollution problems over Beijing.
Fig. 1. Map of Beijing and surrounding areas.
Several studies pointed out that the regional air pollution in Beijing was caused not only by local sources but also sig-nificantly by non-Beijing sources (Zhang et al., 2004; Xu et al., 2004; Sun et al., 2004). The basin-like geophysi-cal feature of urban Beijing and its unique weather system are the dominant factors influencing air quality (Ren et al., 2004). Su et al. (2004) investigated certain transport path-ways of NBS to Beijing and found that a convergence zone of air pollutants occurred within the atmospheric boundary layer along the combination of the Yanshan-Taihang moun-tains and the North China Plain. The contribution of various emission sources shows a specific structure in spatial distri-bution and depends on the location and weather system.
In order to improve air quality in Beijing with compre-hensive measures, it is necessary to quantitatively evaluate the contribution of NBS so that regional emissions can be controlled more efficiently. This can be achieved through a regional air quality modeling system. Yan et al. (2005)
made a long-term simulation of SO2and discussed the
im-pacts of different types of sources on air quality. The trans-port of pollutants among several cities in North China was investigated by Zhang et al. (2004) with simplified chemical transport model, which considered no chemical reactions in
simulating PM10.
In this study the formation process of a typical heavy air pollution episode in Beijing during 3–7 April 2005 was in-vestigated with the Models-3/CMAQ. This episode clearly showed the typical evolution process of high particle pol-lution over Beijing with continuous several days’ polpol-lution. The temporal and spatial characteristics of the main contami-nants were analyzed with a focus on the contributions of NBS
to SO2, PM10and 15 PM2.5 concentrations in Beijing. The
modeling results were also compared with observations of
0 50 100 150 200 250 300 350 400 0 2 /0 4 /2 0 0 5 0 3 /0 4 /2 0 0 5 0 4 /0 4 /2 0 0 5 0 5 /0 4 /2 0 0 5 0 6 /0 4 /2 0 0 5 0 7 /0 4 /2 0 0 5 0 8 /0 4 /2 0 0 5 API va lu e Chifeng Jinan Taiyuan Shijiazhuang Tianjin Beijing Fig. 2
Fig. 2. API values of Beijing and surrounding cities from 2 to 8
April 2005.
SO2and particle matters at a 325 m meteorological tower
lo-cated on the campus of the Institute of Atmospheric Physics (IAP), meteorological data observed at six monitoring sites in Beijing, and satellite aerosol remote sensing results from NASA.
2 Observations and regional patterns of the high air pollution episode
2.1 Air Pollution Index (API) of Beijing and surrounding
cities
To indicate the air pollution level over the Chinese cities, an Air Pollutant Index (API) is issued every day by SEPA (State Environment Protection Agency of China) with the
monitor-ing data of suspended particulate matter (PM10), sulfur
diox-ide (SO2), and nitrogen dioxide (NO2)(http://www.sepa.gov.
cn). An index value under 100 indicates the air quality of that monitoring station conforms to the National ambient air quality criteria II. A value over 100 will worsen the allergy symptom of unhealthy people. Figure 2 shows the time series of daily API of Beijing and surrounding cities in 2–8 April 2005. An obvious high pollution episode occurred in Beijing with API over 100 lasting more than 4 days from 4–7 April and reaching heavy pollution levels with a maximum API of 350 on 5–6 April.
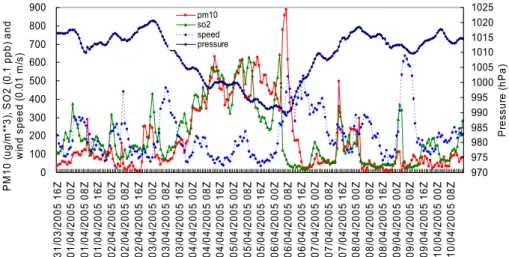
2.2 SO2and particles observed at IAP 325 m tower
Six platforms were made on the IAP tower for simultaneous
collection of samples for analysis of SO2and particulate
mat-ter. The 43CTL instruments of high precision impulse flu-orescence (USA Thermion Environment Corporation) were used for measuring gas at 8 m, 47 m, 120 m, and 280 m. The RP1400a instruments (USA ANPU) were used for measur-ing mass concentration of the particles at 8 m and 240 m. The
available data shown in Fig. 3 for this study include SO2at
0 100 200 300 400 500 600 700 800 900 3 1 /0 3 /2 0 0 5 1 6 Z 0 1 /0 4 /2 0 0 5 0 0 Z 0 1 /0 4 /2 0 0 5 0 8 Z 0 1 /0 4 /2 0 0 5 1 6 Z 0 2 /0 4 /2 0 0 5 0 0 Z 0 2 /0 4 /2 0 0 5 0 8 Z 0 2 /0 4 /2 0 0 5 1 6 Z 0 3 /0 4 /2 0 0 5 0 0 Z 0 3 /0 4 /2 0 0 5 0 8 Z 0 3 /0 4 /2 0 0 5 1 6 Z 0 4 /0 4 /2 0 0 5 0 0 Z 0 4 /0 4 /2 0 0 5 0 8 Z 0 4 /0 4 /2 0 0 5 1 6 Z 0 5 /0 4 /2 0 0 5 0 0 Z 0 5 /0 4 /2 0 0 5 0 8 Z 0 5 /0 4 /2 0 0 5 1 6 Z 0 6 /0 4 /2 0 0 5 0 0 Z 0 6 /0 4 /2 0 0 5 0 8 Z 0 6 /0 4 /2 0 0 5 1 6 Z 0 7 /0 4 /2 0 0 5 0 0 Z 0 7 /0 4 /2 0 0 5 0 8 Z 0 7 /0 4 /2 0 0 5 1 6 Z 0 8 /0 4 /2 0 0 5 0 0 Z 0 8 /0 4 /2 0 0 5 0 8 Z 0 8 /0 4 /2 0 0 5 1 6 Z 0 9 /0 4 /2 0 0 5 0 0 Z 0 9 /0 4 /2 0 0 5 0 8 Z 0 9 /0 4 /2 0 0 5 1 6 Z 1 0 /0 4 /2 0 0 5 0 0 Z 1 0 /0 4 /2 0 0 5 0 8 Z PM 1 0 ( u g /m ** 3 ), SO 2 ( 0 .1 p p b ) a n d w in d sp e e d ( 0 .0 1 m /s) 970 975 980 985 990 995 1000 1005 1010 1015 1020 1025 P re s s u re (h P a ) pm10 so2 speed pressure
Fig. 3. Temporal variations of observed SO2 and particle concentrations of IAP site and average pressure, wind speed of six observations
sites in Beijing from 31 March 2005 16:00 to 10 April 2005 16:00 (UTC).
concentrations were high on 4-6 April, with peak value
ex-ceeding 60 ppb. Hourly variations of PM10 has similar
pat-terns with SO2(Fig. 3), but with much higher levels reaching
300 µg/m3for PM10during 4–6 April, respectively.
2.3 Meteorological patterns and controlling factors
Through the analysis of synoptic meteorological charts for this period, it was found that initial weak winds and stable weather patterns prevailed and later followed by transport of Asian dust from Inner Mongolia on 5 April causing the 4-day high of air pollution mixing of anthropogenic pollutants and natural dust particles. Surface synoptic patterns show that from 4–6 April, there is a strong high pressure system located over Yangtze River with the low in Beijing. This typical kind of surface pattern is unfavorable for pollution in Beijing to diffuse and also it is a typical type of weather pattern caus-ing Beijcaus-ing’s serious pollution. Detailed analyzcaus-ing the syn-optic chart during this period, on 500 hPa chart, at 00:00 Z on 4 April of 2005, Beijing was in strong northwest flow at the back of the East Asia groove. On surface chart, there was a strong high-pressure center located at the southeast of China (Yangtze area), and Beijing lay at the top of the high-pressure. From 500 hPa chart at 00:00 Z on 5 April, we could see Beijing was in southwest flow at the front of a groove. Corresponding to 850 hPa and surface of the same time, the high-pressure center still existed, and from surface to high altitude, wind direction of Beijing was southwest. When it came to 06:00 Z, on 5 April, there was a Mongolia cyclone on 500 hPa altitude, and on surface, there were cold front, strong wind and dust storm area in the middle part of Mon-golia. And along with the synoptic systems moved to east, later it influenced Beijing area.
By analyzing the variance of average meteorological el-ements such as pressure and wind speed (Fig. 3) averaged over six observation stations in Beijing from 3–7 April, it was
found that the average surface pressure of the six stations was lower than 1010 hPa. During the period of 3 April, 16:00 Z to 6 April, 04:00 Z UTC, the average surface wind speed was lower than 2 m/s, which caused pollutions to accumulate and reached heavy pollution levels with an API more than 350 on
5–6 April. Consequently, the observed SO2and PM10
con-centrations at the IAP site were also very high during this period.
3 Model description and validation
The Models-3/CMAQ, which is developed by the U.S. EPA (Byue, et al., 1999), has already been widely used all over the world especially in North America and East Asia. It has suc-cessfully applied to investigate the Asian continental outflow of carbon monoxide, ozone, and aerosol sulfate to the west-ern Pacific Ocean by a number of serious researches (Zhang et al., 2002; Uno et al., 2005; Yamaji et al., 2006).
3.1 Model setup
In this study, we use the NCAR/Penn State Mesoscale Model (MM5) (Grell et al., 1994), which is based on MRF scheme for the boundary layer process, Grell scheme for convec-tive motion, cloud-cooling scheme for radiation, and some other physical parameterized schemes, to generate the me-teorological fields for CMAQ. The outputted meme-teorological factors are mainly contained of temperature, wind, humid-ity, pressure, and other parameters requested by CMAQ. The
NCAR/NCEP reanalysis data, four times a day with 1◦
×1◦
resolution, were used for initial and boundary conditions in MM5 model.
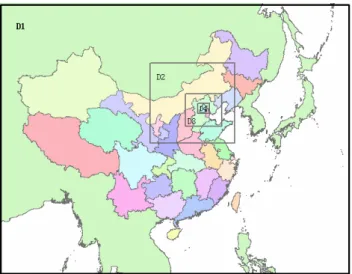
Four nested grids at the horizontal resolution of 81 km, 27 km, 9 km and 3 km with the same center located at
Table 1. Emissions of major anthropogenic species in this study (Unit: ton/year). Region VOC SO2 NOx CO PM10 PM2.5 NH3 Beijing Municipality 285 551 211 306 227 311 1 021 790 106 890 53 367 69 068 Tianjin Municipality 270 000 375 876 178 940 737 041 93 497 37 996 49 981 Hebei Province 855 000 1 353 731 686 000 6 806 000 535 055 264 052 846 462 Shanxi Province 401 000 1 467 410 558 000 3 254 000 173 848 66 899 214 950 Shandong Province 1 088 000 1 575 245 812 000 7 339 000 684 824 379 516 1 093 000
Fig. 4. The four nested domains used for simulation.
study (Fig. 4). The coarse domain covers East Asia with 83×65 horizontal grids and the second domain with 61×58 grids includes most provinces of North China. The third do-main with 79×70 grids consists of Beijing and the surround-ing cities, and the focus of the fourth domain with 73×64 grids on urban Beijing. From the first to the fourth domain, the time step is 240 s, 80 s, 26.67 s and 8.89 s. Thirty levels were unequally distributed in the vertical from the ground to a level of 100 hPa in MM5. And there are 12 vertical lay-ers extending from the surface to approximately 12 km in CMAQ, which are reduced from 30 sigma levels of MM5 us-ing the mass-weighted averagus-ing algorithms for reducus-ing the computational costs. Vertical layers of CMAQ are unevenly distributed and surface layer is approximately 35 m. We used the Grell cumulus parameterization, simple ice physics, and the MRF planetary boundary layer in MM5.
The Sparse Matrix Operator Kernel Emissions (SMOKE, 2005) model was applied to prepare the emission inventory and generate gridded emission data for the CMAQ model. There are two emission inventory data are used in this study for SMOKE processing: the regional data from Streets et al. (2003, and personal communications) with 10 km resolu-tion updated from the TRACE P emissions inventory, and a detailed local source emissions database of Beijing city with
1 km resolution for point, mobile, area, and others sources based on reports of National Projects on Beijing Air Qual-ity Controls. The selected pollutant emissions used in the modeling for Beijing, Tianjin, and the neighboring provinces (Hebei, Shanxi and Shandong) are summarized in Table 1. Figure 5 presents SMOKE output of emission used in the third domain, clearly showing high anthropogenic emissions
of CO, NOxand SO2distributed in urban area of Beijing and
Tianjin.
The selected simulation period for analysis is from 2 to 8 April 2005, with 10-day spin-up from 23 March. First three sensitivity runs were conducted to test the uncertainties of NBS emissions impact on Beijing’s pollution. In three cases, emissions of local Beijing sources with unchanged, Case 1 with emissions of NBS keeping unchangeable (base run, BR); Case 2 with reduced 50% emissions of NBS, and Case 3 with added 50% emissions of NBS. And then a con-trol run (CR) with only NBS was performed and compared with BR to evaluate the impact of NBS on air pollution in Beijing. All of these simulations were conducted with the same meteorological fields produced by MM5.
3.2 Meteorological comparison of model results with
ob-servations
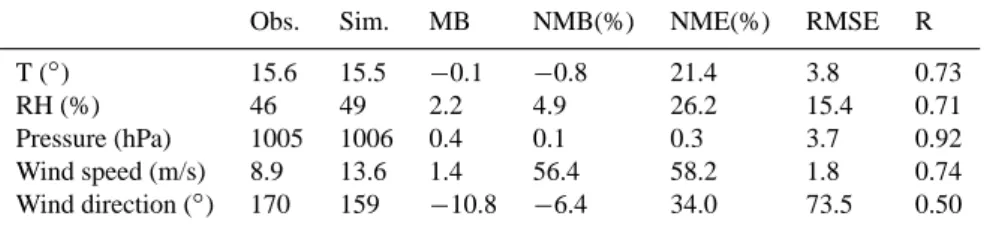
The rationality of MM5’s meteorological simulations of this case are exhibited by several statistical parameters such as MB (the Mean Bias), NMB (the Normalized Mean Bias), NME (the Normalized Mean Error), RMSE (the Root Mean Square Error) and R (the Correlation Coefficient) obtained by traditional statistical methods.
The comparison of meteorological modeling and observa-tion finds out that MM5 simulaobserva-tion is accredited in this study. Six meteorological observation stations which are located in Beijing urban area are used to evaluate model results. They are chosen for their representative and consecutive. The av-erage value of the six sites’ observation is compared with the meteorological model output such as temperature (T), rela-tive humidity (RH), wind speed (WS), direction (WD) and pressure (P) in Table 2. The correlation coefficients (R) be-tween the observed T, RH, P, WS and WD, and the simulated ones are high and respectively 0.73, 0.71, 0.92, 0.74 and 0.50. So the meteorological MM5 model has the ability to
Fig. 5a
Fig. 5. Spatial distribution of anthropogenic (a) CO , (b) NOxand (c) SO2emission intensity (moles/s) in the third domain with horizontal
resolution of 27 km.
Table 2. Statistical summaries of the meteorological comparisons of the model results with observations of average temperature (T), relative
humidity (RH), wind speed, direction and pressure, of six observations sites in Beijing.
Obs. Sim. MB NMB(%) NME(%) RMSE R
T (◦) 15.6 15.5 −0.1 −0.8 21.4 3.8 0.73
RH (%) 46 49 2.2 4.9 26.2 15.4 0.71
Pressure (hPa) 1005 1006 0.4 0.1 0.3 3.7 0.92
Wind speed (m/s) 8.9 13.6 1.4 56.4 58.2 1.8 0.74
Wind direction (◦) 170 159 −10.8 −6.4 34.0 73.5 0.50
simulate the different meteorological variables. From other statistical parameters data, such as MB, NMB, NME and RMSE, we can see that the model can better simulate the characteristics of T, RH and P factors. The NMB and NME values for WS are higher than 50%; this indicates that the model slightly overestimates the wind speed. The MB and RMSE are low and the R value is higher for WS, so the model results of WS are reliable.
3.3 Comparison of model results with observation and
MODIS AOD
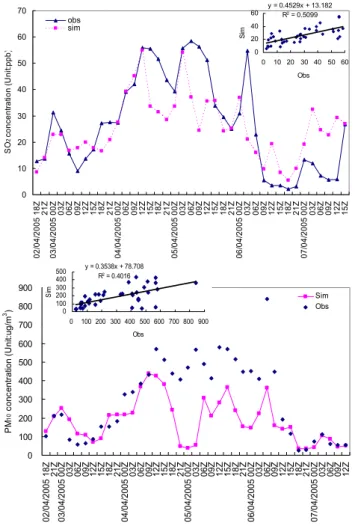
Figure 6 shows the comparison of simulated SO2and PM10
concentrations with observed data at 47 m (SO2) and 8 m
(PM10)height of IAP tower. The model simulated the
magni-tude and the diurnal patterns of SO2and PM10well. The
cor-relation coefficient of SO2and PM10between the model and
0 10 20 30 40 50 60 70 0 2 /0 4 /2 0 0 5 1 8 Z 2 1 Z 0 3 /0 4 /2 0 0 5 0 0 Z 0 3 Z 0 6 Z 0 9 Z 1 2 Z 1 5 Z 1 8 Z 2 1 Z 0 4 /0 4 /2 0 0 5 0 0 Z 0 6 Z 0 9 Z 1 2 Z 1 5 Z 1 8 Z 2 1 Z 0 5 /0 4 /2 0 0 5 0 0 Z 0 3 Z 0 6 Z 0 9 Z 1 2 Z 1 5 Z 1 8 Z 2 1 Z 0 6 /0 4 /2 0 0 5 0 0 Z 0 3 Z 0 6 Z 0 9 Z 1 2 Z 1 5 Z 1 8 Z 2 1 Z 0 7 /0 4 /2 0 0 5 0 0 Z 0 3 Z 0 6 Z 0 9 Z 1 2 Z 1 5 Z SO 2 co n c e n tr a ti o n ( U n it :p p b y = 0.4529x + 13.182 R2 = 0.5099 0 20 40 60 0 10 20 30 40 50 60 Obs Si m obs sim ) Fig. 6a 0 100 200 300 400 500 600 700 800 900 0 2 /0 4 /2 0 0 5 1 8 Z 2 1 Z 0 3 /0 4 /2 0 0 5 0 0 Z 0 3 Z 0 6 Z 0 9 Z 1 2 Z 1 5 Z 1 8 Z 2 1 Z 0 4 /0 4 /2 0 0 5 0 0 Z 0 3 Z 0 6 Z 0 9 Z 1 2 Z 1 5 Z 1 8 Z 2 1 Z 0 5 /0 4 /2 0 0 5 0 0 Z 0 3 Z 0 6 Z 0 9 Z 1 2 Z 1 5 Z 1 8 Z 2 1 Z 0 6 /0 4 /2 0 0 5 0 0 Z 0 3 Z 0 6 Z 0 9 Z 1 2 Z 1 5 Z 1 8 Z 2 1 Z 0 7 /0 4 /2 0 0 5 0 0 Z 0 3 Z 0 6 Z 0 9 Z 1 2 Z PM 1 0 c o n c e n tr a tio n ( U n it: u g /m 3) y = 0.3538x + 78.708 R2 = 0.4016 0 100 200 300 400 500 0 100 200 300 400 500 600 700 800 900 Obs Si m Sim Obs Fig. 6b
Fig. 6. Comparison of observed and simulated SO2(a) and PM10
(b) concentration of three hour average at IAP site from 2 April to
7 April 2005 (UTC).
model can also simulate the variations of the particles dur-ing this episode, but the simulation generally under predicted particle concentrations due to uncertainties in emissions and a lack of dust emission module in the current CMAQ system. The model results are also compared with MODIS optical depth data. Satellite remote sensing provides a means to de-rive aerosol distribution at global and regional scales. The Moderate Resolution Imaging Spectroradiometer (MODIS) aboard two of NASA’s Earth Observing System (EOS) satel-lites (Terra and Aqua) began a new era of aerosol remote sensing over land (Chu et al., 2003). Aerosol optical depth (AOD) products from MODIS have been verified by the sun-photometer observations in some regions of China (Li et al., 2003) and used to research air pollution in and around Bei-jing areas (Li et al., 2005). The researched results show that the MODIS AOD data have high accuracy and can better describe the regional and urban pollution distribution. Fig-ure 7a shows the spatial distribution of MODIS Level 2
prod-(a)
(b) Fig. 7
Fig. 7. (a) Aerosol Optical Depth spatial distributions by MODIS at
03:15 Z on 3 April 2005 (b) Model simulated PM10column density
of Beijing and surrounding areas at 03:00 (UTC) on 3 April 2005.
ucts of AOD (Version 4) with 10 km nadir spatial resolution in and around Beijing areas on 3 April 2005, 03:15 Z. Data over ocean parts are not used for larger uncertainty is usu-ally caused by high concentration of sediment. Regions in the north part of the figure are also blank for the surface is too bright (not covered with dense vegetation) to get
pre-cise aerosol retrieval. Figure 7b is the model simulated PM10
column density of Beijing and surrounding areas on 3 April 2005, 03:00 Z. Compared Fig. 7a with Fig. 7b, it can be seen that at in most areas the distributions patterns of simu-lated column density are consistent with MODIS AOD. In the coastal areas of Bo Hai Bay, about 200 km away from Bei-jing, MODIS observed larger AOD values than our model. The difference between the two sources is mainly due to MODIS AOD retrieval errors near estuary and coastal ar-eas with high sediment concentration in the water (Li et al., 2003). AOD values in the Beijing area corresponding to our model grids are derived from MODIS level 2 prod-ucts according to the nearest valid data within the scope
y = 2E-05x - 0.2449 R2 = 0.8384 0 0.2 0.4 0.6 0.8 1 1.2 1.4 0 10000 20000 30000 40000 50000 60000 70000
PM10 column density (ug/m 2 ) A e ro so l O p ti ca l D e p th (5 5 0 n m ) Fig. 8a y = 3E-05x - 0.3043 R2 = 0.8401 0 0.2 0.4 0.6 0.8 1 1.2 1.4 0 10000 20000 30000 40000 50000
PM25 column density (ug/m 2 ) Ae ro so l O p ti ca l D e p th ( 5 5 0 n m ) Fig. 8b
Fig. 8. Correlation coefficient of simulated PM10(a) and PM2.5(b)
column density with Aerosol Optical Depth.
correlation coefficient between MODIS AOD and model re-sults are higher than 0.90 (R-squred ∼0.84) (Fig. 8).
4 Results and discussions
4.1 Temporal and spatial distribution of simulated PM10
concentration
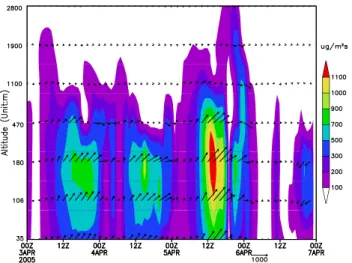
Figure 9a shows the simulated altitude-time cross sections
of PM10 concentrations at the IAP site. From 4–6 April
of 2005, PM10concentrations below 200 m were very high,
especially at night, which corresponded to the lower atmo-spheric boundary layer (ABL) height (Fig. 9b) from 12:00 Z to 00:00 Z (UTC), preventing atmospheric pollutants from dispersing away. Also during this period the surface wind speed was very weak especially from 4 April, 9:00 Z to 5 April, 00:00 Z and from 5 April, 12:00 Z to 6 April, 00:00 Z (UTC) with a wind speed of less than 1.0 m/s (Fig. 3).
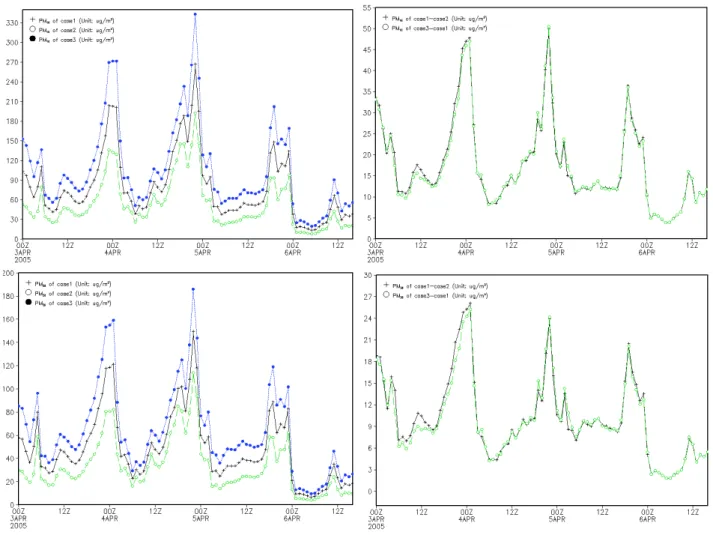
4.2 Sensitive models results of NBS emissions
Two sensitivity runs are conducted and compared with the base run to show the correlation of NBS emissions with air
pollution in Beijing. Timely variance of PM10 and PM25
concentration along Beijing under case 1 (base case), case 2,
Fig. 9a
Fig. 9. Vertical distributions of simulated PM10 concentration
and calculated atmospheric boundary layer (ABL) height by MM5 along IAP site (a) Altitude-time cross sections of PM10
concentra-tions (b) ABL height (m).
case 3, and the difference between the cases for PM10 and
PM25are shown in Fig. 10. Figure 10 shows that the particle
concentration variance patterns are similar under the reduced 50% emissions of NBS, added 50% emissions of NBS and base conditions during the episode. The differences between case 1 and case 2, and case 3 and case 1 are nearly the same. It shows that the impact of NBS emissions on air pollution in Beijing is almost linear.
4.3 NBS contributions to SO2and particle in Beijing
dur-ing the episode
Figure 11 represents the simulated SO2 and PM10
concen-trations in the fourth nested domain (3 km) at 02:00 Z, on
5 April. The horizontal distributions of SO2 and PM10 are
shown in Figs. 11a and c with all sources and in Figs. 11b and d for only NBS, respectively. Figure 11a shows that
SO2 concentrations at most urban Beijing are higher than
30 ppb, peaking around at 110 ppb in the west of urban Bei-jing. Compared with Fig. 11b, the contribution of NBS to
Fig. 10a Fig. 10b
Fig. 10c Fig. 10d
Fig. 10. Comparison of simulated temporal variance of PM10(a) and PM25(c) concentration along Beijing under Case 1 (base case), Case 2,
Case 3, and the difference between the cases for PM10(b) and PM25(d) from 3 April 00Z to 6 April 2005 12Z (UTC). Case 1 with emissions
of NBS keeping unchangeable (base run, BR); Case 2 with reduced 50% emissions of NBS, and Case 3 with added 50% emissions of NBS.
SO2 in most areas of urban Beijing is about 6 ppb, with
higher contributions in southeast area. The patterns of PM10
concentrations are similar to those of SO2, with a maximum
of more than 210 µg/m3at west of urban Beijing (Fig. 11c).
The contribution of NBS for PM10concentration in Beijing
is about 10–15 µg/m3(Fig. 11d).
The following formula was used to calculate the
percent-age contributions (PC) from NBS to PM10, PM2.5, SO2and
soil (soil particle with diameter between 2.5 µm and 10 µm): PC = C(CR) × 100/C(BR)
where C(CR) and C(BR) are the simulated concentrations
of PM10, PM2.5, SO2or Soil, with BR run (all sources) and
CR run (only NBS), respectively.
Using the results from the two runs, the distribution
pat-terns of PC for PM10 and PM2.5 were obtained. PM10 and
PM2.5 generally show similar patterns, indicating the same
source regions for both of them. The contributions of NBS
are variously spatially distributed over urban Beijing. In or-der to evaluate the effect of NBS on air pollution in differ-ent area of Beijing during this episode, the urban area is di-vided into five regions such as northwest (NW), southwest (SW), center, northeast (NE), southeast (SE). The percent-age contribution of NBS to each region is calculated by us-ing weighted mean method and summed up in Table 3. The average percentage (AVE) for all urban area is the average of these five parts. From the table, we can see that the
av-erage contribution of NBS to PM2.5is 39%, with maximum
up to 53% at the northwest of urban area and only 15% at southwest. The spatial distribution pattern of contribution
ratio for PM10is very close to PM2.5, but with slightly less
than PM2.5. The maximum weighted average contribution to
PM10is 43% at the northwest of Beijing urban area and the
minimum is 10% at the southwest. And the average
contribu-tion for PM10is 30%. The average contribution of NBS for
Fig. 11a
Fig. 11c Fig. 11d
Fig. 11. Horizontal distributions of simulated SO2and PM10concentrations over Beijing area at 02:00 (UTC) on 5 April 2005. (a) For SO2
of all sources; (b) for SO2of sources outside Beijing; (c) same as (a), but for PM10; (d) same as (b), but for PM10.
urban area and the minimum 13% at the northwest. For soil, the spatial distribution pattern of contribution is very like that
of SO2, and the average contribution of NBS to soil is 10%
with the maximum at the southeast and the minimum at the northwest.
Therefore, for PM2.5 and PM10, the order of contribution
of NBS from big to small is NW, SE, NE and SW. But for
SO2and soil, it is different from that of PM10, the order from
big to small is SE, SW, NE and NW. Table 3 also indicates that the average contributions of NBS are different for each
pollutant, with the order of PM25>PM10>SO2>soil during
this episode.
It can also be elucidated from the table that the NBS con-tribution of fine particles is larger than that of coarse parti-cles to Beijing background PM levels as the fine partiparti-cles are much easier to be long-range transported.
4.4 Pathways of NBS transporting to Beijing
The vertical altitude-time cross section and the west-east
cross section of PM10 flux along Beijing are shown in
Figs. 12 and 13, respectively. PM10flux is calculated by the
following formula: flux = C × V
Where C is the simulated concentration of PM10and V is the
wind velocity.
From 3 to 6 April, strong PM10 fluxes were calculated
coming from the southwest to the northeast of Beijing, es-pecially during nighttime. In order to clearly reveal the
cor-relation between the NBS contribution to PM10 in Beijing,
the temporal variance of PM10concentration, PM10flux and
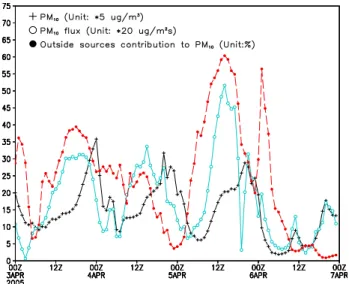
the contribution of NBS along Beijing are shown in Fig. 14.
From Fig. 14, we can see that the peak PM10flux was seen
Fig. 12. Altitude-time cross sections of PM10 flux (Unit: µg m−2s−1)along Beijing from 3 April to 7 April 2006.
Table 3. The weighted average percentage contributions of NBS to
SO2and particle in urban Beijing.
Area NW SW Center NE SE AVE
PM2.5 53% 15% 35% 44% 50% 39%
PM10 43% 10% 25% 34% 37% 30%
SO2 13% 18% 15% 17% 26% 18%
soil 5% 10% 10% 10% 15% 10%
peak value of contribution percentage to PM10 at this time.
The peak PM10flux was up to 1100 µg m−2s−1at an altitude
of about 200 m and correspondingly the peak contribution
ra-tio of NBS to PM10was up to 60%.
Figure 14 shows that the PM10flux peaks at the same time
as the maximum of the contribution to PM10occurring, with
a delayed PM10 concentration peak. At 18:00 Z on 3 April,
15:00 Z on 4 April and at 14:00 Z on 5 April, the
contribu-tion percentage of NBS was very large with a strong PM10
flux imported from surrounding areas into Beijing, which
in-duced the high PM10 concentration at later time (at 23:00 Z
on 3 April, 20:00 Z on 4 April and at 20:00 Z on 5 April). It indicates that the contribution of surrounding sources plays a very important role in forming high pollution concentration in Beijing during this episode.
From the horizontal distribution chart of PM10 fluxes
(Fig. 15), it can be seen that strong particle fluxes were trans-ported from the southwest area of Beijing by southwest wind. At 06:00 Z on 5 April, the flux center located at the bound-ary of Hebei province from Shanxi province. At 10:00 Z on 5 April, the high flux center moved to the northeast of Shijiazhuang. Later, the flux peak reached Beijing at about 14:00 Z. Therefore, the dominant transport pathway for NBS effecting Beijing was by the west and southwest flow
dur-Fig. 13a Fig. 13a
Fig. 13b
Fig. 13. (a) West-east cross section of PM10 flux (Unit: µg m−2s−1)along Beijing from 3 April 00:00 to 6 April 12:00 (UTC), (b) Cross-section of PM10flux (Unit: µg m−2s−1)along
SW-NE pathway from 3 April 00:00 to 6 April 12:00 (UTC).
ing this episode. Meteorological analysis (Sect. 2.3) shows that during this period, Beijing was controlled by southwest wind on 850 hPa and surface, and located at low pressure on groove. This type of meteorological pattern offers a conve-nient condition for sources located at southwest region to be transported into Beijing. And also after 5 April, the float-ing dust storms brought by a strong Mongolia cyclone across north China strengthened this process.
5 Summary
The Models-3/CMAQ coupled with MM5 and SMOKE module was applied to evaluate the contributions of NBS to
high SO2and particles pollutants in Beijing during 3–7 April
2005. Comparisons of model results with observed data at the IAP tower and MODIS AOD showed that the model cap-tured the main observed features of this serious pollution
Fig. 14
Fig. 14. Temporal variance of PM10 concentration, PM10 flux
and contribution of sources outside Beijing to PM10along Beijing
(UTC).
episode. The correlation coefficient for SO2 between the
model and observed data was averaged around 0.70 while the correlation coefficient for the modeled column loading of particles and MODIS AOD reached 0.90. The spatial
distri-butions of SO2 and PM10 simulated by the model showed
that high concentrations were transported from southwest area of Beijing to the northeast by west and southwest winds. This was also confirmed with synoptic chart analysis and transport flux analysis during this period. The sensitivity studies indicated that NBS contributions varied temporally
and spatially for certain pollution species. For PM2.5, the
maximum weighted average contribution was up to 53% at the northwest of urban area, the least was about 15% at
south-west. For PM10, spatial distribution and temporal variance
of contributions were close to those of PM2.5, but slightly
less. Model results also revealed that NBS contributes more to fine particle than coarse particles. The average
contribu-tions of SO2 and soil were 18% and 10%. The calculated
transport flux results show that the PM10flux peak and
per-centage contribution peak of NBS to PM10happened almost
simultaneously with a delay the PM10concentrations.
This study presents a well behaved modeling system for investigating the Beijing urban pollutions and source contri-butions. For a comprehensive analysis of Beijing air pollu-tions, more observational data are needed for model valida-tions and longer simulavalida-tions are required to obtain the sea-sonal variations of NBS contributions. It is noticed that al-though this method emission switch on/off method is widely used to estimate the contribution of target emissions by most of modellers (Streets et al., 2006), it may cause significant bias/errors to estimate the non-linear source-reception rela-tions. In a nonlinear system with many factors involved, the total impacts of all factors are not linearly additive of the
Fig. 15a
Fig. 15b
Fig. 15c
Fig. 15. Horizontal distributions of PM10 fluxes at altitude about
180 m at (a) 06:00 Z, (b) 10:00 Z, and (c) 14:00 Z on 5 April (Unit:
µg m−2s−1).
contribution from each factor. The contribution of one fac-tor in presence of other facfac-tors can be determined by tak-ing the difference between a model run includtak-ing all factors
and another model run with the factor of interest excluded.
For SO2, it is probably fine, but for PM, there are too many
species with complex non-linear reaction and evolution to make uncertainty quite large. The application of the current modeling results for control should be careful but it is an im-portant first step to address the concerns on the regional air quality control needs for Beijing Olympic 2008.
Acknowledgements. This study was supported by Key Project
of Chinese Academy of Sciences (KZCX3-SW-341), Natural Science Foundation of China (40490265) and Chinese Ministry of Science and Technology (2002CB410802 and 2005CB422205). The authors gratefully acknowledge D. Street for offering emission inventory of East Asia, three anonymous referees and P. Castellanos at University of Maryland to revise the manuscript.
Edited by: R. Volkamer
References
Chu, D. A., Kaufman, Y. J., Zibordi, G., Chern, J. D., Mao, J. T., Li, C. C., and Holben, B. N.: Global monitoring of air pollution over land from the Earth Observing System-Terra Moderate Res-olution Imaging Spectroradiometer (MODIS), J. Geophys. Res. Atmos., 108D(21), 4661, doi:10.1029/2002JD003179, 2003. Draxler, R. R. and Rolph, G. D.: HYSPLIT (HYbrid Single-Particle
Lagrangian Integrated Trajectory) Model access via NOAA ARL READY Website (http://www.arl.noaa.gov/ready/hysplit4.html), NOAA Air Resources Laboratory, Silver Spring, MD, 2003. Grell, G. A., Dudhia, J., and Stauffer, D. R. A.: A description
of the Fifth Generation Penn 15 State/NCAR Mesoscale Model (MM5), NCAR Technical Note, 1994, NCAR/TU-398+STR, 138, 1994.
Li, C. C., Mao, J. T., Lau, K. H. A., Chen, J. C., Yuan, Z. B., Liu, X. Y., Zhu, A. H., and Liu, G. Q.: Characteristics of distribution and seasonal variation of aerosol optical depth in eastern China with MODIS products, Chinese Sci. Bull., 48(22), 2488–2495, 2003. Li, C. C., Mao, J. T., Lau, K. H. A., Yuan, Z. B., Wang, M. H., and Liu, X. Y.: Application of MODIS satellite products on the air pollution research in Beijing, Science in China Series D, 35, 209–219, 2005.
SMOKE, MCNC: http://cf.unc.edu/cep/empd/products/smoke, 2005.
Ren, Z. H., Wan, B. T., Yu, T., et al.: Influence of Weather System of Different Scale s on Pollution Boundary Layer and the Trans-port in Horizontal Current Field, Res. Environ. Sci., 17(1), 7–13, 2004.
Rolph, G. D.: Real-time Environmental Applications and Dis-play System (READY) Website (http://www.arl.noaa.gov/ready/ hysplit4.html), NOAA Air Resources Laboratory, Silver Spring, MD, 2003.
Streets, D. G., Bond, T. C., Carmichael, G. R., et al.: An inventory of gaseous and primary aerosol emissions in Asia in the year 2000, J. Geophys. Res., 108(D21), 8809, doi:10.1029/2002JD003093, 2003.
Streets, D. G., Fu, J. S., Jang, C. J., Hao, J., He, K., Tang, X., Zhang, Y., Wang, Z., Li, Z., Zhang, Q., et al.: Air quality during the 2008 Beijing Olympic Games, Atmos. Environ., 41(3), 480– 492, 2007.
Su, F. Q., Gao, Q. X., Zhang, Z. G., et al.: Transport Pathways of Pollutants from Outside in Atmosphere Boundary Layer, Res. Environ. Sci., 17(1), 26–29, 2004.
Sun, Y. L., Zhuang, G. S., Wang, Y., Han, L. H., et al.: The air-borne particulate pollution in Beijing – Concentration, composi-tion, distribution and sources, Atmos. Environ., 38, 5991–6004, 2004.
Uno, I., Ohara, T., Sugata, S., et al.: Development of RAMS/CMAQ Asian Scale Chemical Transport Modeling System, J. Jpn. Soc. Atmos. Environ., 40(4), 148–164, 2005.
U.S. EPA: Science Algorithms of the EPA Models-3 Community Multiscale Air Quality Model (CMAQ) Modeling System, U.S. EPA Report EPA/600/R-99/030, Research Triangle Park, NC, 1999.
Xu, X. D., Zhou, L., Zhou, X. J., et al.: Urban Environment Region Influenced by Surrounding Sources During Serious Atmospheric Pollution Process, SCIENCE IN CHINA Ser. D Earth Sciences (in Chinese), 34(10), 958–966, 2004.
Yamaji, K., Ohara, T., Uno, I., et al.: Analysis of seasonal variation of ozone in the boundary layer in East Asia using the Commu-nity Multi-scale Air Quality model: What controls surface ozone level over Japan?, Atmos. Environ., 40(10), 1856–1868, 2006. Yan, P. and Huang, J.: Long Term Simulation of SO2in Beijing and
Calculation and Evaluation of Effects of Different Type Sources on SO2, Science in China, 35D, 167–176, 2005.
Zhang, M. G., Uno, I., Sugata, S., et al.: Numerical study of boundary layer ozone transport and photochemical production in East Asia in the wintertime. Geophys. Res. Lett., 29(11), 1545, doi:10.1029/2001GL014368, 2002.
Zhang, M. G., Uno, I., Akimoto, H., et al.: Large-scale structure of trace gas and aerosol distributions over the western Pacific Ocean during the Transport and Chemical Evolution Over the Pa-cific (TRACE-P) experiment, J. Geophys. Res., 108(D21), 8820, doi:1011029P2002JD002946, 2003.
Zhang, Z. G. , Gao, Q. X., Han, X. Q., et al.: The study of pollutant transport between the cities in North China, Res. Environ. Sci. (in Chinese), 17(1), 14–20, 2004.