International Journal of Epidemiology
© International Epidemiologies! Association 1988
Vol. 17, No. 4 Printed in Great Britain
Socioeconomic Groups and Cancer
Risk at Death in the Swiss Canton of
Vaud
FABIO LEVI\ EVA NEGRI t *, CARLO LA VECCHIA* * and VAN CONG TE*
Levi F (Vaud Cancer Registry, University Institute of Social and Preventive Medicine, CHUV BH-06, 1011 Lausanne, Switzerland), Negri E, La Vecchia C and Te V C. Socioeconomic groups and cancer risk at death in the Swiss Canton of Vaud. Internationa/Journal of Epidemiology 1988,17: 711-717.
Data collected by the Cancer Registry of the Canton of Vaud, Switzerland, were used to estimate proportional mortality ratios (PMR) and mortality odds ratios (MOR) for various neoplasms according to social class and sector of occupation (agriculture versus others). Mortality ratios were elevated in lower social classes for cancers of the lung (MOR = 1.18 for •octal class IV or V vs I or II) and other sites strictly related to tobacco (mouth or pharynx, oesophagus and larynx; MOR = 1.70), and (though not significantly) for cancers of the stomach (MOR - 1.16) and uterus (MOR - 1.30 for cervix and 1.47 for corpus uteri). Furthermore, there was a strong negative social class gradient for thyroid cancer (a neoplasm wfth particularly elevated incidence and mortality in Switzerland), probably attributable to higher preva-lence of iodine deficiency in lower social classes (MOR - 3.17). Positive social class gradients emerged for cancers of the intestines (MOR - 0.77 for social d a s * IV or V), skin (MOR => 0.74) and prostate (MOR = 0.87). Agricultural workers showed decreased ratios for cancers of the lung (MOR - 0.75), cervix uteri (MOR - 0.72) and prostate (MOR - 0.80), and excess mortality from cancers of the upper digestive and respiratory sites (MOR - 1.22), stomach (MOR — 1.18), testis (MOR - 2.05) and lymphc-haematopoietic neoplasms, particularly myeloma (MOR - 2.14).
Socioeconomic status has long been known to be one of the major determinants of the incidence of various neoplasms. Cancers of the stomach and cervix uteri, for instance, have consistently been found to be higher in lower social classes, whereas cancers of the breast or prostate tend to show positive social class gradients.1"*
It is difficult to define and quantify the importance of specific occupational exposures and of various lifestyle correlates of socioeconomic status on subsequent cancer risk. Nonetheless, further reports on this topic are of general interest, since the socioeconomic deter-minants of cancer risk are known to differ in different countries and time periods. Thus, we present here the results, in terms of proportional mortality ratios and mortality odds ratios, on the relation between social class and mortality from major cancer sites on the basis of incident cases from the Cancer Registry of the Vaud Canton, Switzerland. The dataset was insufficient for
* Vaud Cancer Registry, University Institute of Social and Preventive Medicine, CHUV BH-06,1011 Lausanne, Switzerland
t Inter-University Consortium of Lombardy for Automatic Data Pro-cessing (CILEA), via R. Sanzio, 20090 Segrate, Milan, Italy.
t Mario Negri Institute for Pharmacological Research, via Eritrea 62,
20157 Milan, Italy.
any evaluation of specific occupations, but meaningful analyses could be conducted (and are enclosed in the present report) for the whole of agriculture and for-estry workers as compared with all other occupational sectors.
MATERIALS AND METHODS
The data were derived from the Vaud Cancer Registry datafile, which includes data concerning incident cases of malignant neoplasms in the Canton (whose popula-tion in 1980 was about 530,000 inhabitants).'10
Infor-mation collected by the register includes general characteristics of the patient (age, sex), site and histo-logical type of the tumour according to the standard International Classification of Diseases (ICD, Ninth Revision) and time of registration. Information on marital status, nationality and occupation is not col-lected at registration, but is abstracted from death certificates. Occupation is coded according to a detailed three-digit classification provided by the Swiss Federal Office of Statistics,11 which is an adaptation of
the International Classification of Occupations.12
Among the cancer deaths registered between 1977 and 1984 in the population aged 20 to 74, information on occupation was available for 4461 deceased cases 711
712 INTERNATIONAL JOURNAL OF EPIDEMIOLOGY
(3099 males and 1362 females, 77% of all deceased cases, 81% of males and 70% of females), which con-stitute the material for these analyses.
Using these occupation codes, it is possible to define sodoeconomic groups or social classes comparable to those adopted by the British Registrar General." Val-idation of this sodoeconomic classification has been considered in a separate study, which showed satis-factory concordance between death certificate and Census data.14
In order to obtain meaningful numbers in each cate-gory, we grouped the six original sotial classes into three categories, including respectively the Registrar General's Social classes I and II (professional, man-agerial and intermediate), sodal classes III nM or III M (skilled occupations), and social class IV or V (partly skilled and unskilled occupations).
A total of 347 cases could not be classified in terms of sodal class, and were considered only for analyses related to occupational sector (agriculture versus others).
Observed numbers of deaths for each cancer were tabulated and compared with cause-specific expected numbers based on the proportional cancer mortality experience of the whole dataset, with adjustments for age (in five-year groups) and sex (where appropriate). Cancer proportional mortality ratios (PMRs) were cal-culated as the ratio of observed to expected deaths for each cancer.15"17 Standard errors of the PMRs were
based on the Poisson distribution, and their statistical significance was determined by the chi-square test, comparing observed and expected numbers of deaths. Age- and sex-adjusted mortality odds ratios (MORs)18 were computed from 2 x 2 tables including
deaths for a defined neoplasm versus those from all other neoplasms. Estimates of the MORs were also derived from multiple logistic regression equations,1'-20
with maximum likelihood fitting21 and including
simul-taneously terms for age, sex, sodal class, sector of occupation, nationality and marital status. Since age-and sex-adjusted MORs in no case were materially different from the corresponding PMRs, whereas mul-tivariate estimates provided some additional infor-mation on the modifying effect of potential confounding factors, only the latter are given in the tables.
RESULTS
Absolute numbers of cases included in the present analyses for all cancer deaths and each of the 21 cancers or groups of cancers considered are given in Table 1 in separate strata of sex, age, sodal dass and sector of occupation. Overall, there were 3099 males
and 1362 females for the agriculture versus other activities analyses, 2848 males and 1266 females for the sodal class analyses (since sodal class was undeter-mined for 347 individuals). By far the commonest cause of cancer death was lung (1010 cases), followed by intestines (442 cases), breast (280 cases) and pros-tate (244), whereas a total of 472 cancer deaths were due to various neoplasms of the upper digestive and respiratory tract.
Table 2 gives proportional mortality ratios according to sodal class in the two sexes separately, while Table 3 reports corresponding estimates for the two sexes com-bined for non-sexual neoplasms (and for the relevant sex for sexually related ones) both in terms of age- and sex-adjusted proportional mortality ratios and of mul-tivariate mortality odds ratios.
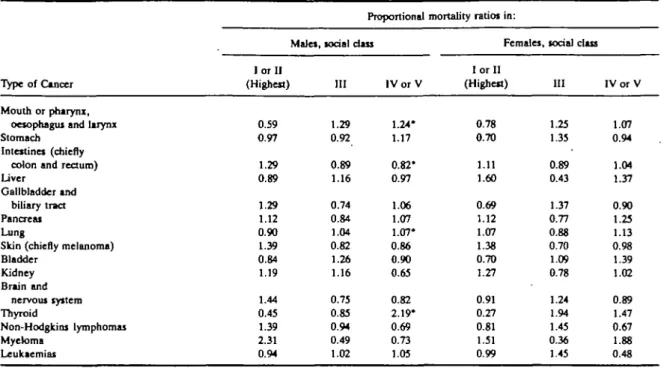
Significant negative sodal class gradients (ie higher ratios in lower sodal classes) emerged for cancers of the mouth or pharynx, larynx and oesophagus, lung and thyroid: for these neoplasms, the pattern of trends in ratios was satisfactorily consistent for the two sexes, although the lowest ratio for female lung was observed in the intermediate class. Negative sodal class gra-dients (though non-significant) were evident for cancers of the stomach and uterus, too.
Significantly positive sodal class gradients were apparent for cancers of the intestines, skin (chiefly melanoma) and prostate. Ratios were significantly below unity for lower sodal classes for non-Hodgkin's lymphomas and significantly above unity in the upper sodal classes for myeloma, but the trends in ratios for these neoplasms were inconsistent.
Mortality odds ratios, derived from multiple logistic regression equations (including terms for nationality and marital status besides age and sex) give the esti-mated risk of cancer death for sodal class III and IV or V compared with sodal class I or II (reference cate-gory). The findings from this analysis are largely con-sistent with the age- and sex-adjusted proportional mortality ratios although, on account of the large stan-dard errors of the estimate from the model, the tests for linear trend were significant only for cancers of the mouth or pharynx, larynx or oesophagus, lung and thyroid (elevated ratios in lower sodal classes), and for intestines (lower ratios for lower sodal classes).
Corresponding analyses (PMRs for males and females, PMRs and MORs for both sexes combined) for agriculture versus other occupations are reported in Table 4. Farmers and other workers in agriculture showed significant excess proportionate mortality for neoplasms of the upper digestive and respiratory tract, gallbladder and bile ducts, testis, myeloma and leu-kaemias, and significantly decreased ratios for lung,
SOaOECONOMC GROUPS AND CANCER RISK AT DEATH 7 1 3 TABLE 1 Distribution of cancer deaths from the registry of the Swiss canton of Vaud according to type of cancer and selected variables.
Type of cancer Mouth or pharynx, oesophagui and larynx Stomach Intestine* (chiefly
colon and rectum) Liver Gallbladder Pancreas Lung Skin (chiefly melanoma) Breait Cervix uteri Corpus uteri Ovary Prostate Testis Bladder Kidney Brain and nervous system Thyroid Non-Hodgkin's lymphomas Myeloma Leukaemias
Total, all cancer deaths*
Sex M 409 159 283 82 25 113 907 180 5 — — 244 19 147 65 75 11 77 35 73 3099 F 63 36 159 18 39 71 103 50 275 62 45 101 — 27 33 37 9 46 18 47 1362 <55 124 32 62 11 9 22 165 33 101 20 7 32 52 16 23 14 47 6 25 5 • 31 866 Age 55-64 184 62 124 36 23 67 384 45 89 25 16 30 45 1 5 32 31 6 43 19 31 1445
Number of registered deaths according to
65-74 164 101 256 53 32 95 461 152 90 17 22 39 194 2 99 52 34 8 55 29 58 2150 l o r II (Highest) 101 57 161 31 17 62 302 88 92 19 14 31 89 5 48 35 41 3 42 22 35 1403 Social class III 199 72 159 37 25 63 386 75 128 26 19 45 79 8 73 38 41 9 51 10 49 1713 I V o r V 131 49 88 24 12 44 261 46 39 13 11 17 55 5 39 18 22 7 20 10 22 998 Sectoi of occupation Agri-culture Other 60 25 49 11 12 20 96 28 23 4 3 9 26 4 18 9 10 2 14 11 19 481 412 170 393 89 52 164 914 202 257 58 42 92 218 15 156 89 102 18 109 42 101 3980 'Including others and undefined
cervix uteri and prostate. Stomach cancer and non-Hodgkin's disease were above unity and corpus uteri neoplasms rates below unity in subjects working in agriculture, but these differences were not significant. Likewise, no appreciable difference was observed for other digestive sites, breast, ovary, urinary sites, brain and thyroid.
For the comparisons of agriculture versus other occupations, too, the findings for multiple logistic regression MORs were largely consistent with age- and sex-adjusted PMRs. Significantly elevated MORs for agricultural workers emerged for gallbladder, leu-kaemias and multiple myeloma, whereas the estimate was significantly below unity for lung cancer.
Finally, we repeated the same analyses for PMR and MOR computation after exclusion of lung cancer, since this neoplasm represented a large proportion of the comparison group and has a major recognized risk
factor in smoking." There were minor changes in the sense of increasing (or reducing) differences between social classes or occupational categories, but in no case were the estimated ratios materially modified. Thus, only estimates based on comparison with all (other) neoplasms were presented.
DISCUSSION
There are a number of problems in the interpretation of the analyses presented, chiefly due to the relatively small absolute numbers of cases with the consequent limited power to detect significant associations, and to the absence of reliable estimates of the population at risk in various occupational groups. Consequently, we had to rely on estimtes of risk based on cancer PMRs and MORs. In general, the two methods provided consistent estimates, minor differences being restricted to a systematic tendency to underestimate
7 1 4 INTERNATIONAL JOURNAL OF EPIDEMIOLOGY
TABLE 2 Proportional mortality ratiost for selected cancer sites according to social doss in the two sexes. Vaud, Switzerland, 1977-84. Proportional mortality ratios in:
Type of Cancer Mouth or pharynx,
oesophagus and larynx Stomach
Intestines (chiefly colon and rectum) Liver
Gallbladder and biliary tract Pancreas Lung
Skin (chiefly melanoma) Bladder Kidney Brain and nervous system Thyroid Non-Hodgkins lymphomas Myeloma Leukaemias
'p < 0.05 (for linear trend).
t Adjusted for age.
Males, I or II (Highest) 0.59 0.97 1.29 0.89 1.29 1.12 0.90 1.39 0.84 1.19 1.44 0.45 1.39 2.31 0.94 social class III 1.29 0.92 0.89 1.16 0.74 0.84 1.04 0.82 1.26 1.16 0.75 0.85 0.94 0.49 1.02 I V o r V 1.24* 1.17 0.82* 0.97 1.06 1.07 1.07* 0.86 0.90 0.65 0.82 2.19* 0.69 0.73 1.05 Females, I or II (Highest) 0.78 0.70 1.11 1.60 0.69 1.12 1.07 1.38 0.70 1.27 0.91 0.27 0.81 1.51 0.99 social dass III 1.25 1.35 0.89 0.43 1.37 0.77 0.88 0.70 1.09 0.78 1.24 1.94 1.45 0.36 1.45 IV or V 1.07 0.94 1.04 1.37 0.90 1.25 1.13 0.98 1.39 1.02 0.89 1.47 0.67 1.88 0.48
differences between occupational groups by the PMRs, obviously due to the fact that observed deaths from the cause under examination were included in the computation of expected ones (denominators) as well.15"" A further advantage of MOR estimates was
given by the applicability of standard methods of adjustment for covariates, ie logistic regression com-monly utilized in the analysis of case-control studies.18-"
Nonetheless, it should be stressed that these methods are in any case restricted to an estimate of risk of death in relative terms of comparison with deaths from all (other) cancer deaths, and hence they do not give information on the absolute risk of cancer death in a defined socioeconomic occupational group. More-over, the fact that we utilized cancer deaths only, and not total mortality, further restricts the inference within the distribution of various cancers, preventing us from inferences on differential overall cancer mor-tality between various occupational groups, even in relative terms. For instance, total cancer mortality is known to be higher for lower social classes in several countries (ref 4 pp. 104-6), but in the present analysis was obviously constrained to unity. On the other hand, this should inherently correct the present analyses from biases due to the 'healthy worker effect', which
are known to produce spurious overestimates of the PMRs for cancer when total mortality is used as reference.1517
Bearing these cautions in mind, it is consequent that the present analysis should be considered preliminary work to generate hypotheses to be tested by further research, or to compare and'verify mortality patterns previously reported from studies conducted in other countries.
It is thus interesting to find confirmation in the pres-ent dataset of lower mortality ratios in higher social classes for cancers of the lung and other sites strictly related to tobacco (mouth or pharynx, oesophagus and larynx). It is also likely that occupational exposures to carcinogens did play some role in determining these social class differences, at least for lung cancer.
Likewise, the negative social class gradients for cancers of the stomach and (cervix) uteri are largely recognized, as well as the positive gradients for intesti-nal neoplasms and for skin melanoma.1"1
More controversial is the evidence for cancer of the prostate, which showed a positive social class gradient in the present dataset, as well as in various Scan-dinavian countries,7 among white Americans from Los
Angeles County,22 in a case-control study from Italy23
SOC10ECON0MIC GROUPS AND CANCER RISK AT DEATH 7 1 5 TABLE3 Proportional mortality ratios' and morality odds ratios" for selected cancer sites according to todaldass. Vaud, Switzerland, 1977-84.
Type of cancer
Mouth or pharynx, oesophagus and larynx Stomach
Intestines (chiefly colon and rectum) Liver
Gallbladder and biliary tract Pancreas
Lung
Skin (chiefly melanoma) Breast} Cervix uteri Corpus uteri Ovary Prostate Tcitii Bladder Kidney Brain and nervous system Thyroid Non-Hodgkin's lymphomas Myeloma Leukaemias
* Adjusted for age and sex.
" Estimates from multiple logistic models including terms for age, sex, nationality and marital status. + p < 0.05 (for linear trend).
t Reference category.
5 Only cases among women included.
Proportional mortality ratio 1 I or II (Highest) 0.62 0.91 1.22 0.99 0.89 1.12 0.91 1.39 1.01 0.96 0.90 0.96 1.23 0.86 0.82 1.22 1.23 0.37 1.14 2.02 0.96
for social das:
III 1.28 0.99 0.89 0.98 1.11 0.81 1.02 0.79 1.11 0.89 0.88 1.13 0.83 1.06 1.23 1.00 0.92 1.23 1.13 0.44 1.19 I V o r V 1.22+ 1.13 • 0.88+ 1.02 0.98 1.12 1.07t 0.88t 0.80 1.27 1.44 0.98 0.97+ 1.15 0.95 0.74 0.84 1.92+ 0.69 0.96 0.86 I or II (Highest) It U It It U It It It It It It It It It It It It It H It
Mortality odds ratio for social class
III 1.70 1.05 0.79 1.03 1.22 0.83 1.11 0.71 1.09 1.00 0.96 1.05 0.77 1.32 1.31 0.91 0.81 2.19 0.96 0.36 1.11 I V o r V 1.70+ 1.16 0.77+ 1.06 1.18 1.03 1.18+ 0.74 0.80 1.30 1.47 0.99 0.87 1.46 1.13 0.73 0.78 3.17+ 0.67 0.64 0.91
current century,4 but not in more recent British data4
and on other American studies.6-24
A finding deserving consideration in the present study (in spite of the rarity of the disease) is the strong negative social class gradient for thyroid cancer ratios, on account of the exceedingly high rates for this neo-plasm in Switzerland.23 Thus, although British,4
Swedish7 or American data26 are not entirely consistent
with these data (the only negative social class gradient being evident among British married women),4 it is
conceivable that this apparent discrepancy is due to differences in the causes of the disease in various coun-tries. More specifically, assuming that a considerable proportion of Swiss thyroid cancer deaths were due to iodine deficiency, it is conceivable that the deficit was more prevalent among lower social class individuals.
Among the interesting findings of the analyses of agricultural workers there are the decreased ratios for lung cancer (even more pronounced in females) and of the cervix uteri, which should be considered in relation
to known risk factors for these diseases (smoking and sexual habits, respectively). In contrast, agricultural workers showed excess mortality ratios for cancer of the stomach, gallbladder, of the upper digestive and respiratory sites, which are probably explainable in . terms of differences in dietary habits, including alcohol.
This study showed reduced ratios for prostate cancer and elevated ones for cancer of the testis in agricultural workers. Although the latter association has already been reported,27 the overall evidence concerning the
relation between agricultural work and male genital tract neoplasms is as yet largely controversial.7-23-2*-30
More consistent data have been accumulated over the last few years on a possible association between lympho-haematopoietic neoplasms and agricultural work,29-31'36 which is confirmed in the present dataset.
This association, which was previously reported from several7-28-37 (but not all) other studies has been
716 INTERNATIONAL JOURNAL OF EPIDEMIOLOGY TABLE 4 Proportional
Type of cancer
mortality ratios (PMR)' and mortality odds agriculture. Vaud,
ratios (MOR)" for selected Switzerland, 1977-84.
Males PMR
Females PMR
cancer sites among
PMR
individuals occupied in
Total MOR Mouth or pharynx,
oesophagus and larynx Stomach
Intestines (chiefly colon and rectum) liver
Gallbladder and biliary tract Pancreas
Lung
Skin (chiefly melanoma) Breast Cervix uteri Corpus uteri Ovary Prostate Testis Bladder Kidney
Brain and nervous system Thyroid Non-Hodgkin's lympbomas Myeloma Leukaemias 1.26t 1.09 1.09 0.78 1.90t 1.07 0.85t 1.08 — — 0.79t 1.83t 0.83 0.49t 1.21 0.90 1.33t 1.50t 1.46 1.18 1.65t 0.87 2.09t 2.35t 0.93 0.94t 0.83 0.99 0.77t 0.75 1.04 — — 1.33 1.84 — 1.25 0.73 3.99t 1.69 1.25t 1.17 1.03 0.94 2.14t 1.03 0.82t 1.04 — — — — — _ — 0.88 0.83 0.88 1.05 1.13 2.10t 1.54t 1.22 1.18 1.01 1.05 2.08t 1.11 0.75t 1.05 0.95* 0.72 0.75 1.11 0.80 2.05 0.89 0.83 0.82 1.08 1.14 2.14t 1.52t * Adjusted for age and sex (when appropriate).
** Estimates from multiple logistic models including terms for age, sex, nationality and marital status. t p < 0.05.
t Only cases among women included.
chemicals (herbicides)38 of agricultural workers,
although no clear knowledge of the causes of these neoplasms is at present available.
REFERENCES
1 Doll R, Peto R. The causes of cancer. Quantitative estimates of avoidable risks of cancer in the United States today. JNCl 1981; 66: 1191-1308.
2 NlyhS S. Social group and mortality in Finland. Brit J Prev Soc Med 1977; 31: 231-7.
3 Office of Population Censuses and Surveys. Occupational mortality. London, Her Majesty's Stationery Office, 1978.
4 Logan W P D. Cancer mortality by occupation and social class 1851-1971. Her Majesty's Stationery Office, London/International Agency for Research on Cancer, Lyon, 1982 (IARC Scient. Pub!. No. 36—Studies on Medical and Population Subjects No. 44).
5 Fox A J, Adelstein A M. Occupational mortality: work or way of life? J Epidemiol Comm Health 1978; 32: 73-8.
•Blair A, Walrath J, Rogot E. Mortality patterns among U.S. vet-erans by occupation. I. Cancer. JNCl 1985; 75: 1039-47. 7 Vigero D , Persson G. Occurrence of cancer in sodoeconomic
groups in Sweden. An analysis based on the Swedish Cancer Environment Registry. ScandJ Soc Med 19S6; 14: 151-60. ' Pearce N E, Howard J K. Occupation, social dass and male cancer
mortality in New Zealand, 1974-78. Intj Epidemiol 1986; IS: 456-62.
' Levi F. Vaud Cancer Registry statistics 1975-1977. In: Cancer
Inci-dence in Five Continents. Vol. IV, Lyon Intemationaal
Agency for Research on Cancer, IARC Sdent Publ No. 42, 1982, pp. 546-9.
10 Levi F. Le cancer dans la population vaudoise. Incidence et mortality.
1979-1983. Lausanne, Registre Vaudois des Tumeurs—
InstJtut Univemttire de Mededne Sodale et Preventive, 1985,75 p.
11 Klassifikation der Berufefur die SchlBsselung der Statistikkarten der
Beviikerungsbewegung. Bern, Eidg. Statistisches Amt, 1979.
12 International Labour Office. International Standard Ctimification of
Occupations. Geneva, ILO, 1968.
u Leete R, Fox A J. Registrar General's Social Classes: origins and uses. Population Trends 1977; 8: 1-7.
14 Beer V, Greusing T, Minder C. Berufbezogene sozio-okonomische Gruppen fur die Schweiz: sozialwissenschaftJiche Grundlagen und Untersuchungen zur ValidiUt. Soz Pneventivmed 1986; 6: 274-80.
15 Witter S D. Cause-deleted proportional mortality analysis and the healthy worker effect. Stat Med 1986; 5: 61-71.
•• DecoufW P, Thomas T L, Pkkle L W, Comparison of the proportio-nate mortality ratio and standardized mortality ratio risk measures. Am J Epidemiol 1980; 111: 263-9.
11 Puntoni R. Ulteriori analisi dej dati di mortalita. In: Attipreliminari
del terzo Convegno Nazionale sugli Studi di Mortalita.
Fir-enze, October 22-24,1986. Firenie, Lega Italiana per la Lotta contro i Tumori, 1986, pp. 45-54.
" Miettinen O, Wang J D. An alternative to the proportionate mor-tality ratio. Am J Epidemiol 1981; 114: 144-8.
SOCIOECONOMIC GROUPS AND CANCER RISK AT DEATH 717 analysis of proportionate mortality data. Am J Epidemiol
1987; 125: 515-23.
20 Robins J M, Blevins D. Analysis of proportionate mortality data using logistic regession models. Am J Epidemiol 1987; 125: 524-35.
a BakeT R J, Nelder J A. The GUM System. Release 3. Oxford, Numerical Algorithms Group, 1978.
22 Ross R K, McCurtis J W, Henderson B E, Menck H R, Mack T M, Martin S P. Descriptive epidemiology of testkular and prosta-tic cancer in Los Angeles. Br J Cancer 1979; 39: 284-92,1979. "Talaroini R, La Vecchia C, Decarli A, Negri E, Franceschi S. Nutrition, loriaJ factors and prostatk cancer in a Northern Italian population. Br J Cancer 1986; 53: 817-21.
24 Emster V L, Selvin S, Sacks S T, Austin D F, Brown S M, Winkels-tein W. Prostate cancer mortabty and incidence rates by race and social class. Am J Epidemiol 1978; 107: 311-20. 25 Levi F, La Vecchia C, Decarli A, Randriamiharisoa A. Age, birth
cohort and period of death effects in Swiss cancer mortality, 1951-1984. Int J Cancer 1987; 40: 439-49.
» McTiernan A M, Weiss N S, Dating J R. Incidence of thyroid cancer in women in relation to reproductive and hormonal factors.
Am J Epidemiol 1984; 120: 423-35.
27 Mills P K, Newell G R, Johnson D E. Testicular cancer associated with employment in agriculture and oil and natural gas extrac-tion. Lancet 1984; 1: 207-10.
n Wiklund K, Holm L E. Trends in cancer risk among Swedish agri-cultural workers. JNCl 1986; 77: 657-64.
"Delzell E, Gruffennan S. Mortality among white and nonwhite
farmers in North Carolina, 1976-1978. Am J Epidemiol 1985; 121: 391-402.
30 Wiklund K. Swedish agricultural workers. A group with a decreased risk of cancer. Cancer 1983; 51: 566-8.
11 Milharo S. Leukemia and multiple myeloma in farmers. Am J
Epi-demiol 1971; 94: 307-10.
" Blair A, Thomas T L. Leukemia among Nebraska farmers; a death
certificate study. Am J Epidemiol 1979; 110: 264-73.
° Blair A, Fraumeni J F, Mason T J. Geographic patterns of leukemia
in the United States. J Chron Dis 1980; 33: 251-60. "Burmeister L F, Van UCT S F, Isacson P. Leukemia and farm
practices in Iowa. Am J Epiodemiol 1982; 115: 720-8. B Pearce N E, Sheppard R A, Howard J K, Fraser J, lilley B M.
leukaemia among New Zealand agricultural workers. A Cancer Registry based study. Am J Epidemiol 1986; 124: 402-9.
* Pearce N E, Sheppard R A, Smith A H, Teague C A. Non-Hodgkin'i lympboma and farming: an expanded case-control study. Int J Cancer 1987; 39: 155-61.
17 Linos A, Kyle R A, O'Fallon W M, Kurland L T. A case-control study of occupational exposures and leukaemia. Int J
Epi-demiol 1980; 9-. 131-5.
» Hoar S K, Blair A, Holmes F F, Boysen C D, Robel R J, Hoover R, Fraumeni J F. Agricultural herbicide use and risk of lym-phoma and soft tissue sarcoma. JAMA 1986; 256: 1141-7.