© The Author 2012. Published by Oxford University Press on behalf of the Society of Occupational Medicine. All rights reserved. For Permissions, please email: [email protected].
Upper airway symptoms among workers with
work-related respiratory complaints
D. Miedinger1,2, D. Gautrin3 and R. Castano3,4
1Clinic of Internal Medicine, University Hospital, Basel, Switzerland, 2Department of Occupational Medicine, Suva, Lucerne, Switzerland, 3Axe de recherche en santé respiratoire, Hôpital du Sacré-Coeur de Montréal, Université de Montréal, Montreal, Canada, 4Department of Surgery/Otolaryngology, Hôpital du Sacré-Coeur de Montréal, Montreal, Canada
Correspondence to: R. Castano, Department of Surgery/Otolaryngology, Axe de recherche en santé respiratoire, Hôpital du Sacré-Coeur de Montréal, 5400, boulevard, Gouin Ouest, Montréal (Québec) H4J 1C5, Canada. Tel: +1 514-338-2222, # 7271; fax: +1 514-338-3543; e-mail: [email protected]
Background Work-related rhinitis and asthma symptoms frequently co-exist.
Aims To determine the prevalence and nature of nasal, pharyngeal, laryngeal and sinus symptoms among individuals with work-related respiratory symptoms.
Methods Individuals referred to a tertiary occupational asthma clinic for investigations with specific inhalation challenges were evaluated using the RHINASTHMA quality of life questionnaire and a question-naire that assessed the nature and frequency of upper airway symptoms, their relationship to the workplace and their temporal relationship with the onset of asthma symptoms.
Results There were 83 study participants. At least one upper airway symptom was reported by all of these individuals: nasal in 92%; pharyngeal in 82%; laryngeal in 65% and sinus in 53% of participants. Overall, there were no significant differences in the frequencies of nasal, pharyngeal, laryngeal and sinus symptoms when comparing these with occupational asthma (OA), work-exacerbated asthma (WEA) and work-related respiratory symptoms (WRS), except that nasal bleeding was most fre-quent among those with WRS. The presence of laryngeal symptoms was significantly associated with rhinitis-specific quality of life impairment. Individuals with workplace exposures to high molecular weight agents had greater impaired quality of life than those who were exposed to low molecular weight agents (RHINASTMA Upper Airway sub-scores: 24.0 ± 10.4 versus 19.8 ± 6.8; P < 0.05). Conclusions Individuals who were referred for work-related respiratory symptoms experienced high rates of
work-related nasal, pharyngeal, laryngeal and sinus symptoms, regardless of having OA, WEA or WRS.
Key words Laryngitis; occupational asthma; pharyngitis; quality of life; rhinitis; sinusitis; workplace.
Introduction
The nose is the respiratory system’s first defence mecha-nism against airborne contaminants, including occupa-tional allergens and irritants. Thus rhinitis is frequently the first clinical manifestation of respiratory problems, which can often extend to the lower airways and mani-fest as asthma at a later stage. In the workplace workers are exposed to a variety of allergens and chemicals that can potentially cause different respiratory symptoms. Workplace exposures to high molecular weight (HMW) agents and low molecular weight (LMW) agents are associated with a wide spectrum of conditions that can
range from mucous membrane irritation and aggra-vation of pre-existing rhinitis and asthma to clinically established occupational rhinitis (OR) and occupational asthma (OA) [1].
There is an extensive literature on the links between the upper and lower airways, although most available evidence describes the co-expression of rhinitis and asthma symptoms in the general population [2]. However there is sufficient evidence to show that these relationships also apply to rhinitis and asthma symptoms that are of occupational origin [3,4]. However, surprisingly little
has been published on the frequencies of pharyngeal, laryngeal and sinus symptoms among workers that manifest as work-related respiratory symptoms.
In this study, we characterized the nature and fre-quency of upper airway symptoms (nasal, pharyngeal, laryngeal and sinus) and the severity of rhinitis symptoms both ‘at work’ and ‘away from work’ among subjects with complaints of work-related respiratory symptoms. These individuals had been evaluated using specific inhalation challenges (SIC) and were also diagnosed with either OA, work-exacerbated asthma (WEA) or work-related respiratory symptoms (WRS). We also examined the impact of rhinitis and asthma symptoms on quality of life (QOL) using a disease-specific questionnaire and deter-mined if the frequency and nature of symptoms differed according to the type of occupational agents to which these workers were exposed.
Methods
We recruited subjects who had been referred to a ter-tiary clinic specializing in occupational respiratory dis-eases for the evaluation of WRS. Each subject completed a disease-specific QOL questionnaire and a question-naire on upper airways symptoms. An initial investigation included a detailed medical and occupational history and skin prick testing to common aeroallergens to assess atopy. Atopy was defined as at least one positive reaction to a common aeroallergen.
Each subject then underwent an SIC using both a control agent and the suspected occupational agent. A diagnosis of OA was established based on a positive SIC result. A diagnosis of WEA was based on a negative SIC result and a positive methacholine test result defined as PC20 ≤ 16 mg/ml [4]. Subjects who did not meet these diagnostic criteria were categorized as having WRS. For this study, we assumed that exposure to the suspected occupational agent was responsible for both lower and upper respiratory symptoms. This study was approved by the hospital medical ethics committee and all study par-ticipants gave their written informed consent.
Each subject completed a questionnaire regarding the nature and frequency of upper airway symptoms, symptoms’ relationships to the workplace and symp-toms’ temporal relationships with the onset of asthma symptoms (either prior to, at the same time or after onset). This questionnaire was based on the standard-ized questionnaire of the International Union against Tuberculosis and Lung Disease and the 1988 National Health Interview Survey occupational health sup-plement [5,6]. In this questionnaire, symptoms were grouped as nasal, pharyngeal, laryngeal and sinus. Nasal symptoms included obstruction, rhinorrhoea, sneez-ing, itchsneez-ing, nasal bleedsneez-ing, nasal crusting and impaired olfaction. Pharyngeal symptoms included sore throat,
throat dryness, throat clearing and throat burning. Laryngeal symptoms included dry cough and hoarse-ness. Sinus symptoms included mucopurulent nasal dis-charge, facial pain/pressure and post-nasal drip.
Subjects also completed the RHINASTHMA ques-tionnaire [7]. This consisted of 30 items regarding the impact of rhinitis and asthma while subjects were work-ing, recorded on a five point Likert scale (not at all, a lit-tle, fairly often, often, very often). Questionnaire response analysis provided sub-scores related to the Upper Airways (UAS), Lower Airways (LAS), Respiratory Allergy Impact (RAI) and a Global Score (Global Summary). Answers to the RHINASTHMA items were then con-verted to scores ranging from 0 (minimal impact) to 100 (maximum impact). Both questionnaires were adminis-tered on the first day of the scheduled investigation prior to the clinical investigation and SIC.
A visual analogue scale (VAS) ranging from 0 (not at all bothersome) to 10 (extremely bothersome) was used to assess the severity of combined rhinitis symptoms both ‘at work’ and ‘away from work’ [8].
SICs were performed according to a previously described methodology following international rec-ommendations [9]. On the first day, a subject was exposed to a control substance to ensure that asthma, if present, was stable. On subsequent days, a subject was progressively exposed to increasing doses of the occupational agent suspected of causing the respira-tory symptoms. After the control and active challenge were administered, FEV1 was monitored at regular intervals for 6 h. A methacholine test was performed at the end of the control and last active challenge day. A SIC was considered positive if there was a decline in FEV1 of ≥ 20% [9].
Results for categorical variables are given as absolute numbers and relative frequencies (percentages). Results for continuous variables are given as means ± SDs or as medians and 25th and 75th percentiles for non-normally distributed variables. Categorical frequencies were compared using a Chi-squared or Fisher’s exact test. Continuous variables were compared using Student’s
t-test or Mann-Whitney U test. Spearman’s rho was used
for correlation analysis. We created binary categorical variables for each of the groups of upper airways symptoms (Nasal_Symptoms, Pharyngeal_Symptoms, Laryngeal_
Symptoms and Sinus_Symptoms). For example, a subject
was categorized as having nasal symptoms if he reported having one or more of the several symptoms in the nasal symptoms group. Individual scores from the Rhinasthma UAS were log-transformed to generate a near-normal distribution. We then did a linear regression analysis using the UAS sub-scores as the dependent variables and the variables of Nasal_Symptoms, Pharyngeal_Symptoms,
Laryngeal_Symptoms and Sinus_Symptoms as predictors.
Data analyses used SPSS V.19 (SPSS, Inc., Chicago, IL, USA).
Results
There were 83 study participants. The study subjects’ baseline characteristics are shown in Table 1. After SICs, 29 (35%) were diagnosed with OA, 21 (25%) were diag-nosed with WEA and 33 (40%) were diagdiag-nosed with WRS. These three groups were comparable with respect to age and gender (data not shown).
At least one symptom was frequently reported by all of the study subjects: nasal 92% (76/83); pharyngeal 82%; laryngeal 65% and sinus 53%. Most of the study subjects reported that upper airways symptoms occurred ‘almost every day’ or ‘one day or more per week.’ Also all categories of upper airways symptoms were reported as occurring more often in the workplace than when away from work (Figure 1).
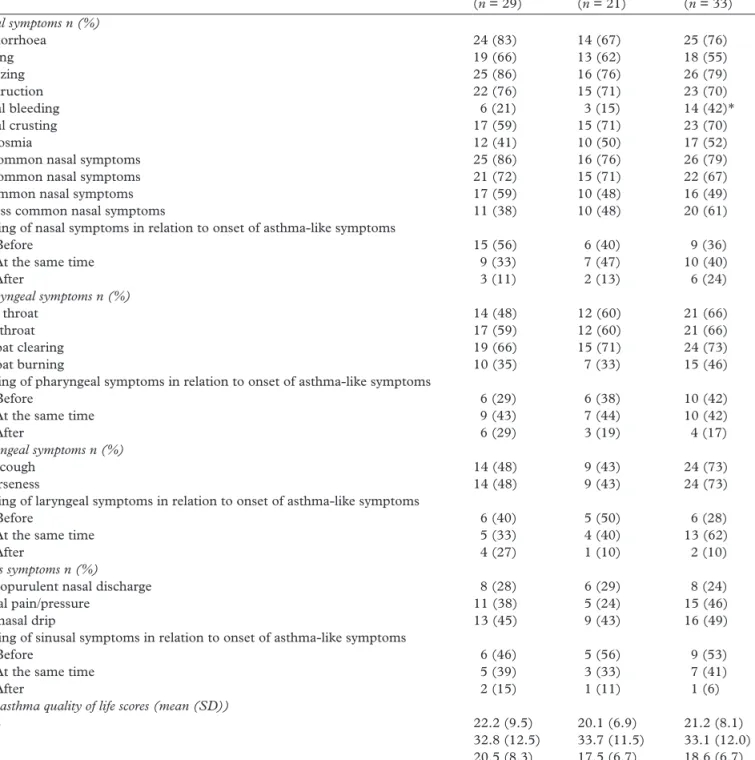
In general, there were high frequencies of upper airway symptoms among all of the SIC diagnosis groups (Table 2). Nasal symptoms and pharyngeal symptoms were reported by the majority of individuals who were referred for investigating work-related respiratory symptoms. However, there were no significant differences in the frequencies of nasal, pharyngeal, laryngeal and
sinus symptoms after comparing the subjects with OA, WEA and WRS, except that ‘nasal bleeding’ was significantly more frequent among subjects with a final diagnosis of WRS.
Nasal symptoms more frequently preceded those of asthma among subjects with OA (56%) as compared with subjects with WEA (40%). In contrast, pharyngeal symptoms more frequently preceded those of asthma among subjects with WEA (38%) compared with sub-jects with OA (29%). The same patterns were observed regarding laryngeal (OA: 40% versus WEA: 50%) and sinus (OA: 46% versus WEA: 56%) symptoms. However, these differences between the groups were not statisti-cally significant (Table 2).
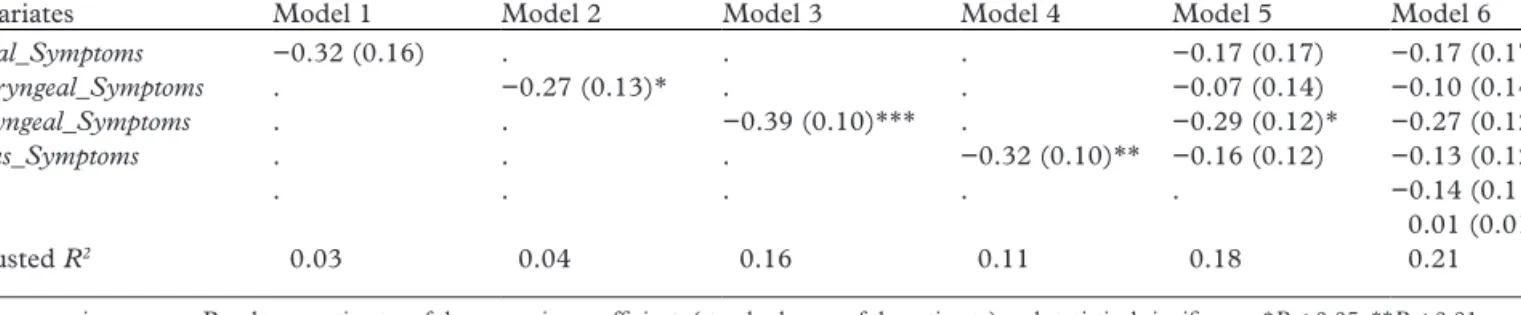
From univariate analysis, the symptom categories of Throat_Symptoms, Larynx_Symptoms and Sinus_
Symptoms were statistically significantly associated with
Rhinasthma UAS. In our model 6, after incorporating all of the symptom categories and controlling for sex and age, only Larynx_Symptoms remained significantly asso-ciated with Rhinasthma UAS (Table 3).
Subjects who were exposed at work to HMW agents reported higher frequencies of nasal and sinus
symp-toms, while subjects who were exposed to LMW agents reported higher frequencies of pharyngeal and laryn-geal symptoms; however these observed differences in individual symptom categories were not statistically significant (data not shown). In addition, as shown in Table 4, QOL assessed by the Rhinasthma question-naire indicated that those exposed to HMW agents had greater impairments in QOL than those exposed to LMW agents (24.0 ± 10.4 versus 19.8 ± 6.8; P < 0.05).
Subjects had significantly higher VAS scores ‘at work’ as compared with VAS scores ‘away from work’ (4.7 ± 3.0 versus 2.4 ± 2.7; P < 0.001). Rhinitis symp-toms ‘at work’ were considered as moderate/severe by 59% and mild by 41% of these subjects. In contrast, only 23% of these subjects considered rhinitis symp-toms ‘away from work’ as moderate/severe and 77% regarded these symptoms as mild. A comparison of rhinitis severity levels ‘at work’ and ‘away from work’ based on the final diagnosis after SIC showed the same pattern, with significantly higher VAS scores ‘at work’ as compared with ‘away from work’ in all groups: for OA, at work median = 5.0 (25th percentile, 75th per-centile: 2.6, 7.2) versus away from work: 2.7 (0.5, 5.0);
P = 0.001; for WEA, 4.0 (0.6, 6.0) versus 0.8 (0.2, 4.0); P < 0.05 and for WRS, 5.7 (2.9, 8.2) versus 0.9 (0.3,
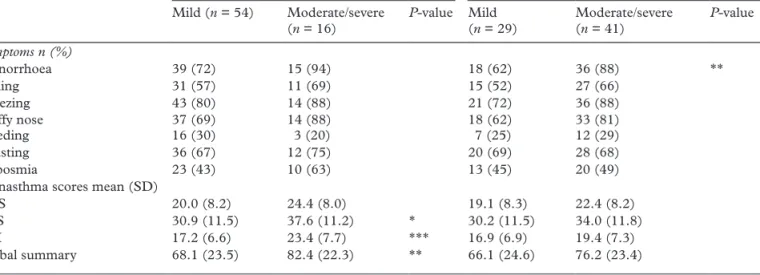
3.2); P < 0.001. However, no statistically significant dif-ferences were found between the SIC diagnosis groups. Subjects who rated their rhinitis ‘at work’ as mod-erate or severe reported significantly more rhinorrhea than subjects who rated rhinitis symptoms as mild (Table 5). However the differences in symptoms preva-lence (sneezing and stuffy nose) as well as the difference in mean RAI sub-score and Global Summary score Table 1. Baseline characteristics of the study participants (n = 83)
Characteristics n (%)
Male: female 59 (71) : 24 (29)
Age, years 41.8 ± 10.8
Atopy 61 (74)
Smoking status, current : ex : never 20 (24) : 20 (24) : 43 (52) Duration of exposure in years 8.0 (3.0; 21.0)
Oral antihistamines 9 (11) Nose medication 10 (12) Asthma medication 39 (47) FEV1% predicted 95.8 (86.2; 106.4) Nature of agents HMW : LMW 27 (33) : 56 (67) HMW agents Flour 14 Animal proteins 5 Various cereals 3 Enzymes 2
Other various agents 3
LMW agents
Isocyanates 13
Resins, glues, paints 7
Formaldehyde 6
Woods 6
Welding fumes 4
Acrylates 5
Cleaning agents 2
Other various agents 13
Results are n (%), mean ± SD or median (25th percentile, 75th percentile).
FEV1, forced expiratory volume in one second; HMW, high molecular weight;
LMW, low molecular weight. Other various HMW agents: e.g. seafood, drugs, enzymes, bio-aerosols. Other various LMW agents: e.g. persulfates, colophony, metals.
were not significant. Subjects who rated their rhinitis as moderate or severe when they were ‘away from work’ had greater QOL impairments for all RHINASTHMA scores, although these differences in UAS scores were not significant.
Discussion
Individuals with work-related respiratory symptoms who were investigated in an OA referral centre reported high frequencies of various upper respiratory symptoms that included not only nasal symptoms but also a wide range of sinus, laryngeal and pharyngeal symptoms. Pharyngeal symptoms were most strongly related to impairments in rhinitis-specific QOL.
To our knowledge, this is the first comprehensive examination of upper airways symptoms in a study pop-ulation with a history suggestive of work-related asthma. All of these individuals underwent specific inhalation
testing, which is considered the reference standard for investigating OA, WEA and WRS. We made extensive evaluations of upper respiratory symptoms and also determined their impact on rhinitis and asthma-specific QOL for each individual in this study.
This study had several limitations. First, the sample size was small and the data collected were restricted to one specialized health centre only. Second, symptoms were self-reported and thus only represented subjective evidence of upper airways conditions that might have been over- or under-reported. Third, we did not do envi-ronmental exposure assessments with which to link the upper airways symptoms reported by the study subjects. Considering the high prevalence of upper airways symp-toms observed in this study, we cannot be certain of the extent of over-reporting in this study.
However, it is important to note that these sub-jects had been referred to our hospital for OA investi-gations. Thus they were selected based on their lower 0% 10% 20% 30% 40% 50% 60% 70% 80% 90% 100% Seldom
One week or more per month One day or more per week Almost every day
0% 10% 20% 30% 40% 50% 60% 70% 80% 90% 100%
More often than at the workplace As often as at the workplace Less often than at the workplace Not at all
Upper airways symptoms work
Upper airways symptoms work
Figure 1. Upper airways symptoms and their frequency distributions based on occurrence when ‘at work’ (upper panel) and when ‘away from
work’ (lower panel). Upper panel: answer to the question: What is (was), on average, the frequency of your symptoms (if the symptoms have actually stopped, answer for the period when you had symptoms)? Lower panel: answer to the question: While away from work, how often do your symptoms occur?
airways symptoms and not for upper airways com-plaints. In addition it is more likely that there would be under-reporting of symptoms in this type of study popu-lation, as asthma-like symptoms engender greater con-cerns, whereas upper-airways symptoms are often not perceived as significant health problems.
The respiratory tract extends from the nose to the lungs. Thus, exposures of the mucous membranes of the nose, sinuses, pharynx and larynx to allergens and irritants in the workplace should theoretically induce not only nasal symptoms but also pharyngeal, laryngeal and sinus symptoms. In the medical literature, these Table 2. Prevalence of upper airways symptoms and quality of life scores in the three SIC diagnosis groups
Characteristics OA (n = 29) WEA (n = 21) WRS (n = 33) Nasal symptoms n (%) Rhinorrhoea 24 (83) 14 (67) 25 (76) Itching 19 (66) 13 (62) 18 (55) Sneezing 25 (86) 16 (76) 26 (79) Obstruction 22 (76) 15 (71) 23 (70) Nasal bleeding 6 (21) 3 (15) 14 (42)* Nasal crusting 17 (59) 15 (71) 23 (70) Hyposmia 12 (41) 10 (50) 17 (52)
≥2 common nasal symptoms 25 (86) 16 (76) 26 (79)
≥3 common nasal symptoms 21 (72) 15 (71) 22 (67)
4 common nasal symptoms 17 (59) 10 (48) 16 (49)
≥2 less common nasal symptoms 11 (38) 10 (48) 20 (61)
Timing of nasal symptoms in relation to onset of asthma-like symptoms
- Before 15 (56) 6 (40) 9 (36)
- At the same time 9 (33) 7 (47) 10 (40)
- After 3 (11) 2 (13) 6 (24) Pharyngeal symptoms n (%) Sore throat 14 (48) 12 (60) 21 (66) Dry throat 17 (59) 12 (60) 21 (66) Throat clearing 19 (66) 15 (71) 24 (73) Throat burning 10 (35) 7 (33) 15 (46)
Timing of pharyngeal symptoms in relation to onset of asthma-like symptoms
- Before 6 (29) 6 (38) 10 (42)
- At the same time 9 (43) 7 (44) 10 (42)
- After 6 (29) 3 (19) 4 (17)
Laryngeal symptoms n (%)
Dry cough 14 (48) 9 (43) 24 (73)
Hoarseness 14 (48) 9 (43) 24 (73)
Timing of laryngeal symptoms in relation to onset of asthma-like symptoms
- Before 6 (40) 5 (50) 6 (28)
- At the same time 5 (33) 4 (40) 13 (62)
- After 4 (27) 1 (10) 2 (10)
Sinus symptoms n (%)
Mucopurulent nasal discharge 8 (28) 6 (29) 8 (24)
Facial pain/pressure 11 (38) 5 (24) 15 (46)
Postnasal drip 13 (45) 9 (43) 16 (49)
Timing of sinusal symptoms in relation to onset of asthma-like symptoms
- Before 6 (46) 5 (56) 9 (53)
- At the same time 5 (39) 3 (33) 7 (41)
- After 2 (15) 1 (11) 1 (6)
Rhinasthma quality of life scores (mean (SD))
UAS 22.2 (9.5) 20.1 (6.9) 21.2 (8.1)
LAS 32.8 (12.5) 33.7 (11.5) 33.1 (12.0)
RAI 20.5 (8.3) 17.5 (6.7) 18.6 (6.7)
Global summary 75.5 (27.9) 71.2 (22.1) 72.9 (22.9)
OA, occupational asthma; WEA, work-exacerbated asthma; WRS, work-related respiratory symptoms; UAS, upper airways sub-score; LAS, lower airway sub-score; RAI, respiratory allergy impact. *P < 0.05 between groups comparison. Common nasal symptoms = rhinorrhoea, obstruction, itching, sneezing. Less common nasal symptoms = nasal bleeding, nasal crusting, hyposmia.
symptoms are not reported as frequently as work-related nasal symptoms, probably because nasal and bronchial symptoms are often more prominent and relevant for patients. Symptoms like dry throat, sore throat and throat clearing are frequently self-reported in occupa-tional epidemiological surveys that focus on the preva-lence of respiratory symptoms among workers exposed to diverse irritants (e.g. welding fumes, metal-working fluids) [10,11].
In addition, occupational pharyngitis and laryngi-tis are less frequently reported as compared with OR. Kanerva et al. reported on the occurrence of occupa-tional pharyngitis that was confirmed by challenge tests using exposures to acrylate compounds that are used in orthodontics and dentistry [12]. Occupational laryngi-tis has been reported in individuals who were exposed to formaldehyde, welding fumes and acrylate com-pounds and chemicals used in hairdressing [13–16]. Occupational laryngitis often occurs concomitantly with OR or OA [17]. After analysing data from specialized clinics that investigated patients with WRA, Vandenplas
et al. reported that loss of voice was negatively associated
with the presence of OA to HMW agents [18].
The frequent co-existence of work-related rhinitis and asthma symptoms has been demonstrated in clinical and epidemiological studies [19]. We recently reported a high prevalence of rhinitis symptoms among subjects with a confirmed diagnosis of OA after SIC [1]. Other studies have found high frequencies of rhinitis symptoms
among patients who were referred to specialized clinics for investigating work-related asthma [4,20]. In addition, the present study demonstrated that rhinitis symptoms ‘at work’ were regarded as moderate or severe by a higher proportion of subjects and this severity pattern was asso-ciated with a tendency for higher QOL impairment in the RAI and Global Summary scores of the Rhinasthma questionnaire.
A temporal relationship between work-related rhi-nitis symptoms and the onset of work-related asthma symptoms has been documented in previous studies. Malo et al. showed that OR more often appeared before OA for exposures to HMW agents (58%) as compared with exposures to LMW agents (25%) [21]. Vandenplas
et al. showed that nasal symptoms less frequently
pre-ceded those of asthma in subjects with WEA (17%) than in those with OA (43%) [4]. Our study confirmed the results from these studies. However, in addition, we showed that pharyngeal, laryngeal and sinusal symp-toms more frequently preceded those of asthma in sub-jects with WEA than in those with OA. It remains to be determined if there is any clinical value in documenting pharyngeal, laryngeal and sinusal symptoms with respect to their potential to correctly identify patients with OA and WEA.
Generic QOL measures have been shown to be mod-erately correlated with rhinitis symptoms scores and nasal hyperreactivity [22,23]. Nasal congestion and ocular symptoms were identified as the most disturbing symptoms that could decrease rhinitis specific QOL and work productivity [24,25]. Among greenhouse work-ers, sensitization to bell pepper pollen had a negative impact on rhinitis-specific QOL scores and the pat-tern in impairment was different when compared with individuals with non-occupational perennial rhinitis [26]. A follow-up study of these workers showed that OR symptoms were a risk factor for a job change, but that symptom scores and rhinitis-specific QOL could return to baseline when complete exposure cessation was achieved [27]. However, continued exposure to the causative agent led to further declines in QOL among subjects with OR [28].
Table 3. Associations between different upper respiratory symptom categories and UAS scores from the Rhinasthma questionnaire (n = 83)
Log10(Rhinasthma UAS)
Covariates Model 1 Model 2 Model 3 Model 4 Model 5 Model 6
Nasal_Symptoms −0.32 (0.16) . . . −0.17 (0.17) −0.17 (0.17) Pharyngeal_Symptoms . −0.27 (0.13)* . . −0.07 (0.14) −0.10 (0.14) Laryngeal_Symptoms . . −0.39 (0.10)*** . −0.29 (0.12)* −0.27 (0.12)* Sinus_Symptoms . . . −0.32 (0.10)** −0.16 (0.12) −0.13 (0.12) Sex . . . −0.14 (0.11) Age 0.01 (0.01) Adjusted R2 0.03 0.04 0.16 0.11 0.18 0.21
UAS: upper airway score. Results are estimates of the regression coefficient, (standard error of the estimate) and statistical significance *P < 0.05, **P < 0.01, ***P < 0.001, no indicator = P-value NS obtained by linear regression analyses. Models 1–4 are univariate analyses; model 5 incorporated all symptom categories as co-variates and model 6 incorporated all symptom categories variables and was adjusted for sex and age.
Table 4. Rhinasthma quality of life scores based on type of a
etiologic agent (n = 83) HMW (n = 27) LMW (n = 56) P-value UAS 24.0 (10.4) 19.8 (6.8) * LAS 31.9 (12.5) 33.8 (11.7) RAI 19.3 (7.6) 18.8 (7.2) Global summary 75.2 (28.3) 72.5 (22.9)
HMW, high molecular weight; LMW, low molecular weight; UAS, upper airway symptoms; LAS, lower airways symptoms; RAI, respiratory allergy impact. Results are means (standard deviations), *P < 0.05, no indicator = P-value NS.
In our study population, laryngeal symptoms were associated with impairments in rhinitis-specific QOL. Laryngeal symptoms were reported as more frequent among patients with allergic rhinitis than in patients with non-allergic rhinitis and were negatively associated with voice-related QOL [29]. The number of positive skin prick test results to common allergens was posi-tively associated with greater voice impairments among patients who presented to a rhinology clinic in the UK without specific voice-related complaints [30].
We acknowledge that these findings should be con-firmed in a larger study, particularly with regard to poten-tial differences between subjects with OA and WEA. Also, occupational surveys should consider including assess-ments for pharyngeal, laryngeal and sinus symptoms in addition to nasal symptoms when examining the effects of environmental and occupational noxious exposures.
Funding
This work was supported by the Swiss National Science Foundation Bern/Switzerland; the Center for Asthma
in the Workplace in Montreal/Canada and the Fonds de Recherches en Santé du Québec (FRSQ).
Conflicts of interest
D.M. is employed by the Swiss Accident Insurance Fund (Suva). Suva is an independent, non-profit company under Swiss public law.
References
1. Castano R, Malo JL. Occupational rhinitis and asthma: where do we stand, where do we go? Curr Allergy Asthma
Rep 2010;10:135–142.
2. Bousquet J, Khaltaev N, Cruz AA, et al. Allergic Rhinitis and its Impact on Asthma (ARIA) 2008 update (in collab-oration with the World Health Organization, GA(2)LEN and AllerGen). Allergy 2008;63(Suppl 86):8–160.
3. Castano R, Gautrin D, Theriault G, Trudeau C, Ghezzo H, Malo JL. Occupational rhinitis in workers investigated for occupational asthma. Thorax 2009;64:50–54.
4. Vandenplas O, Van Brussel P, D’Alpaos V, Wattiez M, Jamart J, Thimpont J. Rhinitis in subjects with work-exacerbated asthma. Respir Med 2010;104:497–503.
5. Burney PG, Laitinen LA, Perdrizet S, et al. Validity and repeatability of the IUATLD (1984) Bronchial Symptoms Questionnaire: an international comparison. Eur Respir J 1989;2:940–945.
6. Massey JT. Overview of the National Health Interview Survey and its sample design. Vital Health Stat 2 1989: 1–5.
7. Baiardini I, Pasquali M, Giardini A, et al. Rhinasthma: a new specific QoL questionnaire for patients with rhinitis and asthma. Allergy 2003;58:289–294.
8. Bousquet PJ, Combescure C, Neukirch F, et al. Visual analog scales can assess the severity of rhinitis graded according to ARIA guidelines. Allergy 2007;62:367–372. Table 5. Prevalence of nasal symptoms and quality of life scores according to self-reported severity of rhinitis symptoms based on visual
analogue scale on days away from work and days at work (n = 70)
Away from work At work
Mild (n = 54) Moderate/severe
(n = 16) P-value Mild (n = 29) Moderate/severe (n = 41) P-value Symptoms n (%) Rhinorrhoea 39 (72) 15 (94) 18 (62) 36 (88) ** Itching 31 (57) 11 (69) 15 (52) 27 (66) Sneezing 43 (80) 14 (88) 21 (72) 36 (88) Stuffy nose 37 (69) 14 (88) 18 (62) 33 (81) Bleeding 16 (30) 3 (20) 7 (25) 12 (29) Crusting 36 (67) 12 (75) 20 (69) 28 (68) Hyposmia 23 (43) 10 (63) 13 (45) 20 (49)
Rhinasthma scores mean (SD)
UAS 20.0 (8.2) 24.4 (8.0) 19.1 (8.3) 22.4 (8.2)
LAS 30.9 (11.5) 37.6 (11.2) * 30.2 (11.5) 34.0 (11.8)
RAI 17.2 (6.6) 23.4 (7.7) *** 16.9 (6.9) 19.4 (7.3)
Global summary 68.1 (23.5) 82.4 (22.3) ** 66.1 (24.6) 76.2 (23.4)
UAS, upper airway symptoms; LAS, lower airway symptoms; RAI, respiratory allergy impact. *P < 0.05, **P < 0.01, ***P < 0.001, no indicator = P-value NS.
Key points
• Individuals with work-related respiratory symp-toms investigated in an occupational asthma re-ferral centre reported high frequencies of various upper respiratory symptoms.
• Individuals complained not only of nasal symp-toms as previously reported but also of a wide range of sinus, laryngeal and pharyngeal symptoms. • Presence of laryngeal symptoms was most strongly
related to impairments in rhinitis-specific quality of life.
9. Vandenplas O, Malo JL. Inhalation challenges with agents causing occupational asthma. Eur Respir J 1997;10: 2612–2629.
10. Jaakkola MS, Suuronen K, Luukkonen R, et al. Respiratory symptoms and conditions related to occupational expo-sures in machine shops. Scand J Work Environ Health 2009;35:64–73.
11. Rosenman KD, Reilly MJ, Kalinowski D. Work-related asthma and respiratory symptoms among workers exposed to metal-working fluids. Am J Ind Med 1997;32: 325–331.
12. Kanerva L, Estlander T, Jolanki R, Pekkarinen E. Occupational pharyngitis associated with allergic patch test reactions from acrylics. Allergy 1992;47:571–573. 13. Hannu T, Piipari R, Toskala E. Immediate
hypersensitiv-ity type of occupational laryngitis in a welder exposed to welding fumes of stainless steel. Am J Ind Med 2006;49: 402–405.
14. Piirila P, Kanerva L, Keskinen H, et al. Occupational respiratory hypersensitivity caused by preparations con-taining acrylates in dental personnel. Clin Exp Allergy 1998;28:1404–1411.
15. Roto P, Sala E. Occupational laryngitis caused by formal-dehyde: a case report. Am J Ind Med 1996;29:275–277. 16. Sala E, Hytonen M, Tupasela O, Estlander T. Occupational
laryngitis with immediate allergic or immediate type spe-cific chemical hypersensitivity. Clin Otolaryngol Allied Sci 1996;21: 42–48.
17. Hannu T, Sala E, Toskala E. Long-term prognosis of imme-diate hypersensitivity type of occupational laryngitis. Respir
Med 2009;103:130–135.
18. Vandenplas O, Ghezzo H, Munoz X, et al. What are the questionnaire items most useful in identifying subjects with occupational asthma? Eur Respir J 2005;26:1056–1063. 19. Moscato G, Vandenplas O, Gerth Van Wijk R, et al.
Occupational rhinitis. Allergy 2008;63:969–980.
20. Chiry S, Boulet LP, Lepage J, et al. Frequency of work-related respiratory symptoms in workers without asthma. Am J Ind Med 2009;52:447–454.
21. Malo JL, Lemiere C, Desjardins A, Cartier A. Prevalence and intensity of rhinoconjunctivitis in subjects with occu-pational asthma. Eur Respir J 1997;10:1513–1515.
22. Leynaert B, Neukirch C, Liard R, Bousquet J, Neukirch F. Quality of life in allergic rhinitis and asthma. A population-based study of young adults. Am J Respir Crit
Care Med 2000;162:1391–1396.
23. Bousquet J, Bullinger M, Fayol C, Marquis P, Valentin B, Burtin B. Assessment of quality of life in patients with perennial allergic rhinitis with the French version of the SF-36 Health Status Questionnaire. J Allergy Clin Immunol 1994;94:182–188.
24. Shedden A. Impact of nasal congestion on quality of life and work productivity in allergic rhinitis: findings from a large online survey. Treat Respir Med 2005;4:439–446. 25. Stull DE, Schaefer M, Crespi S, Sandor DW. Relative
strength of relationships of nasal congestion and ocular symptoms with sleep, mood and productivity. Curr Med Res
Opin 2009;25:1785–1792.
26. Groenewoud GC, de Groot H, van Wijk RG. Impact of occupational and inhalant allergy on rhinitis-specific quality of life in employees of bell pepper greenhouses in the Netherlands. Ann Allergy Asthma Immunol 2006;96:92–97.
27. Gerth van Wijk R, Patiwael JA, de Jong NW, de Groot H, Burdorf A. Occupational rhinitis in bell pepper greenhouse workers: determinants of leaving work and the effects of subsequent allergen avoidance on health-related quality of life. Allergy 2011;66:903–908.
28. Airaksinen LK, Luukkonen RA, Lindstrom I, Lauerma AI, Toskala EM. Long-term exposure and health-related quality of life among patients with occupational rhinitis.
J Occup Environ Med 2009;51:1288–1297.
29. Turley R, Cohen SM, Becker A, Ebert CS, Jr. Role of rhi-nitis in laryngitis: another dimension of the unified airway.
Ann Otol Rhinol Laryngol 2011;120:505–510.
30. Randhawa PS, Nouraei S, Mansuri S, Rubin JS. Allergic laryngitis as a cause of dysphonia: a preliminary report.