British Journal of Rheumatology 1995;34:76O-766
COMPARISON OF THE VALIDITY AND RELIABILITY OF
SELF-REPORTED ARTICULAR INDICES
G. STUCKI, S. STUCKI, P. BRUHLMANN, S. MAUS and B. A. MICHEL Department of Rheumatology and Physical Medicine, University Hospital Zurich, Switzerland
SUMMARY
Our objective was to compare the validity and reliability of three formats for self-administered articular indices assessing pain (PAI) or swelling (SAI). Fifty-five patients with rheumatoid arthritis were asked to mark the degree of pain on a list of 16 joints
(PAI list), to mark 'painful joints' on a mannequin presenting 42 joints (PAI diagram), and to mark 'swollen or tender joints'
on a mannequin presenting 38 joints (SAI diagram). The test-retest reliability (intraclass correlation coefficient) ranged from 0.63 (SAI diagram) to 0.67 (PAI diagram) and 0.85 (PAI list). The correlation with clinical parameters was strongest for the PAI list and the SAI diagram. The association of the SAI diagram with clinical parameters increased with omission of the less reliable toe joints and/or weighting for joint size according to Lansbury. As expected, the short and weighted SAI diagram correlated more strongly with the physician-derived swollen joint count (r = 0.49), C-reactive protein (r = 0.49) and erythrocyte sedimentation rate (r = 0.41) than did the PAI list whereas the PAI list correlated more strongly with physician-derived tender joint count (r = 0.43), global pain measured on a numerical rating scale (r = 0.57) and the Health Assessment Questionnaire (r = 0.49) than did the SAI diagram. We concluded that patients' rating of tender and swollen joints on a mannequin diagram and calculation of a 26-joint and weighted articular index produces an excellent estimate of total joint inflammation, which may be useful in clinical, health services and epidemiological research. An articular index calculated from ratings of pain degree of 16 joints or joint groups may provide complementary information.
KEY WORDS: Clinimetrics, Health services research. Epidemiology, Rheumatoid arthritis, Self-report, Articular Index, Disease activity.
THERE is increasing interest in patient self-report for the assessment of impairment. Although the physician is unquestionably the gold standard for clinical assess-ment, patient self-report may be an interesting alterna-tive for clinical, health services or epidemiological research. Two studies examined the measurement prop-erties of self-report articular indices [1, 2]. Mason et al. found high subject-physician agreement for rating of pain and tenderness presented on a list of 20 joints or joint groups. No data on the association with standard measures of disease activity and no data on test-retest reliability were provided. Stewart et al. reported good test-retest reliability, high subject-physician agreement and sensitivity to change for rating of pain and inflam-mation on a mannequin diagram with 38 joints [2]. The articular index weighted for joint size according to Lansbury did not correlate with C-reactive protein (CRP) whereas the simultaneously recorded physician-derived swollen joint count did [2].
The objective of this study was to examine the validity and reliability of modified list and diagram formats. We hypothesized that asking patients about tenderness or swelling would correlate strongly with clinical parameters of disease activity and acute-phase reactants, whereas asking about pain would correlate strongly with symptoms and physical disability. We
Submitted II October 1994; revised version accepted 27 April 1995.
Correspondence to: G. Stucki, Rheumaklinik und Institut fur physikalische Medizin, Universit5tsspital, Gloriastrasse 25, CH-8091 Zurich, Switzerland.
also hypothesized that grading for pain severity on a list is superior to grading of presence/absence of pain on a mannequin diagram.
METHODS Patients
Fifty-five consecutive patients with rheumatoid arthritis (RA) fulfilling the American Rheumatism Association 1987 revised criteria [3] who attended the rheumatology out-patient clinic at the University Hospital Zurich were included in the study.
Data collection
At a regularly scheduled out-patient visit, patients were asked to complete the self-report articular indices. The patients were then evaluated clinically, and laboratory tests were performed. Test-retest reliability was assessed on data from 50 patients who returned a second questionnaire within 2 weeks of their out-patient visit.
Measures
The mannequin diagram was designed after Stewart et al. (Fig. 1); however, patients were asked to mark 'painful' and 'tender or swollen' joints separately (instead, Stewart et al. asked about 'tender and inflamed' joints). As suggested by Stewart et al. joints on the diagram were labelled with lay terms. Small joints including the metacarpophalangeal (MCP), the interphalangeal and metatarsophalangeal (MTP) joints were to be marked individually. Large and medium joints included elbow, wrist, knee and ankle. Shoulder and hip were presented only on the pain diagram © 1995 British Society for Rheumatology
JOINT FIGURE
1) Please indicate with a mark, on the picture below all joints which are painful at present
2) Please indicate with a mark, on the picture below all joints which are swollen or tender at present
RIGHT LEFT Shoulder joint Hip Joint RIGHT LEFT Finger Joints Knee Joint Ankle Joint Toe Joints Toe Joints
Fio. I.—English translation of the mannequin diagram for the assessment of 'painful' (PAI diagram) and 'tender or swollen' joints (SAI diagram) (designed after Stewart el al. (2]). The German version as used in the study is available from the authors.
because the clinical assessment of swelling of these joints is often difficult or impossible and we did not expect our patients to rate them accurately. The total possible joint count was thus 42 (21 joints each side) for the pain diagram (PAI diagram) and 38 for the diagram assessing swelling (diagram SAI).
The list format of the articular index (PAI list) was designed closely after the format used in the RADAR
questionnaire [1]. Listed large- and medium-sized joints were shoulder, elbow, wrist, hip, knee and ankle (Fig. 2). In addition, patients were asked to rate the degree of pain in their finger and toe joints. In contrast to the RADAR questionnaire, we did not differentiate between hand and finger knuckles because in informal pretesting patients had difficulty differentiating MCP and proximal interphalangeal (PIP) joints. To allow for Plaue mark below the amount of pain you are having today
Shoulder Elbow Wriit Finger joints Hip Knee Ankle Toejointt Right Side None 0 0 0 0 0 0 0 0 Mild 1 1 1 1 1 1 1 1 Moderate 2 2 2 2 2 2 2 2 Severe 3 3 3 3 3 3 3 3 Shoulder Elbow Wri« Finger joinu Hip Knee Ankle Toe joints Leftside None 0 0 0 0 0 0 0 0 Mild 1 1 1 1 1 1 1 1 Moderate 2 2 2 2 2 2 2 2 Severe 3 3 3 3 3 3 3 3
Fio. 2.—English translation of the list format used for the assessment of pain (PAI list) (designed after Mason el al. [ID- The German version as used in the study is available from the authors.
762 BRITISH JOURNAL OF RHEUMATOLOGY VOL. 34 NO. 8
TABLE I
Test-retest reliability of individual joints and joint groups nssrssrd with three self-reported articular indices (kappa statistic) Joint Shoulder Elbow Wrist Hip Knee Ankle MCP PIP MTP SAI diagram (right; left) NA 0.29*; 0.40* 0.19 ; 0.36* NA 0.72*; 0.49* 0.53*; 0.62 0.30-0.60*; 0.38*-0.62* 0.20-0.57*; 0.38*-0.60* 0.05-0.50*; O.O8*-0.55* PAI diagram (right; left) 0.80* 0.50* 0.51* 0.39* 0.56* 0.64* 0.44*-0.77* 0.33*-0.60* 0.03*-0.49* 0.71* 0.29* 0.50* 0.24 0.50* 0.66* 0.47*-0.67* 0.45*-0.57* 0.03 -0.49* PAI list (right; left) 0.62* 0.62* 0.52* 0.72* 0.68* 0.63* 0.72* 0.71* 0.68* 0.65* 0.60* 0.50* 0.66* 0.51* 0.64* IA 0.72* *P < 0.05.
NA, not applicable.
comparison with the pain mannequin, we asked about pain instead of pain/tenderness as in the RADAR [1]. Each joint was graded for severity (0 = no, 1 = slight, 2 = moderate and 3 = severe pain). The total possible joint score was thus 48 (eight joints each side, 3 being the maximal score for individual joints or joint groups).
Patient self-report was used for the measurement of pain [numerical rating scale (NRS), 0-10] and morning stiffness (min). The clinical evaluation included swollen (80 joints) and tender (68 joints) joint counts, grip strength (mean of both sides), and muscle strength (muscle strength index: mean of elbow and knee exten-sion and flexor strength of both sides expressed as percentage of the maximal strength in an RA popu-lation [4]). Laboratory assessment included erythrocyte sedimentation rate (ESR) and haemoglobin. Disease activity was measured with two pooled indices {disease activity score (DAS) [5] and Mallya index [6]}.
Test-retest reliability
Test-retest reliability of the articular indices was assessed with the intraclass correlation coefficient (ICC). Reliability for the individual joints was assessed with use of Cohen's coefficient kappa (for comparison with the PAI list, we dichotomized the responses to no vs slight, moderate or severe pain). According to guidelines provided by Landis and Koch [7] a kappa greater than 0.75 denotes excellent reproducibility, a kappa between 0.4 and 0.75 denotes good reproduci-bility and a kappa between 0 and 0.4 denotes marginal reproducibility.
Concurrent validity
Concordance of the patient-derived SAI diagram and physician's assessment of 'tender or swollen' joints (38 count) was determined by the ICC. Cohen's coefficient kappa was used for agreement of individual joints. Because assessment of 'tender or swollen' joints does not reflect clinical practice and we were interested to study whether the SAI diagram may serve as a surrogate for a physician-derived swollen joint count we also examined the concordance of the SAI diagram with a physician-derived swollen 38-joint count.
Construct validity
The association between the self-report articular indices and clinical and laboratory parameters were assessed with Spearman's rank correlation to account for the non-normal (swollen and tender joint count, morning stiffness, CRP, ESR) or ordinal characteristic [Health Assessment Questionnaire (HAQ)] of most variables.
Weighted and short indices
To examine whether weighting of joint size accord-ing to Lansbury and Hant [8] increases the construct validity of the self-report articular indices, we repeated the above analyses with the weighted values. To exam-ine whether reduction in the number of joints results in a reduced performance, we repeated the above analyses for 26 joints, excluding toe and ankle joints. This corresponds to the 28-articular index proposed by Fuchs et al. minus the shoulder joints which were not presented on the mannequin diagram [9, 10].
Statistical analysis
Data were analysed using the Statistical Analysis System (SAS Institute, Cary, NC, USA). P values (two-tailed) less than 0.05 were considered significant.
RESULTS
Of 55 patients included in the study, 63% were female. The median age was 62 yr (25th percentile: 51; 75th percentile 70). All patients were Caucasian, 96.8% graduated from high school, and 62.8% graduated from college or had professional training. The median disease duration was 5.14yr (range 1.4-11.6 yr). Clini-cal characteristics (median, 25th and 75th percentile values) are shown in Table III. The median SAI diagram was 3 (25th percentile 0; 75th percentile 10), the median diagram PAI was 8 (2; 18) and the median PAI list was 8 (3; 14).
Test-retest reliability
The test-retest reliability of the global scores ranged from 0.63 (SAI diagram) to 0.67 (PAI diagram) and 0.85 (PAI list). Reliability for individual joints ranged from 0.50 to 0.72 for the PAI list (Table I). These results indicate good to excellent reproducibility [7].
For both the PAI diagram and the SAI diagram, low reliability was observed for the MTP joints, with kappas as low as 0.03, which denotes marginal reproducibility [7]. Marginal-to-excellcnt reliability was observed for all other joints [kappa range, 0.19 (wrist)-0.8 (shoulder)] (Table I).
Concurrent validity
There was a high level of agreement between the SAI diagram and a corresponding physician-derived 'tender or swollen' 38-joint count (ICC = 0.54). The agreement for individual joints varied. Best agreement was observed for the elbow joint (89%) and the knee (80%). There was also a high level of concordance between the SAI diagram and a physician-derived swollen 38-joint count (ICC = 0.44). The median SAI diagram and the median physician swollen 38-joint count were both 3.0 (25th percentile 0 and 2; 75th percentile 9 and 10, respectively) and did not differ significantly (P = 0.29, Wilcoxon rank-sum test) (Table II). Association for individual joints or joint groups ranged from 0.63 to 0.88 (average of both sides) which was virtually identi-cal to agreement between the SAI diagram and a physician-derived 'tender or swollen' joint count. Also, disagreement on involvement was virtually identical whether the SAI diagram was compared to a physician-derived 'tender or swollen' or swollen joint count (data not shown). As for test-retest reliability, there was no (kappa negative) or only marginal agreement for some MTP joints. Patients were significantly (chi-square, P < 0.05) more likely to rate MTP joints as involved than were physicians (14% of MTP joints were rated as involved by patients but not by physicians whereas only 1% of MTP joints were rated as involved by physicians but not by patients). For the other joints and joint groups, there was marginal-to-good agree-ment (kappa range 0.17-0.68). These results are com-parable to reported levels of interrater agreement (kappa range 0.40-0.59) for pairs of rheumatologists indicating the presence or absence of joint tenderness on the Ritchie articular index [11].
Construct validity
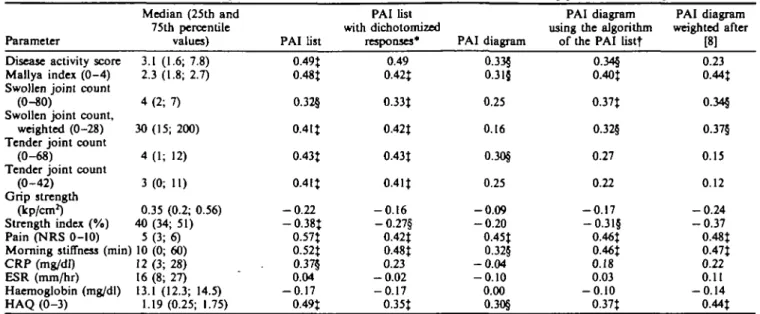
The strength of association with clinical parameters (rank correlation) was strongest for the PAI list and the SAI diagram. The strength of association with clinical parameters was higher for the PAI list than for the PAI
diagram (Table III) and only the PAI list but not the PAI diagram correlated significantly with the CRP. Dichotomization of the four response categories of the PAI list decreased the correlation with clinical par-ameters (Table III). Calculation of a PAI diagram for only the joints used in the PAI list (with use of mean scores for finger and toe joints) or weighted according to Lansbury did not increase the association with clinical parameters.
Short and weighted indices
The association of the SAI diagram with clinical parameters increased with omission of the less reliable toe joints and/or weighting according to Lansbury. With reduction of the number of joints and weighting, the correlation of the SAI diagram with CRP increased from 0.31 to 0.49, the association with the Mallya index increased from 0.50 to 0.67, the association with the HAQ increased from 0.38 to 0.58, and the association with ESR and haemoglobin became significant. The only associations that decreased slightly were that of the SAI diagram with tender joint count and the disease activity score (which includes the unweighted physician-derived swollen joint count as one of three variables).
As expected, the SAI diagram correlated more strongly with the physician-derived swollen joint count (r = 0.42) than did the PAI list (r = 0.32) whereas the PAI list correlated more strongly with physician-derived tender joint count (r = 0.43) than did the SAI diagram (r = 0.33) (Tables III and IV).
The short and weighted SAI diagrams correlated more strongly with the physician-derived swollen joint count (r = 0.49), CRP (r = 0.49), and ESR (0.41) than did the PAI list whereas the PAI list correlated more strongly with physician-derived tender joint count (r = 0.43), global pain measured on a numerical rating scale (r = 0.57), and the HAQ (r = 0.49) than did the PAI list.
DISCUSSION
Our results demonstrate the patient self-report on joint involvement can produce valid estimates of joint count and clinical status. The findings in our Swiss population confirm findings from similar studies in the USA [1] and New Zealand [2] that RA patients are able to consistently complete self-administered articular
TABLE n
Agreement between patient and rheumatologist on joint swelling (physician-derived swollen joint count and SAI diagram Joint Elbow Wrist Knee Ankle MCP PIP MTP
Kappa (right; left) 0.25 ; 0.68* 0.45* 0.61* 0.31* 0.21-0.41* 0.21-0.43* - 0.03-0.20 0.17 0.47* 0.32* 0.11-0.63* 0.12-0.57* - 0.03-0.20 Agreement 88% 63% 82% 80% 75% 84% 85% Disagreement Patient 6% 9% 10% 15% 12% 9% 14% on involvementt Physician 5% 28% 8% 5% 13% 7% 1% */><0.05.
tAverage of both body sides and/or joint groups.
764 BRITISH JOURNAL OF RHEUMATOLOGY VOL. 34 NO. 8
Correlation of the list and mannequin
Parameter
Disease activity score Mallya index ( 0 - 4 ) Swollen joint count
(0-80)
Swollen joint count, weighted (0-28) Tender joint count
(0-68)
Tender joint count (0-42)
Grip strength (kp/cm2) Strength index (%) Pain (NRS 0-10) Morning stiffness (min) CRP (mg/dl) ESR (mm/hr) Haemoglobin (mg/dl) HAQ (0-3) Median (25th and 75th percentile values) 3.1 (1.6; 7.8) 2.3 (1.8; 2.7) 4 (2; 7) 30(15; 200) 4 (1; 12) 3 ( 0 ; 11) 0.35 (0.2; 0.56) 40 (34; 51) 5 (3; 6) 10 (0; 60) 12 (3; 28) 16 (8; 27) 13.1 (12.3; 14.5) 1.19 (0.25; 1.75) formats of the PAI list 0.49J 0.48t 0.32§ 0.4 IJ 0.43t 0.4 It - 0 . 2 2 — 0.38J 0.57t 0.52J 0.37§ 0.04 - 0 . 1 7 0.49t TABLE HI self-administered PAI list
artknilar indices assessing pain with dinical with dichotomized responses* 0.49 0.42J 0.33t 0.42t 0.43t 0.4 It - 0 . 1 6 - 0 . 2 7 § 0.42t 0.48t 0.23 - 0 . 0 2 - 0 . 1 7 O.35t PAI diagram 0.33§ 0.315 0.25 0.16 0.30§ 0.25 - 0 . 0 9 - 0 . 2 0 0.45t 0.32§ - 0 . 0 4 - 0 . 1 0 0.00 0.30§ PAI diagram using the algorithm
of the PAI listt 0.34§ 0.40t O.37t O.32§ 0.27 0.22 - 0 . 1 7 - 0 . 3 1 5 0.46t 0.46t 0.18 0.03 - 0 . 1 0 0.37J parameters PAI diagram weighted after [8] 0.23 0.44t 0.345 0.375 0.15 0.12 - 0 . 2 4 - 0 . 3 7 0.48t 0.47t 0.22 0.11 - 0 . 1 4 0.44t •Dichotomization of responses on the PAI list (no 03 slight, moderate, or severe pain).
tAverage of finger and average of toe joints used for calculation. %P < 0 . 0 1 , §/» <0.05.
indices. However, our study included mostly well-educated patients from an urban population. Also, our patients may have had relatively mild disease with a median disease duration of 5.1 yr and a median HAQ score of 1.19 which indicates moderate disability [12, 13]. Although the articular indices performed well under these circumstances, their usefulness needs to be established for other populations.
The most striking finding of our study was the high degree of association of the SAI diagram with clinical and laboratory parameters. The correlations with these parameters were virtually of the same strength as for a physician-derived swollen joint count. In particular, there was a fair-to-strong relationship with the acute-phase reactants CRP and ESR. The
increased correlation with acute-phase reactants and clinical parameters weighted for joint size indicates that the SAI diagram is a measure of total joint inflam-mation, a finding in line with the increased correlations with physician-derived indices [14, 15].
The performance of the SAI diagram improved noticeably with omission of the toe joints because these joints had a low reproducibility and only marginal agreement with physician's assessment. The highest correlations with acute-phase reactants and clinical parameters were thus observed for a reduced and weighted 26-joint count. With the exception of the shoulder joints, which were not assessed because we did not expect our patients to rate them accurately, the short version is the equivalent of the 26-joint articular
TABLE IV
Correlation of physician-derived swollen joint counts and patient-derived indices on 'tenderness or swelling'
Parameter
Disease activity score Mallya index ( 0 - 4 ) Swollen joint count (0-80) Swollen joint count, weighted Tender joint count (0-68) Tender joint count (0-42) Strength index (%) Pain (NRS 0-10) Morning stiffness (min) CRP (mg/dl)
ESR (mm/hr) Haemoglobin (mg/dl) HAQ
Physician Swollen joint count.
weighted [8] 0.51t 0.67t O.77t (0-28) 0.95t 0.34§ 0.39t - 0.39t 0.50t 0.59t 0.5It 0.3l§ - 0.37t O.38t SAI diagram* 0.43t 0.50t 0.42t 0.37J 0.33§ 0.335 - 0 . 2 8 § 0.40t 0.46t 0.315 0.25 - 0 . 2 4 0.36J Patient SAI diagram. shortf 0.40t O.55t 0.411 0.411 0.29§ 0.285 - 0.42t 0.46t 0.44t 0.40t 0.34§ - 0 . 3 0 5 O.53J self-report SAI diagram, weighted* 0.39t 0.64t 0.49t 0.57t 0.27 0.25 -0.44t 0.52t 0.55t 0.45t 0.38t -0.345 O.53t SAI diagram, weighted, shortj 0.38t 0.67t 0.49t 0.61 % 0.255 0.22 - 0 . 5 1 t 0.53t 0.56t 0.49t 0.4 It - 0.37t 0.58t •Thirty-eight count. tTwenty-six count t/><0.0!,5/><0.05.
index proposed by Fuchs et al. [9, 10]. The self-administered 26-joint swollen count may thus serve as a surrogate for the Fuchs articular index.
Whereas we found a high degree of association of the SAI diagram with acute-phase reactants, Stewart et al. [2], who first developed a SAI diagram, did not find such an association. Weighting does not explain the difference, since Stewart et al. used weighting of the joint surface in their study. However, framing of the question may have been important. We asked about tenderness or swelling, whereas Stewart et al. asked about tenderness and inflammation. In informal pretesting, patients and health-care professionals were uneasy about what exactly was meant by inflammation whereas swelling was understood unambiguously. Also, we used tenderness or swelling to avoid confusion about joints that may be swollen or tender but not both. We considered using and I or but decided to use or for simplicity. The suggestion that framing plays an important role in self-reported articular indices is supported by the finding that asking about painful joints using a mannequin identical to that used for the assessment of swollen joints resulted in high correlations with overall pain and physical disability but in nonsignificant correlations with acute-phase reactants.
Rating pain severity presented on a list proved to be superior to rating of painful joints presented on a mannequin diagram. Grading for pain severity on the list format but not on the mannequin format explains part of the discrepant performance of the two formats. Dichotomization of the responses to the PAI list resulted in decreased correlations with clinical and laboratory parameters; it is important to note that the correlation with CRP became non-significant. In con-trast to the findings for the self-report on swollen joints, weighting did not improve the correlations of the self-report on painful joints. This finding is in line with the results for physician-derived tender joint counts whose correlation with CRP did not increase with weighting [14]. We did not attempt to weight the PAI list because there is no obvious way to weight joint groups. The PAI list implicitly adjusts for joint size because all finger joints and all toe joints are rated as a whole.
Several limitations of the study require comment. First, we did not formally assess the preference of our patients for the list or the mannequin format. However, all patients filled in the forms, which were handed to them without specific explanation. In a recent com-munication, patients accepted either a list or a diagram format and had no preference for either format [16]. Second, we did not assess whether patients were able to identify their joints correctly. However, the good reproducibility of all indices and the good agreement with physician's assessment for the SAI diagram indi-cate that patients on average can correctly classify their joints. This assumption is supported by the recent communication by Haynes et al., who found that patients can correctly identify their joints on a list and a diagram format [16]. Third, we did not present
agreement of pain assessment with physician's assess-ment of tender joints because pain as perceived by the patient and tenderness as discerned by the physician represent different, although related, concepts. How-ever, consistent with our expectation, there was only a marginal-to-moderate concordance between the pain indices and physician-derived tender joint count with kappa's ranging from 0 to 0.48 (11 out of 42 significant) for the PAI diagram and from 0 to 0.50 for the PAI list (nine out of 16 joint/joint groups significant). Fourth, assessment of test-retest reliability by mailing was within 2 weeks which may be quite long for pain measures. We may thus have underestimated the test-retest reliability. Fifth, following Stewart et al. [2] we did not include the shoulder joint in the SAI diagram. However, because we defined the SAI dia-gram as swelling or tenderness, assessment of shoulder joints may be possible. Inclusion of the shoulder joint would be advantageous when using the SAI diagram as surrogate for a physician-derived 28-joint count. However, this needs further testing.
In summary, the patient is a reliable source of clinical information. Patients' rating of tender or swollen joints on a mannequin diagram and calculation of a 26-joint and weighted articular index produce an excellent estimate of total joint inflammation, which may be useful in clinical, health services, and epidemiologjcal research. An articular index calculated from ratings of the degree of pain in 16 joints or joint groups may provide information complementary to rating of 'swelling or tenderness'.
ACKNOWLEDGEMENTS
We thank Maja Michel for help with the data collection and the preparation of the manuscript, and the physicians from the out-patient clinic, Department of Rheumatology, University Hospital Zurich, for their help with the data collection.
Dr Stucki is a recipient of a fellowship of the Swiss Science National Foundation and grants from the EULAR and the Swiss Associations of Physical Medicine, Rehabilitation and Rheumatology.
REFERENCES
1. Mason JH, Anderson JJ, Meenan RF, Haralson KM, Lewis-Stevens D, Kaine JL. The rapid assessment of disease activity in rheumatology (RADAR) question-naire. Validity and sensitivity to change of a patient self-report measure of joint count and clinical status. Arthritis Rheum 1992^35:156-62.
2. Stewart MW, Palmer DG, Knight RG. A self-report articular index measure of arthritic activity: Investi-gations of reliability, validity and sensitivity. / Rheumatol 1990;17:1011-15.
3. Arnett FC, Edworthy SM, Bloch DA, McShane DJ, Fries JF, Cooper NS, Healey LA, Kaplan SR, Liang MH, Luthra HS, Medsger TA Jr, Mitchell DM, Neustadt DH, Pinals RS, SchaUer JG, Sharp JT, Wilder RL, Hunder GG. The American Rheumatism Associ-ation 1987 revised criteria for the classificAssoci-ation of rheumatoid arthritis. Arthritis Rheum 1988^1:315-24.
766 BRITISH JOURNAL OF RHEUMATOLOGY VOL. 34 NO. 8
4. Stuclci G, Schonbachler J, Briihlmann P, Mariacher S, Stoll T, Michel BA. Docs a muscle strength index pro-vide complementary information to traditional disease activity variables in patients with rheumatoid arthritis?
J Rheumatol 1994;21:2200-5.
5. Van der Heijde DMFM, van't Hof MA, van Riel PLCM, van Leeuwen MA, van Rijswijk MH, van de Putte LBA. Validity of single variables and composite indices for measuring disease activity in rheumatoid arthritis. Ann
Rheum Dis 1992;51:177-81.
6. Mallya RK, Mace BEW. The assessment of disease activity in rheumatoid arthritis using a multivariate analysis. Rheumatol Rehabil 1981;2O:14-17.
7. Landis JR, Koch GG. The measurement of observer agreement for categorical data. Biometrics 1977; 33:159-74.
8. Lansbury J, Haut DD. Quantitation of the manifes-tations of rheumatoid arthritis. 4. Area of joint surfaces as an index to total joint inflammation and deformity.
Am J Med Sci 1956^32:150-5.
9. Fuchs HA, Brooks RH, Callahan LF, Pincus T. A simplified twenty-eight joint quantitative articular index in rheumatoid arthritis. Arthritis Rheum 1989;32:531-7. 10. Fuchs HA, Pincus T. Reduced joint counts in controlled
clinical trials in rheumatoid arthritis. Arthritis Rheum 1994^7:470-5.
11. Hart LE, Tugwell P, Buchanan WW, Norman GR, Grace EM, Southwell D. Grading of tenderness as a source of interrater error in the Ritchie articular index. / Rheumatol 1985;12:716-17.
12. Fries JF, Spitz PW, Kraines RG, Holman HR. Measurement of patient outcome in arthritis. Arthritis
Rheum 1980;23:137-45.
13. Briihlmann P, Stucki G, Michel BA. Evaluation of a German version of the physical dimension of the health assessment questionnaire in patients with rheumatoid arthritis. / Rheumatol 1994;21:1245-9.
14. Thompson PW, Silman AJ, Kirwan JR, Currey HLF. Articular indices of joint inflammation in rheumatoid arthritis. Correlation with the acute-phase response.
Arthritis Rheum 1987^0:618-23.
15. Thompson PW, Kirwan JR, Currey HLF. A comparison of the ability of 28 articular indices to detect an induced flare of joint inflammation in rheumatoid arthritis. Br J
Rheumatol 1988^7:375-80.
16. Haynes J, Hewlett S, Kirwan JR. Initial studies to investigate a self report articular index (SRAI). Scand J