Printed in Great Britain. All rights reserved © 1987 ICIPE—ICIPE Science Press
AN OVERVIEW OF A SYSTEMS MODEL OF
CASSAVA AND CASSAVA PESTS IN AFRICA
A. P. GUTIERREZ1 , B. WERMELINGER12 , F. SCHULTHESS3 , J. U. BAUMGARTNER2 , J. S. YANINEK3 , H. R. HERREN3 , P. NEUENSCHWANDER3 , B. LOHR3 , W. N. O. HAMMOND,3 and C. K. ELLIS1'Division of Biological Control, University of California, Berkeley, USA; 2Institut fur Phytomedizin, ETH, Zurich, Switzerland; international Institute of Tropical Agriculture, Ibadan, Nigeria
(Received 10 March 1987)
Abstract—A systems model is described for cassava, Manihot esculenta Crantz, two of its introduced herbivores, the cassava green mite (CGM), Mononychellus tanajoa (Bondar), sensu lato, and the cassava mealybug (CM), Phenacoccus manihoti Mat.-Ferr., the introduced CM parasitoid, Epidinocarsis lopezi (DeSantis) and coccinellid predator of the genus Hyperaspis. The systems model includes the effects of weather, soil nitrogen and water levels on the interactions of the system's components.
The model simulates the distribution of developmental times of cohorts initated at the same time, as well as the number and biomass (energy) dynamics of all populations over time. Biomass acquisition and allocation at the population and organism subunit levels (e.g. leaves, fruit, ova) were also simulated. A common acquisition (i.e. functional response) submodel was used to estimate daily photosynthetic as well as nitrogen and water uptake rates in cassava, in addition to herbivory, parasitism and predation rates for the arthropod species.
This paper presents an overview of the systems model. Simulation results for the plant under pest free conditions were compared to field data. In addition, the model was used to estimate tuber yield losses due to CM and CGM feeding, and to examine the beneficial effects of introduced CM natural enemies as measured by reductions in tuber yield losses.
Key Words: Cassava systems model, Phenacoccus manihoti, Mononychellus tanajoa, Epidinocarsis lopezi, Hyperaspis spp.
Resume—Un modele de systeme est decrit pour le manioc, pour deux des herbivores introduits de cette culture (l'acarien vert (CGM), Mononychellus tanajoa (Bondar) sensu lato, et la cochenille farineuse du manioc (CM) Phenacoccus manihoti Mat.-Ferr, pour le parasitoide (Epidinocarsis lopezi (DeSantis)) introduit de la cochenille ainsi que pour une coccinelle predatrice (Hyperaspis spp.) de la cochenille. Ce modele de simulation tient compte des effets du climat, de l'azote et du regime hydrique du sol sur les interactions entre les composantes du systeme.
Le modele simule la repartition des temps de developpement de cohortes entamees au meme moment, ainsi que la dynamique du nombre et de la biomasse (de l'energie) de toutes les populations au fil du temps. L'acquisition et la repartition de la biomasse au niveau de la population et des sous-unites intra-organismes (ex. feuilles, fruits, oefs) ont ete egalement simulees. En vue d'estimer les taux quotidiens de photosynthese, d'absorbtion d'azote et d'eau, d'herbivorisme, de parasitisme et de predation pour les especes d'arthropodes, un sous-modele commun d'acquisition (c'est-a-dire de reponse fonctionelle) a ete utilise.
Ce document presente une vue d'ensemble de ce modele de systeme. Les resultats de la simulation pour les plantes non infestees ont ete compares aux donnees enregistrees en champ. En outre, le modele a servi a estimer les pertes de rendement en tubercules dues a la cochenille et a l'acarien vert, ainsi qu'a observer les effets benefiques de ['introduction des ennemis naturels de la cochenille, en mesurant les reductions enregistrees dans les pertes de rendement en tubercules.
INTRODUCTION required, hence the Africa-wide Biological Control
Programme for Cassava Pests (ABCP) was begun at Cassava, Manihot esculenta Crantz; Euphorbiaceae the International Institute of Tropical Agriculture is a species native to South America that was (IITA), Ibadan, Nigeria to meet this challenge. Bio-introduced to Africa in the 1600's where it quickly logical control of CM has advanced considerably became an important staple food. During the past since the first establishment of the exotic parasitoid 16 years, two important pests, the cassava green mite Epidinocarsis lopezi (DeSantis) (Herren and Lema, (CGM), Mononychellus tanajoa (Bondar) sensu lato 1982). This parasitoid has now spread over much (Acari: Tetranychidae), and the cassava mealybug of the African cassava belt (Herren et al., 1987). (CM), Phenacoccus manihoti Mat.-Ferr. (Homoptera, However, the cassava green mite remains unchecked. Pseudococcidae) were accidentally introduced into The overall goals of the systems analysis corn-Africa, causing yield reductions of 30-80%. ponent of the ABCP were to help focus the research Chemical control of cassava pests was not ecologi- effort, to examine the dynamics of the various com-cally, economically nor logistically feasible. Longer- ponents of the cassava system, to estimate the effects term solutions for the control of CM and CGM were of CGM and CM on tuber yields, to examine the
effects of natural enemies (i.e., the exotic parasitoid
E. lopezi and indigenous coccinellid predators of the
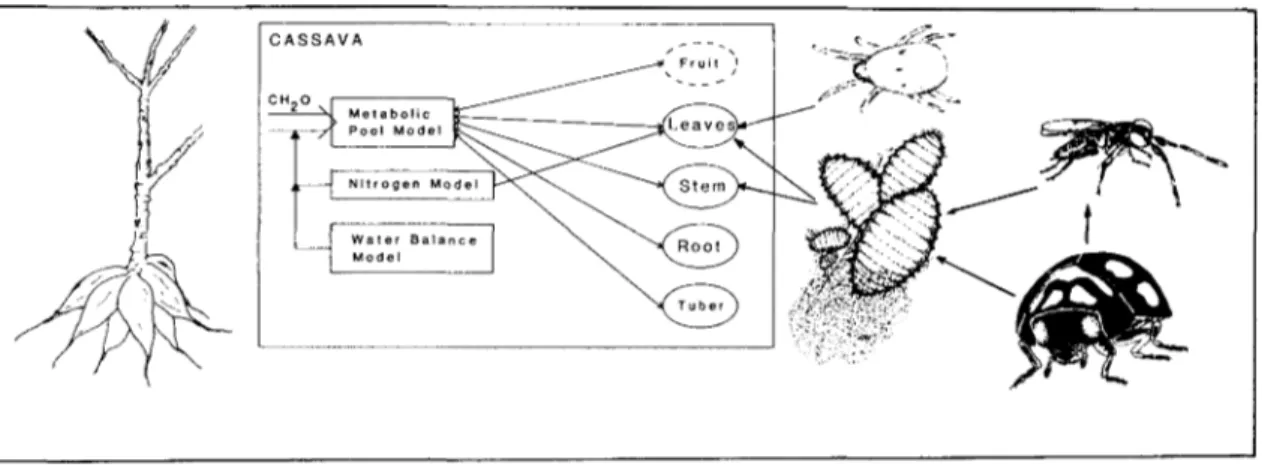
genus Hyperaspis) on CM dynamics in conjunction with the effects of abiotic factors (temperature, rain-fall, solar radiation, soil nitrogen and water) on the dynamics and interactions of the different species. The system components and their interactions are shown in Fig. 1.
In this paper, an overview of the systems model is presented only from a biological point of view. To lay a complete mathematical foundation for the model would be beyond its scope. The details of this model and a complete analysis of cassava growth, develop-ment and yield formations as influenced by its inter-actions with weather, pests and natural enemies are presented in detail later.
POPULATION DYNAMICS MODEL
Development of crop system models is becoming commonplace (Gutierrez and Wang, 1976; Wang
et al, 1977; Curry et al, 1978; Brown et al, 1985;
Gutierrez et al, 1975, 1976, 1987; and Baumgartner
et al, 1986). In this work a distributed delay model
(cf. Manetsch, 1976; Vansickle, 1977) modified by Gutierrez and Baumgartner (1984a, b) and Gutierrez
et al (1976, 1987) was used to simulate the
popula-tion dynamics of all species as well as the nitrogen economy and water balance of cassava. The model is driven by observed weather and simulates the number and mass dynamics of each species including age structure; mimics the distribution of cohort develop-mental times; and incorporates the time-varying effects of energy supply/demand on birth, death, emigration, immigration, and growth rates of all species. An important aspect of this model is the notion that each population must acquire resources, and the rate of acquisition relative to their demand for assimilates determines whether the population grows or declines. A full discussion of the char-acteristics of this model are given in Gutierrez and Baumgartner (1984a).
Resource acquisition: carbon, nitrogen and water
The process of photosynthesis in plants to acquire the energy (supply of carbon) required for growth and development (i.e. demand), and the processes of herbivory and predation (parasitism) are concep-tually similar (Gutierrez et al, 1981). The functional response model is normally used to describe the relationship between the rate of prey capture per predator and prey density. Here we use it to estimate the rate of energy acquisition of one trophic level from a lower one. Leaves seek light, herbivores seek plants or plant parts, and carnivores (parasitoids and predators) seek prey (hosts). The processes of nitro-gen (N) and water uptake by plants may likewise be viewed as predation processes as roots seek both requisites. These analogies have been explored by Gutierrez et al. (1987). The shape of the functions describing the relationship between requisite capture (i.e. the supply) and that available in the environment is upwards convex (i.e. a type II functional response from predation theory).
Historically, we have used the Frazer-Gilbert (1976) functional response model to describe these relationships because of its property that the demand rate (see below) is the major driving variable deter-mining the acquisition or supply rate under the prevailing conditions of resource availability and weather. Gutierrez et al. (1981, 1984b, 1987) used this model to predict photosynthetic rates in plants, as well as predation and herbivory rates in arthropods. Here it has been extended to predict water and nitrogen acquisition rates in cassava.
In this paper, we emphasize the cassava model, but the principles apply equally to the other trophic levels shown in Fig. 1.
Parameters for the Frazer-Gilbert Model
The F-G model is the resource acquisition model. The F-G model estimates the birth rate of new biomass or individuals into, say, the _/th population (or trophic level), but at the same time it estimates the
C ASSAVA 0 s — 7
H
M e t a b o l i c Pool Model r— \ N i t r o g e n Model W a t e r B a l a n c e Model ^^--^* F r u i t ^i > / T u b e r JTemperature, Solar Radiation, Nitrogen and water
Fig. 1. The cassava systems model for Africa.
https:/www.cambridge.org/core/terms. https://doi.org/10.1017/S1742758400023195
Cassava systems model 921
death rate or loss of biomass or numbers from the y'-lth population.
Resource base. The energy resource base for plants
(e.g. cassava) is the light incident on its growing space, while the nitrogen (nitrates) and water in the maximum soil volume are the resources sought by the roots. For consistency of units, the light energy fall-ing per unit area (cal/cm2/day) may be converted to dry matter equivalents using theoretical values re-ported by Loomis and Williams (1963, see Gutierrez
et al, 1987).
For CGM, the resource base is the quantity of suitably aged leaf matter; for the CM it is the quantity of available plant sap; for the parasitoid
E. lopezi, it is the number of suitably aged CM in its
search space; for the coccinellid predator, it is the mass of unparasitized and active parasitized CM life stages plus all coccinellid larvae younger than the one considered. Hyperaspis spp. are among the most abundant indigenous CM predators (Neuenschwander
et al, 1987). Since their biologies have not been
studied in much detail, life-table data were instead taken from a study on H. jucunda Muls. (She, 1985).
The demand rate. The species demand rate is a
measure of what an organism of a population needs to grow at the maximum rate, but it is the environ-ment that determines how much of the available resource it can acquire (supply). For plants, the maximum assimilation rates of photosynthate (car-bon) for growth, reproduction, reserves and respira-tion is the demand rate, while the photosynthetic rate is the realized supply rate (Gutierrez et al., 1975). The nitrogen demand is a fraction of the carbon demand, and the demand for water is the maximum evapo-transpiration rate. The maximum demand rates may be estimated from plants grown under nonlimiting conditions. Similar analogies can be made for arthro-pods, and their demand rates can also be estimated by growing them under nonlimiting conditions. In all our models, the interplay between supply and demand determines the growth, birth, death and net immigration rates, and developmental rates.
Searching. All organisms search in one way or
another for their requisites, and search is an impor-tant component of the F-G model. In plants, the proportion of light that falls on a leaf surface in-creases exponentially with increasing leaf area index (LAI) (i.e. a type II function, Evans, 1975). This function is used to estimate the search parameter in the F-G model. LAI is an index of the leaf surface area relative to the area the plant may occupy. Leaf area is a linear function of leaf mass. The F-G search parameter for the nitrogen and water models corre-sponds to that for light, and hence assumes that the efficiency of the below ground search proceeds in parallel with that above ground.
In predation (also parasitism and herbivory) theory, it is assumed that the proportion of the search space examined increases with predator size at the per capita level, and with total predator mass at the population level. Leaves may be thought of as light predators whose search efficiency drops off with age. The rate of search and the model for predators, parasitoids and herbivores is thus of the same form as the search model of leaves for light.
The search model described above, known as a
Montieth function in plant physiology, is the same as the Nicholson-Bailey model of animal ecology (Gutierrez and Wang, 1976). In our systems model, it is a parameter of the F-G model. The F-G model is sensitive to the value of the search parameter only at low levels of resource (i.e. prey).
Within trophic level resource allocation
Carbon. Carbon fixed (energy) from
photosyn-thesis or predation and herbivory is allocated in the model according to the following priority scheme: first to respiration (and egestion where appropriate), then reproduction and lastly to growth and reserves (Gutierrez et al., 1975, 1986; Wang et al., 1977). In all species, energy acquisition and allocation link the organism population model to its subunit models (e.g., fruits, leaves or embryos; Gutierrez et al., 1976; Jones et al., 1974). The production rates of new subunits and the growth rates of existing ones are functions of the ratio of energy supply/demand (in-dex), as are intrinsic death and net immigration rates.
Nitrogen. The model for the allocation of nitrogen
(N) by plants is similar to that for carbon except that respiration costs in units of nitrogen are not assessed. These costs are included in the carbon balance model. The nitrogen supply/demand index is a measure of the health of the plant. In our model, it scales the photosynthetic rate thus affecting the supply side of the carbon index and all rates associated with it (see above). The concentration of N in plant parts and its reallocation from older structures to new ones was also modelled.
The balance of N in the soil is the net of that which decays from organic matter, is fixed by other organ-isms, is added as fertilizers or input in other ways, and is taken up by the plant. The rate of N uptake is also affected by water stress, and in the model this rate is scaled by the water supply demand index (see below).
Nitrogen in plant parts may also have a large impact on the growth and development of arthropods feeding on them. Some published plant models (e.g. Jones et al, 1974; Brown et al, 1985) include this important effect on plant populations, but not its effect on the pests. The effects of leaf N on two-spotted mites fecundity, longevity and survivorship was clearly shown by Wermelinger et al. (1985), and these effects have been extended to CGM and CM population dynamics.
Water. An adequate supply of water is required to
maintain cell turgor and metabolism, transpiration for temperature regulation and to guarantee the flow of nutrients (e.g. N) from the soil to the metabolically active sites in the plant. Most crops are not well adapted to drought, and shortage of water leads in most plants to reduced photosynthesis and growth, and death in extreme cases. Cassava is thought to be drought resistant, but it is extremely susceptible to excess water (Connor et al, 1981). Positive responses to irrigation have been shown, especially during the first couple of weeks after planting (Cock and Reyes, 1985).
Water concentration in the plant is not modelled, rather only the relationship between the evapo-transpiration demand rate, estimated by using the Ritchie (1972) model and the supply, estimated by
using the water version of the F-G model, are con-sidered. The evapotranspiration demand from the Ritchie model is the major parameter driving the water version of the F-G model. The water supply/ demand index scales the nitrogen uptake rate, and also the photosynthetic rate.
The water in the root zone is balanced daily, and is the net of precipitation, irrigation, evaporation from the soil surface, run-off, and that taken up by the plant. The water (and N) available to the plant is determined by root depth and the amount of water in the soil above the permanent wilting point (Connor
et al., 1981). The soil volume is not modelled as
layers, rather the water is considered to be in a tank which plants can access according to their current root envelope. Other analysts have used fine grid maps of the soil profile to model water availability, but such models require much information that is not usually available and are computation intensive. Our simple approach proved quite adequate.
PLANT GROWTH DATA
The extensive field data on the growth and devel-opment of the three branch IITA cassava variety TMS 30572 collected by one of us (FS) during the 1983-1984 seasons at the International Institute of Tropical Agriculture (IITA), Ibadan, Nigeria were used to estimate parameters for the cassava model. Cassava cuttings (12 g) were put in the field at a density of 1 x 1 m on 15 May 1983 at the beginning of the rainy season when the soil moisture level was high. Eight to 10 plants were dug up weekly, and dissected into leaves, stems, tubers and roots, and dried. Cassava fruit mass is very small relative to the total weight of the plant (2.32 + 1.12 g vs 3000+ g dry matter), and is not considered in the model. Weather data from the IITA central weather station were used to drive the simulation model. Time and age in the model are expressed in degree days (DD). In the model, stem, root and tuber growth demands were related to the maximum growth rate of leaves. A leaf is usually produced at each stem node, hence the leaf production rate and their mass growth rates can be easily estimated from the field data. The total demand for growth of leaves at time t is the sum of the products of the frequency of different aged leaves times their maximum age-specific growth demand rates. The realized growth rates and the leaf production rates are scaled by the carbohydrate supply /demand index. The time of branching is deter-mined by the ratio of carbohydrate supply plus reserves to demand.
The parameters for the arthropod models are similarly estimated, but the estimation procedures are not discussed here.
SIMULATION RESULTS Cassava
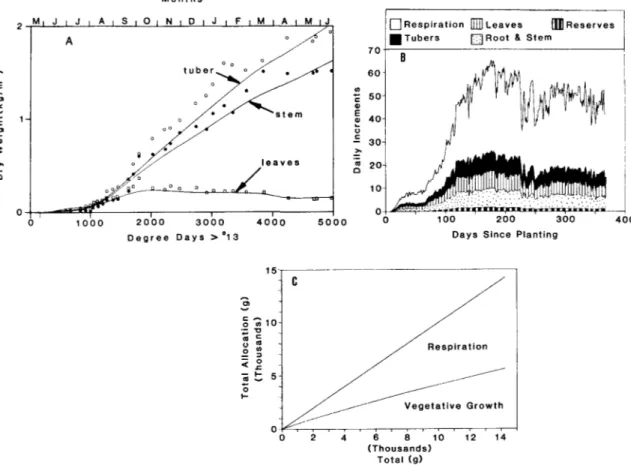
The observed and simulated patterns of leaf, stem plus root and tuber dry matter are shown in Fig. 2A (cf., Fig. 9 in Gutierrez et al., 1987). The simulation results compared well to the field data of 1983/84. The leaf dry matter increased to approximately 220g/plant, then leveled off when the rate of leaf
production equaled the rate of abscission. Still later, the quantity of leaves declined as the rate of leaf production fell below the rate of senescence and abscission. This occurred because the quantity of respiring tissues continued to increase after the leaf canopy had reached its maximum LAI, thus creating an increasing shortfall of photosynthate. This photo-synthate (carbohydrate) stress caused a slowdown in the rate of dry matter accumulation in stem plus root, tubers and reserve. Late season water and nitrogen stress also acted to reduce photosynthetic rates at ca. 3100 DD. The patterns of dry matter accumulation in stem plus root and tubers are very similar, with 3.7% more accumulating daily in tubes. The growth rate of the plant more than doubled at about 900 degree days (DD), when the exponential growth phase began.
The daily partitioning patterns of dry matter are shown in Fig. 2B, and the cumulative values are shown 2C. The results suggest that the partitioning coefficients for photosynthate allocation to all vegeta-tive parts are constants after respiration costs are subtracted. The model further suggests that tuber and stem growth have the same priority as vegetative growth, but both may be used in times of carbo-hydrate stress. This is not new, rather it is reassuring to confirm it. All attempts to redefine the above priorities produced poor simulation results.
Other system components
In practice, the impact of each component on the system would be examined separately, and the inter-action mapped to obtain an overview of the possible range of responses. That is not possible in this paper, but some general results of the more detailed studies are reported.
Water and nitrogen effects. Water and nitrogen
stress in the 1983-1984 crop studied reduced yield ca. 2 and 6%, respectively, but this effect occurred late in the season. In simulation studies, increasing water stress causes abrupt changes in tuber growth patterns caused by defoliation. Nitrogen stress caused a more gradual slowdown in tuber growth rates. Changes in leaf quality occurred in response to changes in soil N, reallocation from older leaves, and the direct effects of water stress on N uptake. Reductions in leaf N increase with plant and leaf age. Reduced N concentrations negatively affected CGM and CM population growth rates via reduced fecundity, longer developmental times and decreased survivorship.
Biological control of cassava pests. A simulation of
the interaction of the systems components illustrated in Fig. 1 is shown in Fig. 3, and illustrates just a small part of the biological detail included in the model. The expected yield losses due to the two pests as modified by the other systems components are indi-cated in the figure as shaded areas. Other studies showed that CM is potentially more damaging than CGM.
In this study, the CM population was started 50 days after planting and its parasitoid and predator were started on day 150. CGM populations were started 170 days after planting at the onset of the dry season. Rainfall mortality suppressed CM popula-tions before the dry season period of increase, but the natural enemies quickly suppressed them after that
https:/www.cambridge.org/core/terms. https://doi.org/10.1017/S1742758400023195
Cassava systems model 923
M o n t h s
M | J | J I A | S I O I N I D | J | F I M I A I M I J Respiration [HQLeaves (HReserves
s [TJRoot & Stem
1 0 0 0
Degree Days > °1 3
100 200 300 Days Since Planting
4 0 0
2 4 6 8 10 12 14 (Thousands)
Total (g)
Fig. 2. Simulated and observed dry matter patterns in cassava: A. simulation of dry matter accumulation, B. daily allocation patterns, and C. cumulative allocation ratios (cf., Gutierrez et al., 1987).
time. Other simulations showed that the same degree of control could be expected from the parasitoid alone, suggesting that the predators contribution to CM mortality was dispensable. This agrees with field observations. Starting the parasitoid earlier in time merely reduced CM populations more quickly.
An explanation of why the host specific parasitoid
E. lopezi alone is capable of quickly suppressing the
CM population emerged. Among the factors which contribute are the fact that the parasitoid prefers to attack older CM life stages in which a maximum investment in time and energy has been made. Not
I/) UJ CD 4000 30002000 I O O O -M O N T H S
Fig. 3. The simulated dynamics of cassava tuber production (g dry matter; T) as influenced by cassava mealybug (CM), cassava green mite (CGM) populations (xlO~2), Epidinocarsis lopezi (P), and the coccinellid predator Hyperaspis (x 10) (C) as well as weather (1982-1983) at IITA, Ibadan, Nigeria.
only are the individuals attacked killed, but also the progeny that they would have shortly produced. A greater proportion of parasitoid females are pro-duced in older CM further mitigating against CM population growth. Lastly the parasitoid feeds on all host stages, perhaps enabling it to extend its survival time in the absence of suitable hosts for oviposition. In contrast, the predator has a high consumption rate, but requires a considerable period of time for its numerical response to suppress CM populations. It has a relatively high requirement for maintenance respiration before egg production can begin and is thought to leave the field when prey levels fall below this maintenance level. Rainfall mortality may reduce CM populations to a level low enough to cause the predator and the CM populations to disengage. In the presence of the parasitoid's attack, low CM populations are commonplace and appear to have resulted in the displacement of native coccinelid predators (Neuenschwander et al., this Issue). Greater tuber yield losses are predicted when the predator as opposed to the parasitoid attack the same initial CM populations.
Effective natural enemies of the cassava green mite have not been released in Africa. Hence, as Yaninek et al. (this issue) have shown, rainfall is the major factor limiting CGM population growth during the rainy season as indicated by their delayed buildup. Low levels of leaf nitrogen may slow CGM popu-lation growth rates at all times of the year. Increasing levels of defoliation due to drought stress also cause increasingly severe abrupt disruptions of CGM populations. The model suggests that CGM damage would be lower on nitrogen poor soils and that combining fertilization and irrigation in arid areas should produce much higher CGM populations.
REFERENCES
Baumgartner J., Graf B., Zahner Ph., Genini M. and Gutierrez A. P. (1986) Generalizing a population model for simulating "Golden Delicious" apple tree growth and development. Ada hortic. 184, 111-122.
Brown L. G., Jones J. W., Hesketh J. D., Hartsog J. D., Whisler F. D. and Harris F. A. (1985) Cotcrop: computer simulation of cotton growth and yield. Miss. Agric. & Forest Exp. Stn., Info. Bull. 69.
Connor D. J., Cock J. H. and Parra G. E. (1981) Response of cassava to water shortage. 1. Growth and yield. Field Crops Res. 4, 181-200.
Cock J. H. and Reyes J. A. (1985) Cassava: Research Production and Utilization. UNDP/CIAT.
Curry G. L., Feldman R. M. and Smith K. C. (1978) A stochastic model of a temperature-dependent population. J. Theor. Biol. 13, 197-204.
Evans L. T. (1975) Crop Physiology—Some Case Histories. Cambridge University Press, Cambridge, Mass.
Frazer B. D. and Gilbert N. (1976) Coccinellids and aphids: a quantitative study of the impact of adult ladybirds (Coleoptera: Coccinellidae) preying on field populations of pea aphids (Homoptera: Aphididae). J. Ent. Soc. Brit. Columb. 73, 33-56.
Gutierrez A. P. and Baumgartner J. U. (1984a) Multitrophic level models of predator-prey energetics: 1. Age-specific
energetic models—pea aphid Acyrthosiphon pisum (Harris) (Homoptera: Aphididae) as an example. Can. Ent. 116, 924-932.
Gutierrez A. P. and Baumgartner J. U. (1984b) Multi-trophic level models of predator-prey energetics: II. A realistic model of plant-herbivore-parasitoid-predator interactions. Can. Ent. 116, 933-949.
Gutierrez A. P., Baumgartner J. U., and Hagen K. S. (1981) A conceptual model for growth, development and repro-duction in the ladybird beetle, Hippodamia convergens (Coleoptera: Coccinellidae). Can. Ent. 113, 21-33. Gutierrez A. P., Christensen J. B., Merritt C. M., Loew
W. B., Summers C. G. and Cothran W. R. (1976) Alfalfa and the Egyptian alfalfa weevil (Coleoptera: Curculioni-dae). Can. Ent. 108, 635-648.
Gutierrez A. P., Falcon L. A., Loew W., Leipzig P. A. and van den Bosch R. (1975) An analysis of cotton production in California: a model for Acala cotton and the effects of defoliators on its yield. Environ. Ent. 4, 125-136. Gutierrez A. P., Schulthess F., Wilson L. T., Villacorta
A. M., Ellis C. K. and Baumgartner J. U. (1987) Energy acquisition and allocation in plants and insects. Can. Ent. 119, 109-129.
Gutierrez A. P. and Wang Y. H. (1976) Applied population ecology models for crop production and pest manage-ment. In Pest Management, International Institute for Applied Systems Analysis (Edited by Norton G. A. and Holling C. S.), pp. 255-280. Proc. Ser.
Herren H. R. and Lema K. M. (1982) First successful releases. Biocontrol News and Infor., C.A.B. 34, 185. Herren H. R., Neuenschwander P., Hennessey R. D. and
Hammond W. N. O. (1987) Introduction and dispersal of Epidinocarsis lopezi (Hym., Encyrtidae), an exotic para-sitoid of the cassava mealybug, Phenacoccus maniholi (Horn., Pseudococcidae), in Africa, Agric. Ecosystems Envir. (in press).
Jones J. W., Thompson A. C. and Hesketh J. D. (1974) Analysis of SIMCOT: Nitrogen and growth. Proc. Belt-wide Cotton Prod. Res. Conf, Memphis, pp. 111-116. Loomis R. S. and Williams W. A. (1963) Maximum crop
productivity: an estimate. Crop Sci. 3, 67-72.
Manetsch T. J. (1976) Time varying distributed delays and their use in aggregate models of large systems. IEEE Trans. Sys. Man Cybern. 6, 547-553.
Neuenschwander P., Hennessey R. D. and Herren H. R. (1987) Food web of insects associated with the cassava mealybug, Phenacoccus manihoti Matile-Ferrero (Hem-iptera: Pseudococcidae), and its introduced parasitoid, Epidinocarsis lopezi (DeSantis) (Hymenoptera: Encyrtidae) in Africa. Bull. Ent. Res. 77, (in press).
Ritchie J. T. (1972) Model for predicting evaporation from a row crop with incomplete cover. Water Resource Res. 8, 1204-1213.
She, H. D. N. (1985). The bioecology of the predator Hyperaspis jucunda Muls. (Coleoptera: Coccinellidae) and the temperature responses of its prey, the cassava mealybug Phenacoccus manihoti Mat.-Ferr. (Homoptera: Pseudococcidae). Ph.D. thesis, Univ. Ibadan, Nigeria, 300 pp.
Vansickle J. (1977) Attrition in distributed delay models. IEEE Trans. Syst., Man, and Cybern. 7, 635-638. Wang Y. H., Gutierrez A. P., Oster G. and Daxl R. (1977)
A population model for cotton growth and development: coupling cotton-herbivore interactions. Can. Ent. 109, 1359-1374.
Wermelinger B., Oertli J. J. and Delucchi V. (1985) Effect of host plant nitrogen fertilization on the biology of the two-spotted spider mite, Tetranychus urticae. Ent. exp. appl. 38, 23-28.
https:/www.cambridge.org/core/terms. https://doi.org/10.1017/S1742758400023195