Stability of tryptophan during food processing and storage
2. A comparison of methods used for the measurementof tryptophan losses in processed foods
BY H E N R I K K. N I E L S E N * , A. K L E I N A N D R. F . H U R R E L L ? Research Department, Nest16 Products Technical Assistance Co. Ltd,
CH-1814 La Tour-de-Peilz, Switzerland (Received 18 July 1984 - Accepted 7 September 1984)
I . Tryptophan losses in stored milk powders and in different model systems representing the major reactions of food proteins during processing and storage were determined using four different chemical methods and in a rat assay.
2. Similar tryptophan values were obtained by the three chemical methods which included high pressure liquid chromatography (HPLC) after sodium hydroxide hydrolysis. colorimetric reaction with p-dimethylamino- benzaldehyde @-DAB) after barium hydroxide hydrolysis, and fluorescence of the Norharman derivative after
NaOH hydrolysis.
3. Tryptophan losses in the treated proteins as measured by the alkaline-hydrolysis methods were generally smaller than those determined by the rat assay. Good agreement however was obtained when the chemical value was multiplied by the true nitrogen digestibility.
4. Determination of tryptophan by reaction with p-DAB after papain (EC 3 . 4 . 2 2 . 2 ) digestion gave lower values in the processed proteins than the other chemical methods or the rat assay.
5. A method using alkaline-hydrolysis is recommended, preferably combined with HPLC-measurement of the liberated tryptophan.
The amino acid content of food proteins is usually determined by ion-exchange chroma- tography after acid-hydrolysis (Spackman et at. 1958). Tryptophan, however, must be determined separately as it is degraded during acid-hydrolysis. Several alternative methods have been proposed (Friedman & Finley, 1975), but so far no satisfactory technique has been found (Williams et al. 1982).
Alkaline-hydrolysis is most frequently used to digest the protein, followed by chromato- graphic (Hugli & Moore, 1972; Nielsen & Hurrell, 1985), colorimetric (Miller, 1967), fluorimetric (Buttery & Soar, 1975) or microbial (Boyne et al. 1975) measurement of the liberated tryptophan. Acid-hydrolysis using organic sulphonic acids has also been suggested (Liu & Chang, 1971; Inglis et al. 1976), but this method appears to be inapplicable to foodstuffs (Friedman et al. 1984). Enzymic hydrolysis would be a way to overcome the instability of tryptophan during acid-hydrolysis and, to a lesser extent, during alkaline- hydrolysis, but with heated protein it may not be complete (Hurrell et al. 1976).
In the previous paper (Nielsen et al. 1985), we compared the losses of tryptophan with those of lysine and methionine in model systems simulating the major reactions which proteins can undergo during the processing and storage of foods. In the present paper, using essentially the same model systems, we compare the ability of the high pressure liquid chromatography (HPLC), colorimetric and fluorimetric determinations of tryptophan after alkaline-hydrolysis, and a colorimetric method using enzyme predigestion, to predict losses of bioavailable tryptophan as measured in a rat assay.
None of the total tryptophan methods accurately predicted bioavailable tryptophan when protein digestibility was significantly reduced. Nevertheless, an HPLC method (Nielsen &
* Present address: Novo Industri A/S, Novo AIIC, DK-2800 Bagsvaerd, Denmark
t For reprints.
available at https:/www.cambridge.org/core/terms. https://doi.org/10.1079/BJN19850036
294
H . K . N I E L S E N ,
A. K L E I N
A N DR. F. H U R R E L L
Hurrell, 1985) using a similar hydrolysis procedure to that of Hugli & Moore (1972), and 5-methyltryptophan as an internal standard (Wilkinson et al. 1976), proved to be the method of choice.
E X P E R I M E N T A L Test materials
The preparation of the model systems representing the different reactions of proteins during food processing and storage has been described in the previous paper (Nielsen et al. 1985). The model systems were designed to be representative of the reactions of food proteins with lipid oxidation products, hydrogen peroxide, polyphenolic substances, alkali and reducing sugars. Additional samples of whole-milk powder stored at 70" were the same materials as used by Hurrell et al. (1983).
Analytical methods
Tryptophan was determined by four different chemical methods :
HPLC after sodium hydroxide hydrolysis (Nielsen & Hurrell, 1985). Hydrolysis was made with NaOH in evacuated, sealed tubes placed in an oven. Tryptophan was measured by reverse-phase HPLC with fluorimetric detection. 5-Methyltryptophan was added to each
sample as an internal standard and its recovery after hydrolysis was used to correct for the losses of tryptophan that occurred during hydrolysis.
p-Dimethylaminobenzaldehyde (p-DAB) after barium hydroxide hydrolysis (Miller, 1967). Hydrolysis was made using Ba(OH), in polypropylene flasks in an autoclave and tryptophan was measured by colorimetric reaction with p-DAB. Free tryptophan was added to additional duplicate samples before hydrolysis and its recovery was used to correct for the loss of tryptophan in the test material.
Fluorimetric determination after NaOH hydrolysis (Buttery & Soar, 1975). Hydrolysis was made with NaOH in polypropylene tubes placed in an autoclave. Tryptophan was measured fluorimetrically as the Norharman derivative after reaction with formaldehyde and oxidation by ferric chloride. Free tryptophan was added to duplicate samples before hydrolysis and its recovery was used to correct for the loss of tryptophan in the sample.
p-DAB after papain (EC 3 . 4 . 2 2 . 2 ) digestion (Mauron et al. 1960). The sample was solubilized by papain digestion (E. Merck, Darmstadt, W. Germany), filtered and tryptophan measured by reaction with p-DAB. In order to compensate for different colour yields, free tryptophan was added to extra portions of the hydrolysates before the colorimetric reaction with p-DAB. The tryptophan content was then determined graphically.
Animal assays
The rat assays for the determination of bioavailable tryptophan and true nitrogen digestibility have been described and reported previously (Nielsen et al. 1985).
R E S U L T S
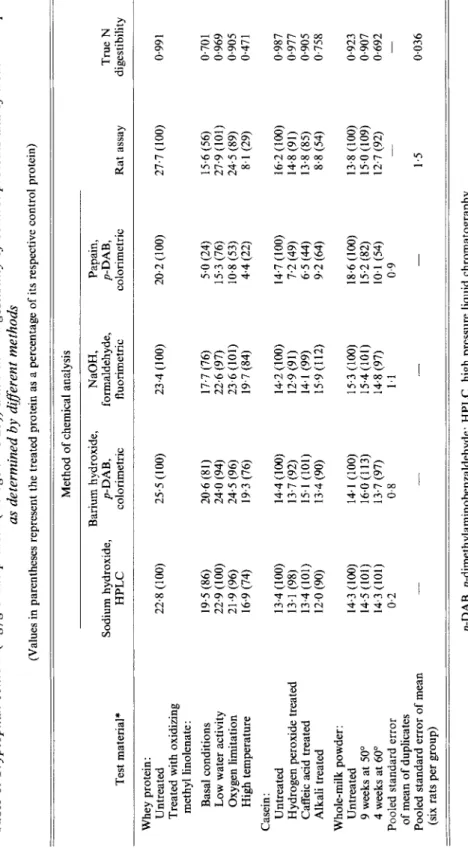
Comparison of chemical methods with bioavailable tryptophan. Table 1 shows the tryptophan content of twelve test materials determined by four different chemical methods and by a rat assay. Considering first of all the untreated proteins, the three chemical methods employing alkaline-hydrolysis gave similar values for the respective samples. The technique using papain hydrolysis and p-DAB gave a somewhat lower absolute value for untreated whey protein and a slightly higher value for untreated milk powder. The bioavailable tryptophan values obtained by the rat assay were a little higher than those obtained after
Table 1. Tryptophan content (mglg crude protein (nitrogen x 6.25)) and true N digestibility of control proteins and of treated samples as determined by di8erent methods (Values in parentheses represent the treated protein as a percentage of its respective control protein) Method of chemical analysis Test material* Barium hydroxide, Sodium hydroxide, p-DAB, HPLC colorimetric NaOH, formaldehyde, fluorimetric Papain, p-DAB, True colorimetric Rat assay digestibility Whey protein: Untreated Treated with oxidizing methyl linolenate : Basal conditions Low water activity Oxygen limitation High temperature Casein : Untreated Hydrogen peroxide treated Caffeic acid treated Alkali treated Whole-milk powder: Untreated 9 weeks at 50" 4 weeks at 60" Pooled standard error of mean of duplicates Pooled standard error of mean (six rats per group) 22.8 (100) 25.5 (100) 19.5 (86) 20.6 (81) 22.9 (100) 24.0 (94) 21.9 (96) 24.5 (96) 16.9 (74) 19.3 (76) 13.4 (100) 14.4 (100) 13.1 (98) 13.7 (92) 13.4 (101) 15.1 (101) 12.0 (90) 13.4 (90) 14.3 (100) 14.1 (100) 14.5 (101) 16.0 (113) 14.3 (101) 13.7 (97) 0.2 0.8 23.4 ( 100) 17.7 (76) 22.6 (97) 23.6 (101) 19.7 (84) 14.2 (100) 12.9 (91) 14.1 (99) 15.9 (112) 15.3 (100) 15.4 (101) 14.8 (97) 1.1 20.2 (100) 5.0 (24) 15.3 (76) 10.8 (53) 4.4 (22) 14.7 (100) 7.2 (49) 6.5 (44) 9.2 (64) 18.6 (100) 15.2 (82) 10.1 (54) 0.9 - 27.7 (100) 15.6 (56) 27.9 (101) 24.5 (89) 8.1 (29) 16.2 (100) 14.8 (91) 13.8 (85) 8.8 (54) 13.8 (100) 15.0 (109) 12.7 (92) - 1.5 0.991 0.701 0.969 0.905 0.47 0.987 0.977 0.905 0.758 0.923 0,907 0.692 - 0.036 p-DAB, p-dimethylaminobenzaldehyde; HPLC, high pressure liquid chromatography. * For details of treatments, see Nielsen er al. (1985).
available at https:/www.cambridge.org/core/terms. https://doi.org/10.1079/BJN19850036
296 H . K . N I E L S E N ,
A.
K L E I N A N DR.
F. H U R R E L L - / / 120 100 20 0 120 100-
ae-
I- 20 0 120 100 0 / / / / /t
/1
I 1 I I I I ) 20 40 60 8 0 100 120 Bioavailable tryptophan (%) ( b )I
I I I I I I * 20 40 60 80 100 120 Bioavailable tryptophan (%) (C)r
0 / Slope = 0.1 5-
r = 0.39-
m t .- ._ o / - /E
E / t / Cl m 1-
4- Cl z / 20 40 60 80 100 120 Bioavailable tryptophan (%)L
I I I I I 1 - 20 40 60 80 100 120 Bioavailable tryptophan (%) 100 80 60 40 20 / I I I I I I - 0 20 40 60 80 100 120 Bioavailable tryptophan (%) /oo
Slope = 0-65 r = 0.83-
80-
/ I 0 I I I I I 20 40 60 80 100 120 Bioavailable tryptophan (%)120
1
(d' 100-
-
s F X / c - / cl 100 - / /alkaline-hydrolysis for whey protein and casein but of the same order for whole-milk powder.
The three chemical methods using alkaline-hydrolysis also gave comparable estimates for tryptophan losses caused by the different treatments. The only exception was for the alkali-treated casein where the HPLC and p-DAB techniques predicted a 10% loss of tryptophan and the fluorimetric technique a 10% gain; the rat assay showed 46% loss of available tryptophan.
In most instances, the three methods using alkaline-hydrolysis predicted smaller trypto- phan losses than those measured by the rat assay. This would appear to have resulted from reduced protein digestibility of the treated samples (Table 1). Fig. 1 shows that better correlations between the animal assay and the three analytical methods were obtained when the analytical results were multiplied by true N digestibility.
The papain p-DAB technique gave lower relative tryptophan values than the other analytical methods and, except for the alkali-treated casein and the 'high temperature ' lipid oxidation sample, the method predicted greater tryptophan losses than that found with the rat assay (Table 1).
Losses of tryptophan in milk powder stored at 70". Fig. 2 shows the content of tryptophan in a whole-milk powder stored at 70" as measured either by HPLC after NaOH hydrolysis or colorimetrically with p - D A B after papain digestion. Using the latter technique, losses up to 40% were found whereas, with the NaOH-HPLC method, losses up to only 8% occurred. In the same samples, reactive lysine fell by 85% (Hurrell et al. 1983).
Losses of tryptophan in whey protein incubated with oxidizing lipids. Fig. 3 shows
tryptophan in whey protein stored with methyl linolenate and water in sealed tins at 37" in the presence of 1 mol oxygen/mol lipid. Again, large losses were observed with the papain,
p - D A B method whereas the NaOH-HPLC technique showed virtually no losses.
available at https:/www.cambridge.org/core/terms. https://doi.org/10.1079/BJN19850036
298
H . K. NI E LS E N,
A. K L E I N
A N DR. F. H U R R E L L
W 2 z-
m 5 r P P 4- t c11
40L
0 2 4 6 8 9Period of storage (weeks)
Fig. 2. Percentage of tryptophan remaining in whole-milk powder stored at 70" as measured by high pressure liquid chromatography (HPLC) after sodium hydroxide hydrolysis ( O ) , or by reaction with
p-dimethylaminobenzaldehyde @-DAB) after papain (EC 3.4.22.2) digestion (0). Values are means of duplicate determinations. For HPLC method, initial tryptophan content was 14.0 mg/g crude protein (nitrogen x 6.25) and pooled SEM was 0.5% ; forp-DAB method, initial value was 14.8 mg/gcrude protein and pooled SEM was 5 % .
100 m m 2 n 20 W
t
0 10 20 30 40 44 Period of storage (d)Fig. 3. Percentage of tryptophan remaining in whey protein stored with methyl linolenate and water (1:0.5:0.27, by wt) at 37" in the presence of 1 mol oxygen/mol lipid. Tryptophan determined by high pressure liquid chromatography (HPLC) after sodium hydroxide hydrolysis (0) or by reaction with p-dimethylaminobenzaldehyde @-DAB) after papain (EC 3 . 4 . 2 2 . 2 ) digestion ( 0 ) . Values are means of duplicate determinations. For HPLC method, initial value was 26.3 mg/g crude protein (nitrogen x 6.25) and pooled SEM was 1 % ; for p-DAB method, initial value was 24.4 mg/g crude protein and pooled SEM was 2 % .
D I S C U S S I O N
The three techniques using alkaline-hydrolysis gave very similar results even though the hydrolysis procedures and the subsequent detection of tryptophan differed in each of the methods. This indicates that the different alkaline-hydrolysis procedures (NaOH under vacuum, Ba(OH), in autoclave, NaOH in autoclave) release similar amounts of tryptophan (as also found by Friedman et al. (1984)) and that the three methods for detection (HPLC, colorimetric and fluorimetric) give similar tryptophan estimates.
However, when compared with the tryptophan bioavailability assay, these three alkaline- hydrolysis methods underestimated the losses of tryptophan that occurred during processing and storage, since they did not take into account the impaired release and absorption of tryptophan which occurred in vivo. True N digestibility was used to estimate the reduction in tryptophan digestibility and, for most samples, a good agreement was found between the chemical value corrected for true N digestibility and the rat-assay value. The alkali-treated casein and the ‘advanced’ Maillard reaction milk powder did not show as close an agreement as the other samples. In the ‘advanced’ Maillard sample, the low N digestibility could be explained by a lower release and absorption of lysine and lysine peptides than of other amino acids. In the alkali-treated casein, it is possible that the release and absorption of tryptophan and tryptophan peptides were especially impaired (Nielsen et al. 1985).
The fourth analytical method, colorimetric reaction with p-DAB after papain digestion, in most instances severely underestimated the bioavailable tryptophan values of the treated proteins as measured by the rat assay. The reasons are unclear. Asp-DAB reacts with both free and peptide-bound tryptophan (Gruen & Rivett, 1971), the aim of the enzyme treatment is only to improve the solubility of the sample and not to hydrolyse the proteins completely. It is possible that cross-linkages and amino acid complexes formed during processing and storage impede the entry of the p-DAB reagent into the partially-hydrolysed protein molecule and thus prevent its complete reaction with all the tryptophan residues. Another more likely explanation is that the papain digestion failed to solubilize the treated proteins completely and that a considerable part of the tryptophan was removed by the post-digestion filtration employed in the method. Our results show that this method cannot be used to measure ‘total’ or ‘available’ tryptophan in processed or stored samples. Earlier studies which have used this method (Finot et al. 1982; Hurrell et al. 1983), or a similar method with no previous hydrolysis or solubilization (Dworschak & Hegediis, 1974), and which have reported large losses of tryptophan in stored or heated milk powders, would appear to be erroneous.
A chemical method which always accurately predicts bioavailable tryptophan in raw and processed foods does not exist. Methods for total tryptophan, like all total amino acid analyses, only accurately predict the bioavailable amino acid when in vivo protein digestibility and amino acid absorption are close to completion. Hopkins (1981) reviewed the true N digestibility in humans of a wide range of raw and processed foods. In most instances N digestibility was 90% or more although, in some processed cereals, it was considerably lower.
Of the total tryptophan methods investigated, those using alkaline-hydrolysis are preferred. The method employing NaOH-hydrolysis followed by HPLC detection had by far the lowest standard error (Table 1). This is presumably because correction for tryptophan losses during hydrolysis is made by adding an internal standard (5-
methyltryptophan). The technique of Miller (1967) and of Buttery & Soar (1975) estimate tryptophan losses during hydrolysis by adding free tryptophan to duplicate samples. Williams et al. (1982) similarly reported that, in a collaborative trial investigating the latter two methods, the variation between laboratories was high and exaggerated by the variation in the recovery of added tryptophan. We would therefore recommend that total tryptophan in processed foodstuffs is measured after alkaline-hydrolysis, and preferentially by HPLC (or ion-exchange chromatography) using 5-methyltryptophan as internal standard. If
bioavailable tryptophan is required, then protein digestibility must also be estimated. The authors wish to thank Dr P. A. Finot and Professor J. Mauron for valuable discussions.
available at https:/www.cambridge.org/core/terms. https://doi.org/10.1079/BJN19850036
300 H .
K.NIELSEN,
A.
K L E I N
A N D R.F. H U R R E L L
R E F E R E N C E SBoyne, A. W., Ford, J. E., Hewitt, D. & Shrimpton, D. H. (1975). British Journal of Nutrition 34, 153-162.
Buttery, P. J. & Soar, J . B. (1975). Journal of the Science of Food and Agriculture 26, 1273-1277. Dworschak, E. & Hegediis, M. (1974). Acta Alimentaria 3, 337-347.
Finot, P. A,, Magnenat, E., Guignard, G. & Hurrell, R. F. (1982). International Journal for Vitamin and Nutrition
Research 52, 226.
Friedman, M. & Finley, J. W. (1975). In Protein Nutritional Quality of Food and Feeds, part I , pp. 423452 [M. Friedman, editor]. New York: Marcel Dekker Inc.
Friedman, M., Levin, C. E., Noma, A. T., Montagne, W. C. & Zahnley, J. C. (1984). In Progress in Serotonin and Tryptophan Research, pp. 119-123 [H. G. Schlossberger, W. Kochen, B. Linzen and H. Steinhart, editors]. Berlin: Walter de Gruyter & Co.
Gruen, L. C. & Rivett, D. E. (1971). Anafytical Biochemistry 44, 519-522.
Hopkins, D. T. (1981). In Protein Quality in Humans: Assessment and In Vitro Estimation, pp. 169-193 [C. E. Hugh, T. E. & Moore, S . (1972). Journal of Biological Chemistry 247, 2828-2834.
Hurrell, R. F., Carpenter, K. J., Sinclair, W. J. Otterburn, M. S. & Asquith, R. S . (1976). British Journal of Hurrell, R. F., Finot, P. A. & Ford, J. E. (1983). British Journal of Nutrition 49, 343-354.
Inglis, A. S., McMahon, D. T. W., Roxborough, C. M. & Takayanagi, H. (1976). Analytical Biochemistry 72, Liu, T.-Y. & Chang, Y. H. (1971). Journal of Biological Chemistry 246, 2842-2848.
Mauron, J., Mottu, F. & Egli, R. H. (1960). Annales de la Nutrition et de l'dlimentation 14, 135-150. Miller, E. L. (1967). Journal of the Science of Food and Agriculture 18, 381-386.
Nielsen, H. K., de Week, D., Finot, P. A., Liardon, R. & Hurrell, R. F. (1985). British Journal of Nutrition 53, Nielsen, H. K. & Hurrell, R. F. (1985). Journal of the Science of Food and Agriculture (In the Press).
Spackman, D. H., Stein, W. H. & Moore, S. H. (1958). Analytical Chemistry 30, 119G1206. Wilkinson, M., Iacobucci, G. A. & Myers, D. V . (1976). Analytical Biochemistry 70, 47W78.
Williams, A. P., Hewitt, D. & Buttery, P. J. (1982). Journal of the Science of Food and Agriculture 33, 860-865. Bodwell, J. S. Adkins and D. T. Hopkins, editors]. Westport, Conn.: Avi Publishing Co., Inc.
Nutrition 35, 383-395.
8 6 9 4 .
281-292.