Cerebral Cortex March 2009;19:563--575 doi:10.1093/cercor/bhn106
Advance Access publication June 18, 2008
Characterization of the HeCo Mutant
Mouse: A New Model of Subcortical Band
Heterotopia Associated with Seizures and
Behavioral Deficits
Alexandre Croquelois
1,2, Fabienne Giuliani
3,4, Christine Savary
2,
Michel Kielar
2, Clotilde Amiot
5, Franc
xoise Schenk
3,4and
Egbert Welker
21
Service de Neuropsychologie et de Neurore´habilitation,
Centre Hospitalier Universitaire Vaudois (CHUV), Avenue
Pierre Decker 5, 1011 Lausanne, Switzerland,
2Department de
Biologie Cellulaire et de Morphologie, Universite´ de Lausanne,
Rue du Bugnon 9, CH-1005 Lausanne, Switzerland,
3Institut de
Physiologie, Centre de Neurosciences Psychiatriques, Site de
Cery, CH-1008 Prilly, Switzerland,
4Institut de Psychologie,
Universite´ de Lausanne, Quartier UNIL-Dorigny, Baˆtiment
Anthropole, 1015 Lausanne, Switzerland and
5Service de
Ge´ne´tique, Histologie, Biologie du De´veloppement et de la
Reproduction (EA 3922), Hoˆpital Jacques, Place
Saint-Jacques, 25030 Besancon cedex, France
In human, neuronal migration disorders are commonly associated
with developmental delay, mental retardation, and epilepsy. We
describe here a new mouse mutant that develops a heterotopic
cortex (HeCo) lying in the dorsolateral hemispheric region, between
the homotopic cortex (HoCo) and subcortical white matter.
Cross-breeding demonstrated an autosomal recessive transmission.
Birthdating studies and immunochemistry for layer-specific markers
revealed that HeCo formation was due to a transit problem in the
intermediate zone affecting both radially and tangentially migrating
neurons. The scaffold of radial glial fibers, as well as the
expres-sion of doublecortin is not altered in the mutant. Neurons within the
HeCo are generated at a late embryonic age (E18) and the
super-ficial layers of the HoCo have a correspondingly lower cell density
and layer thickness. Parvalbumin immunohistochemistry showed
the presence of gamma-aminobutyric acidergic cells in the HeCo
and the mutant mice have a lowered threshold for the induction of
epileptic seizures. The mutant showed a developmental delay but,
in contrast, memory function was relatively spared. Therefore, this
unique mouse model resembles subcortical band heterotopia
observed in human. This model represents a new and rare tool to
better understand cortical development and to investigate future
therapeutic strategies for refractory epilepsy.
Keywords: cerebral cortex growth and development, migration disorder,
models: animal, neuronal neurobehavioral manifestations
Introduction
Development of the neocortex involves complex cellular and
molecular mechanisms, among them neuronal genesis,
migra-tion, cell differentiation and the development of afferent and
efferent connections (Rakic 1988; Honda et al. 2003). Neuronal
migration is controlled by cytoskeletal molecules that regulate
the initiation of migration which is subsequently controlled by
a set of extracellular signaling molecules, such as the reelin
pathway, and other stop signals (Gressens 2006). The
mor-phology of pyramidal neurons undergoes several modifications
that reflect the various steps in the migratory pathway (LoTurco
and Bai 2006). Whereas the progenitors in the ventricular zone
(VZ) are bipolar, migrating neurons are multipolar within the
subventricular zone (SVZ). Upon arrival in the deep
interme-diate zone (IZ), they adopt a bipolar morphology, a
character-istic of the migrating pyramidal neuron that is maintained until
they arrive in their final position in the cerebral cortex.
Interestingly, LoTurco and Bai (2006) hypothesized that failure
to make the transition from the multipolar to the bipolar stage
may be a characteristic of most neuronal migration disorders.
Although some neocortical migrating neurons migrate almost
exclusively radially, others initially take a tangential trajectory
at the level of the VZ or SVZ before adopting a classical radial
migration pathway (Gressens 2000). Radial migration of
neurons is supported by radial glial cells (Rakic 2003) and
concerns the development of cortical projection neurons,
mainly glutamatergic. However, the important pool of
gamma-aminobutyric acidergic (GABAergic) interneurons have their
origin principally in the subcortical telencephalon, in
non-primate mammals mainly in the medial ganglionic eminence
(Wonders and Anderson 2005). In primates however, other
sources have been proposed, including the caudal and lateral
ganglionic eminences, the septal region, and the cortex itself
(Wonders and Anderson 2005). Recent evidence suggests that
the diversity of the origin of GABAergic interneurons can be
correlated with the remarkable diversity in their differentiated
state (Wonders and Anderson 2005).
In human, neuronal migration disorders form a group of
brain malformations which primarily affect development of the
cerebral cortex (Dobyns and Truwit 1995). They are mainly
caused by genetic alterations (Clark 2004, for review). Other
etiologies are infections during pregnancy as well as ischemic
and toxic insults. Such alterations are likely to affect neuronal
migration to the cortex during the third and fourth months of
gestation (Dobyns and Truwit 1995). However, currently
evidence exists that other pathogenic mechanisms could cause
subcortical accumulation of neurons such as modified cellular
proliferation and programmed cell death (Clark 2004).
Neuro-nal migration disorders range in severity from minor
displace-ments of a few neurons (Meencke and Veith 1999; Eriksson
et al. 2005) to massive rearrangements of cortical structure
including the formation of subcortical heterotopia, also called
double cortex. This severe form of diffuse subcortical
hetero-topia is commonly associated with a delay in somatic
develop-ment, mental retardation, and epilepsy. The incidence of cortical
malformations is more than 1% in the human population.
Fourteen percent of epileptic patients have a cortical
malfor-mation based on a migration disorder. This incidence rises to
40% in patients with intractable epilepsy, the majority of them
already presenting seizures during infancy (Farrell et al. 1992;
Meencke and Veith 1992; Guerrini 2005).
We here characterize the phenotype of a new and unique
genetic mouse model of cortical heterotopia (the HeCo
Ó The Author 2008. Published by Oxford University Press. All rights reserved.[heterotopic cortex] mouse). The mutation appeared
sponta-neously in our colony of the NOR strain derived from ICR-stock
(Van der Loos et al. 1986) and was discovered during an
unrelated experiment (Croquelois et al. 2005). We identify and
characterize here the cortical malformation, its mode of
inher-itance and its developmental schedule, as well as the associated
neurological and behavioral deficits exhibited by HeCo mutant
mice.
Materials and Methods
Mice of the NOR and C57/Black6 (C57/Bl6) strains were used in this study. All the procedures described beneath were reviewed and approved by the Office Ve´te´rinaire Cantonal (Lausanne, Switzerland), following Swiss Federal Laws.
Cross-Breeding Experiments
The first HeCo mouse was discovered using histological brain sections performed for unrelated experiments. Selective inbreeding including crossing of living relatives and backcrossing were used to increase the occurrence of the phenotype in offspring. Crossings of HeCo females with C57/Bl6 unaffected males and of HeCo males with C57/Bl6 unaffected females were then performed to define the transmission mode. Phenotype was determined in Nissl-stained coronal sections throughout the forebrain.
BrdU Injections and Immunohistochemistry
Mutant and control pregnant females were injected intraperitoneally with 5-bromo-2#-deoxyuridine (BrdU) (100 lg/g body weight, in phosphate buffered saline [PBS] 0.1 M, Sigma, St Louis, MO). Injections were performed at either embryonic (E)13 (brain removal at postnatal [P]13), E14 (brain removal at E15), E15 (brain removal at E16 and P13), E16 (brain removal at E17), or E18 (brain removal at P13) stages. The day of vaginal plug detection was designated as day 0 of gestation (E0). For juvenile animals (brain removal at P6 or P13), mice received a lethal dose of pentobarbital and were immediately fixed via cardiac perfusion with a solution of paraformaldehyde (1% in phosphate buffer 0.1 M, pH 7.4, for 5 min, then 4% in phosphate buffer 0.1 M, pH 7.4, for another 10 min). For embryos, brains were removed and immersed in para-formaldehyde (4% in phosphate buffer 0.1 M, pH 7.4) for 4 h. After cryoprotection in sucrose (30% overnight), brains were serially cut at 40-lm thickness using a sliding cryotome. Alternate sections were either stained with Cresyl Violet, processed for BrdU immunohisto-chemistry or immunohistoimmunohisto-chemistry for Cux-2, Tbr1, RC2, GLAST, and Dcx (doublecortin). For Parvalbumin (PARV)--immunohistochemistry we used 4 adult HeCo mice that were not exposed to BrdU.
BrdU Immunohistochemistry
We used the protocol described by Takahashi et al. (1992). In brief, sections were immersed in 2 N HCl for 60 min, neutralized in tris-buffered saline (TBS) for 3310 min, and then incubated with primary antibody (anti-BrdU, mouse monoclonal, clone Bu20a, Dako, Switzer-land) at a dilution of 1:100 in TBS 0.05 M overnight at 4 °C. Sections were rinsed in TBS and incubated in biotinylated secondary antibody (Biotin-SP-conjugated AffiniPure Goat Anti-Mouse, Jackson Immuno-Research Europe, Newmarket, UK) for 60 min. The sections were then processed with avidin-biotin-peroxidase complex (ABC) (Vector Laboratories, Peterborough, UK) for 60 min, rinsed in PBS, and visualized with diaminobenzidine (DAB) (Sigma). Sections were dehydrated in a series of graded ethanols, cleared in xylene, and coverslipped using Permount.
Immunohistochemistry PARV Immunohistochemistry
Sections were thoroughly rinsed in PBS, and incubated in a blocking solution containing 10% normal goat serum and 4% bovine serum albumin in PBST (0.2% Triton X-100 in PBS) for 1 h at room temperature. After rinsing, sections were incubated overnight at 4 °C with rabbit anti-PARV (1:1000) antibody. Thereafter, sections were
sequentially incubated with biotinylated goat anti-rabbit antibodies (1:200) and with the ABC (1:200). Peroxidase was developed with 0.05% diaminobenzidine in 0.1 M PB and 0.005% hydrogen peroxide. Thereafter, immunoreacted sections were mounted onto gelatinized slides. Tbr-1, Cux-2, RC2, GLAST, Dcx Immunohistochemistry
Sections were blocked with 2% normal horse serum in PBST with azide (phosphate buffer 0.1 M, NaCl 0.9%, Triton 0.3%, Azide 1 g/L; blocking solution) then incubated overnight at 4 °C with primary antibodies diluted in blocking solution. Secondary antibodies diluted in PBS 0.9% with Triton 0.3% were applied for one hour. Sections were then rinsed in PBS, mounted with chrom-alun 4% and coverslipped. Primary antibodies used: anti-Cux-2 (Millipore Corporation) at 1:150, anti-Tbr-1 (Millipore AG, Zug, Switzerland) at anti-Tbr-1:anti-Tbr-1000, anti-RC2 (Developmental Studies Hybridoma Bank, University of Iowa) at 1:200, anti-GLAST (Millipore Corporation) at 1:5000 and anti-Dcx (Santa Cruz Bio-technology, Santa Cruz, CA) at 1:100, all raised in rabbits. Secondary antibodies used: Alexa 488 Donkey anti-Rabbit (Invitrogen) at 1:300 for Cux-2 and GLAST and Alexa 594 Donkey anti-Rabbit (Invitrogen) at 1:300 for Tbr-1, RC2, and Dcx.
Reconstruction and Morphometric Analysis
To morphometrically characterize the neurons of the HeCo and those of the overlying homotopic cortex (HoCo), contours of neuronal cell body were drawn with a computer controlled microscope and the Neurolucida Software (Microbrightfield, Magdeburg, Germany) in 4 consecutive Nissl-stained sections (spaced 80 lm from each other on the rostro-caudal axis) in both control (n=4) and mutant (n=4) mice. The most rostral section was taken at the level of the most rostral part of the hippocampal formation. Radial thickness of the HeCo and the cortical layers of the HoCo together with cell density were also recorded.
BrdU-positive cells in the cerebral cortex of the right hemisphere were quantitatively analyzed using the brains of 3 P13 mice for each injection date (E13, E15, and E18). Positive cells were plotted using the same device. Per brain, 3 sections (spaced 80 lm from each other on the rostro-caudal axis) were analyzed. The most rostral section was taken at the level of the most rostral part of the hippocampal formation. In mutant mice, 3 contours were drawn around the HeCo, the HoCo and the adjacent, more lateral, cortex (AdCo). In control mice contours corresponding to the HoCo and the AdCo as determined by distance to midline were also drawn. To define the relative position of BrdU-positive neurons within these different regions of interest, the position of the subcortical white matter was plotted for the HeCo and the AdCo. For the HoCo, the thin band of white matter lying between the HeCo and the HoCo was identified as well. These reference lines were used to extrapolate the different curves using Lagrange interpolating poly-nomial. Migration distance was defined for each cell by the minimal distance to the corresponding curve. To allow comparison of the number of BrdU-positive cells between the 3 regions of interest and across embryonic ages of BrdU injection, we divided each region of interest in 10 equivalent tangentially oriented stripes, stripe 1 being the deeper and stripe 10 the more superficial one. The mean number of positive cells for each stripe was obtained from the 4 sections of the 4 animals in each group.
PARV+ cells in the cerebral cortex of the right hemisphere were plotted using the brains of the 4 mutant mice in the same way. Cells were plotted in 3 different regions of interest: the HeCo, the HoCo, and the AdCo. The number of PARV+cells per surface unit, cell size and distance to the closest PARV+cell were determined.
Tracing Experiments
To study neuronal connectivity of the HeCo, 3 mutant mice were anaesthetized with pentobarbital (sodium pentobarbital 60 mg/kg body weight i.p.) and placed in a stereotaxic frame. Part of the skull overlying the medio-dorsal cortex was removed and the HeCo was identified using extracellular recording and stereotaxic coordinates. Biotinylated dextran amine (BDA, Molecular Probes D-7135, MW 3000, Eugene, OR) was injected into the HeCo. The pressure injection was made at 1000-lm cortical depth and lasted for 2 min using the following parameters: 70 nL of a 5% solution in PBS (phosphate buffer 0.1 M, 0.9% saline, pH 7.4). After 10 days survival time, the animals were deeply anaesthetized and
perfused with paraformaldehyde (4% in 0.1 M phosphate buffer, pH 7.4). Serial coronal sections were cut at 40-lm thickness. Sections were processed for DAB reaction (Veenman et al. 1992) and counterstained with toluidine blue.
Histological Examination of Organs and Blood Tests
Adult mice (4 HeCo and 4 controls) received a lethal dose of pentobarbital and were immediately fixed via cardiac perfusion with a solution of paraformaldehyde (4% in phosphate buffer 0.1 M, pH 7.4, for 15 min). Following cryoprotection in 30% sucrose overnight, heart, liver, pancreas, spleen and kidney were removed and cut at 40-lm thickness with a cryotome. Sections were stained with hematoxylin--eosin. Blood samples from 4 control and 4 HeCo mice were obtained after a 16-h fasting period and processed for analysis of electrolytes (Na+, K+, Cl–
), creatinin, glucose and cholesterol.
Pilocarpine Induced Status Epilepticus
Sensitivity for the development of epileptic seizures was compared between HeCo and control mice using the pilocarpine induced status epilepticus (SE) model (Cavalheiro et al. 1996). Seventeen mice (12--16 weeks of age) received an intraperitoneal injection (i.p.) of methyl-scopolamine at a dose of 1 mg/kg body weight 30 min prior to injection of pilocarpine to reduce its peripheral cholinergic effects. Animals were then intraperitoneally injected with a single dose of either 100 or 200 mg/kg of pilocarpine in 0.2-mL sterile saline vehicle (0.9% NaCl). Animals were observed continuously and epileptic seizures and/or SE were recorded. Mice that developed a SE were deeply anesthetized with sodium pentobarbital (60 mg/kg body weight i.p.) and sub-sequently perfused with paraformaldehyde (4% in phosphate buffer 0.1 M, pH 7.4). Coronal sections were cut at 40-lm thickness and processed for Nissl staining.
Behavioral Experiments
A total of 92 mice were used, 23 HeCo and 35 control mice from P0 to P22, 5 HeCo and 5 control mice at the age of 2 months and finally 9 HeCo and 15 control mice aged more than 7 months. Behavior was analyzed in different situations in order to assess the early development of locomotor capacities and complementary aspects of potential cognitive deficits linked to the HeCo phenotype.
Two spatial tasks were adapted, the Morris navigation task and the 8-arm radial maze. In addition, one set-up was designed to assess locomotor activity (Grandchamp and Schenk 2006).
The early development of locomotion was assessed in 2 conditions. Contact righting was observed on a rough substrate of 25320 cm, limited on 3 sides by a 5 cm high wall. Negative geotaxis capacity was recorded on a rough substrate (25320 cm). Its surface was tilted 25° from the horizontal plane. The infant mouse was able to clutch the rough surface and was also prevented from passive slipping due to the enhanced friction.
The Y-maze was composed of 3 (636350 cm) transparent Plexiglas runways (named A, B, and C) linked together in a symmetrical Y shape (120° of angular deviation from each other). The olfactory automated radial maze was made of 8 transparent Plexiglas tunnels (636 x 50 cm) placed on a circular table covered by a plastic sheet. Three arms were baited with a drop of diluted condensed milk deposited on a glass plate at the end of the tunnels. The olfactory cues were bands of blotting paper (2350 cm) affixed to the arms’ ceiling. The cues were made by impregnating the blotting paper bands with 0.8 mL of solutions made with 8 different alimentary aromas (lemon, apricot, aniseed, orange, blackcurrant, apple, amend bitter, brandy). Guillotine doors closed the exit of each tunnel.
The Morris navigation task was performed using a circular pool (120 cm in diameter, 30 cm height) made of gray polyvinyl chloride that was situated in a dimly illuminated room. The pool was filled to a depth of 15 cm with water (27 °C) opacified with milk (0.5 L). Four orthogonal starting positions around the perimeter of the pool, divided its surface into 4 quadrants. A platform consisting of a transparent Plexiglas cylinder (15 cm tall and 8 cm diameter) and covered with a white aluminum perforated plate (14 cm diameter) was placed in the
center of the quadrants, approximately 0.5 cm under water level. The pool was located in a room containing numerous extra-maze cues.
Morphologic and motor developments were evaluated as follows. Body weight and hair growth was assessed daily. Time of eye opening was recorded for each mouse. The locomotor development included a description of locomotion strategies, the assessment of contact righting and negative geotaxis. Spontaneous locomotion was recorded daily during 2 min on a horizontal plan according to 5 items described by Altman and Sudarshan (1975), pivoting (the front legs push like paddles and the rear wheel-axle unit is practically motionless), punting (the head is posed over a leg, the leg is withdrawn and placed in the direction of the movement while the other leg pushes to help it), treading (the head is elevated, the movements of the front legs are not more constrained; at the same time, the posterior legs are more isolated and offer a better support), crawling (the belly rests by ground but the posterior legs become mobile) and walking (the belly does not touch any more by ground and there is a synchronization of the legs).
For the negative geotaxis test, the animal was deposited with the head oriented downwards, in the center of the tilted plan. The test lasted a maximum of 3 min and the position of the animal was recorded every 5 s with a precision of 15°, from the starting position (–90°), through the horizontal plan (0°) to the expected position with the head upwards (+90°). The test started at day 5 and was prolonged until the animal tried to escape from the apparatus.
To test general activity, mice were individually placed in the distal end of an arm of the Y-maze for 8 min free exploration. The starting position for each mouse was randomly A, B, or C runway. Two kinds of measures were recorded. First, the number of arm entries as an indication of general activity. Second, alternation behavior was assessed from the individual sequences of arm visits. The frequency of 3-arm alternations (ABC-type) was compared with the frequency of in-complete or null alternation patterns (ABA-, BAA-, or AAA-type). For the 20- and 22-day-old mice, a black cue was placed opposite the arm B.
Cognitive tasks were tested using the automated radial maze and the Morris water maze. Mice were trained over 9 consecutive daily sessions in an automated 8-arm radial maze to discriminate the 3 arms that were constantly baited with food and the 5 arms that were never baited. A first exploration session consisted of leaving each mouse during 10 min in the maze with free access to all the tunnels and with all arms baited with food to familiarize them with the maze and its environment. After that, the animals received 6 daily learning trials. Two different configurations of 3 baited arms were used, always the same for a given mouse throughout training. The baited and non baited arms were thus at fixed positions in space and could also be discriminated by a specific odor cue. An arm was baited or non baited depending on the test subject so that no particular arm could accumulate scent marks due to the presence or absence of reinforcement. Each subject was assigned a different set of 3 constantly baited arms (arms 1, 4, 6 or 2, 5, 7) with the sequence of angles between the baited arms being 135°--90°--135°. Mice were individually introduced into the central platform and each trial started by the opening of all 8 doors simultaneously. After each visit to an arm, the door giving access to that arm was automatically closed, preventing re-entries into an already visited arm. Each trial was terminated after the animal retrieved the third food pellet and had returned to the central platform; all 8 doors were closed simultaneously and the animal was left 1 min in the central platform. During the entire testing period, all the mice had restricted access to food and their weight was checked every day to prevent more than a 10% body weight loss. Discrimination performance was assessed by the mean of total errors for each trial (with a maximum of 5 errors) calculated for each day.
For the Morris water maze task, the mice received 4 daily learning trials during 5 days. The position of the hidden platform remained fixed for the entire period of the acquisition and each subject was assigned a different sector. Each trial started with the mice being placed into the water, at one of 4 starting points: N, E, S, W. Four different starting positions were pseudorandomly used in each training block. A trial ended when the mouse reached the hidden platform and it was allowed to remain there for 20 s. If a successful escape was not performed within 60 s, the mouse was guided to the platform and the trial was recorded as an escape failure. Between successive trials the test mouse
was left for a 30-s intertrial interval in a dry container. Each mouse was dried in the container with cellulose paper before being replaced in its home cage. At the end of the 20 training trials, each mouse received a probe trial. For this trial, the platform was removed from the pool and the mouse was allowed to swim for 60 s. Then the platform was replaced in the training location and the mouse was allowed to climb on it. For the learning and transfer stages, a variable was measured: the average number of errors across all days to find the platform (% errors). For the probe trials, we compared the time spent in the training half of the pool (containing the platform during training) with the opposite one.
For all the experiments, a video camera suspended directly above each apparatus was connected to a computer and used to record the mice behavior. Experiments took place during the light phase between 7:00 a.m. and 7:00 p.m.
Statistics
The statistical analysis was performed using the SAS package (SAS Institute Inc., Cary, NC) and StatView (version 4.5). Data were checked for the normality of distribution. Comparisons of means in 2 groups were made using the unpaired Student’s t-test. When comparison was based on the means of more than 2 groups we applied an analysis of variance (ANOVA). For the BrdU study, data related to the different stripes defined above were analyzed with the multivariate ANOVA using the generalized linear model procedure. For the behavioral experi-ments, ANOVAs were performed on the raw data with the genotype as the between-subjects and repeated measures such as day, session, area,
as within-subject factors. The ANOVAs were confirmed by unpaired t-test and other pair comparisons were performed by a post hoc test (Fisher post-hoc least significant difference, P <0.05), when necessary.
Parametric correlations (r) and Spearman rank correlation were computed. The limit of significance, if unspecified, was P<0.05 for all tests.
Results
HeCo Morphology
The HeCo phenotype is defined by the presence of a subcortical
band heterotopia, that is located bilaterally beneath the medial
part of the neocortex and extends from the frontal lobe to the
occipital lobe (see Fig. 1A,B). The HeCo is separated from the
overlying neocortex (HoCo) by a thin layer of white matter,
and from subcortical structures by a thicker layer of white
matter, resembling normal subcortical white matter. Even
though the medio-lateral as well as the rostro-caudal extension
of the cortical heterotopia varies between animals (for
comparison see Fig. 1A,B), its general appearance and location
is constant. Interestingly, notable differences in severity were
identified between animals of the same offspring and, to a lesser
extent, between hemispheres of the same animal. Underlying
subcortical structures, including the hippocampus, striatum
and thalamus as well as the cerebellum and brainstem have
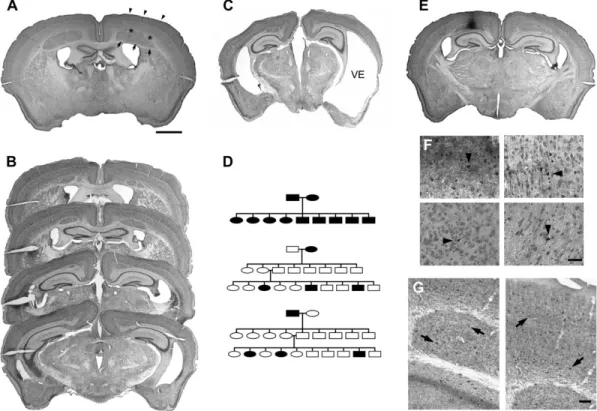
Figure 1. (A) Nissl-stained coronal section from a HeCo mouse. Arrows point to HeCo, asterisks to subcortical white matter and arrowheads to HoCo. (B) Photomicrograph of 4 consecutive Nissl-stained coronal sections of a HeCo mouse brain from rostral to caudal, showing the antero-posterior extension of the cortical heterotopia. (C) Photomicrograph of a coronal section of a HeCo mouse brain with severe lateral cortical atrophy and subsequent ventricular enlargement (VE). (D) Pedigree of different crossings between HeCo and control animals. Crossings between 2 affected mice (15 breeding pairs) revealed a 100% positive HeCo phenotype in offspring (n 5 110). Results of the crossing of a HeCo female (black oval) with a C57/BL6 unaffected male (open square) and F2 generation from this offspring, with subsequently the reverse crossing with a HeCo male (black square) with a C57/BL6 unaffected female (open oval). Note that in either of these cases none of the F1 offspring had the HeCo phenotype, excluding a dominant or sex-linked trait. The frequency of affected mice in the F2 generation of the 2 crossings (60/247 and 10/47, respectively) indicates that the HeCo phenotype is due to an autosomal recessive disorder of a single locus. (E and F) Results of BDA-tracing in a HeCo mouse. (E) Photomicrograph at low power of a coronal section counterstained for Nissl-substance. Note the injection site located in the HeCo in the right hemisphere. (F) Photomicrographs at higher magnification showing cell labeling (black arrowheads) in the ipsilateral HeCo (upper left), the ipsilateral HoCo (upper right), the contralateral HeCo (lower left) and the ipsilateral thalamus (lower right). (G) Results of immunochemistry for PARV in an experimental mouse. Photomicrographs at high magnification showing the ipsilateral HeCo (left) and the ipsilateral HoCo (right). Black arrows indicate PARVþ cells. Scale bars: (A--D) 1000 lm, (E) 50 lm, (F) 100 lm.
a normal microscopic appearance but a discrete ventricular
enlargement is observed as compared with mice of the NOR
strain that do not display the HeCo phenotype. In a small
number of animals, a more severe malformation was present
with a lateral cortical atrophy and huge ventricular
enlarge-ment (see Fig. 1C). During general animal inspection, HeCo and
control mice are hard to distinguish, except for these more
severe cases where mice are small and have a low body weight
with sometimes a cranial malformation and brady- and
hypo-kinesia. Other organs, including the heart, liver, pancreas, spleen
and kidney have a normal microscopic appearance and no
differences were found in the serum levels of electrolytes (Na
+,
K
+, Cl
–), creatinin, glucose and cholesterol between HeCo and
control age and sex matched mice (results not shown).
Cross-Breeding Experiments
In these experiments the phenotype was determined in
histological sections through the forebrain taken after the
adult mouse had given off-spring. Crossings between 2 affected
mice (15 breeding pairs) revealed a 100% positive HeCo
phenotype in offspring (n
=110). Crossings between affected
HeCo mice and unaffected C57/Bl6 mice (10 breeding pairs)
revealed no HeCo-phenotypes in the offspring (n
=78 for all
crossings, n
=56 for crossings between C57/Bl6 male and
HeCo female, n
=22 for crossings between HeCo male and
C57/Bl6 female). These results exclude a dominant or
sex-linked trait. F2 generations from these crossings between HeCo
and C57/Bl6 mice demonstrated that 70 out of 294 mice (24%)
were affected which exclude a multiloci origin and
demon-strate the autosomal recessive nature of the HeCo phenotype
(see Fig. 1D).
Tracing Experiments
After BDA injections in the HeCo of the right hemisphere,
retrogradely labeled cells were found in the HoCo, in the
contralateral HeCo and HoCo and in the ipsilateral thalamus
(see Fig. 1E,F). Afferent connections to the HeCo are therefore
comparable to connections of the HoCo.
PARV Immunostaining
PARV
+
cells were found in the HoCo, in the hippocampus, in
subcortical structures as well as in the HeCo, demonstrating
the presence of GABA cells in the cortical heterotopia (see
Fig. 1G). Density (60, 63, 65 [cells/mm
2]) and distribution,
defined by the mean distance to the closest positive cell
(65, 64, 65 [lm]) of PARV
+
cells were not significantly different
in the HeCo, HoCo, and the adjacent cortex (AdCo),
re-spectively. It has to be noted that this analysis does not take
into account the absence of layering in the HeCo and the
layer-dependent density differences in the HoCo and AdCo.
Morphometric Analysis
The thickness of the HoCo is slightly smaller in the HeCo
mouse compared with cortical thickness in the control
(Fig. 2A), but this difference did not reach significance.
However, the HeCo together with the HoCo gives a total
cortical thickness that is larger in HeCo than in control mice
(Mann--Whitney test, P
<0.0001). To determine if all layers of
the HoCo are equally affected, we compared individual layer
thickness with its corresponding cortical layer in control mice.
Figure 2B displays the results of this analysis showing that the
only significantly affected layer is layer II/III (Mann--Whitney
test, P
=0.0003). We completed this morphometric
investiga-tion of the various cortical layers by determining the cell
density in each layers (Fig. 2C). Analysis revealed that the cell
density in layer II/III of the HeCo was significantly lower than
in controls (Mann--Whitney test, P
=0.0275). Finally, we made
a comparison of cell size between the heterotopia and layer II/
III and observed that there was no significant difference in cell
size between both regions (Fig. 2D).
Cell Markers
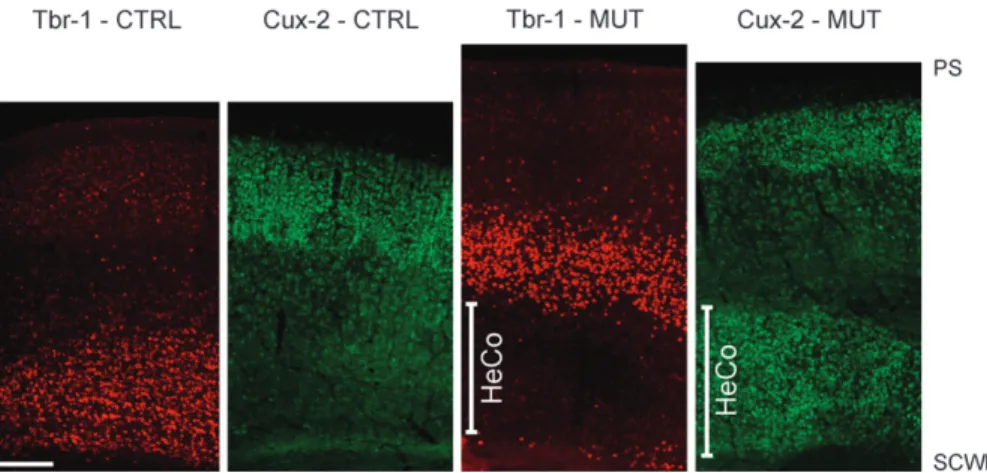
Immunolabeling by anti-Cux-2 (a marker of supragranular and
granular layers) and anti-Tbr-1 (a marker of infragranular
layers) antibodies are shown in Figure 3. The Tbr-1 antibody
strongly labels cells in the deep cortical layers of both the
normal cortex of control mice and the HoCo of mutant mice,
with no cell labeling within the HeCo. Intense cell labeling by
anti-Cux-2 antibodies was noted in superficial cortical layers in
both the normal cortex of control mice and the HoCo of
mutant mice, but this antibody also labeled virtually all the cells
that form the HeCo.
Analysis of the Birth Dates of Cells in Heco, HoCo, and
AdCo
At P13, BrdU-positive cells were present in infragranular,
granular and supragranular layers of the HoCo and AdCo when
the BrdU injection took place at E13, E15, and E18, respectively
(see Fig. 4A). We found very few BrdU-positive cells in the
HeCo after injection at E13 and E15. However, BrdU injection
at E18 revealed a large number of positive cells in the HeCo
(see Fig. 4A).
The quantitative analysis of the number of BrdU-positive
cells in the HeCo demonstrated that this number was
signif-icantly different between embryonic ages of injection
(multivar-iate ANOVA [MANOVA], P
<0.0001). Univariate comparisons
revealed that the number of positive cells in the HeCo was
higher for the E18 injection group than for E13 and E15
injection groups. No statistical differences were found between
the 10 analyzed stripes in the HeCo (see Fig. 4B).
Analyzing data from the HoCo and AdCo revealed that HeCo
formation disrupts the formation of the overlying cerebral
cortex. MANOVA indicated that the number of BrdU-positive
cells in the HoCo was significantly different between HeCo and
control mice with an important drop in the number of labeled
cells in the superficial stripes in HeCo mice (P
<0.05, see
Fig. 4C). The same analysis in the AdCo also showed a less
pronounced but significant drop in the number of labeled cells
in the superficial stripes (see Fig. 4D).
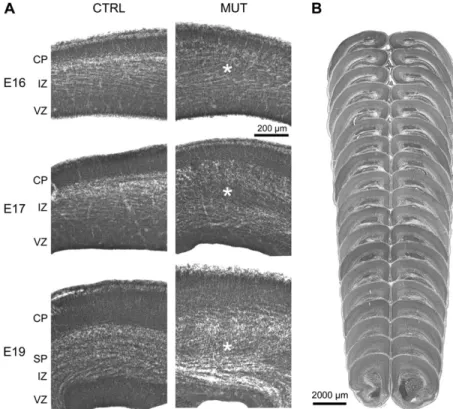
Development of the Cerebral Cortex and Heterotopia
Histology of coronal sections at E16, 17, and 19 revealed an
increase in the IZ thickness in HeCo mice compared with
control animals, with a high cell density area beneath the
subplate, and therefore within the IZ (see Fig. 5A). At P0, the
size and extent of the cortical heterotopia was very similar to
that observed in adult animals (see Fig. 5B). Results of
immunochemistry for Tbr-1 at E17 and E19 confirmed this
increase of the IZ and demonstrated a wider distribution of
positive cells within this zone (see Fig. 6A) in HeCo mice. BrdU
immunochemistry also revealed a wider distribution of positive
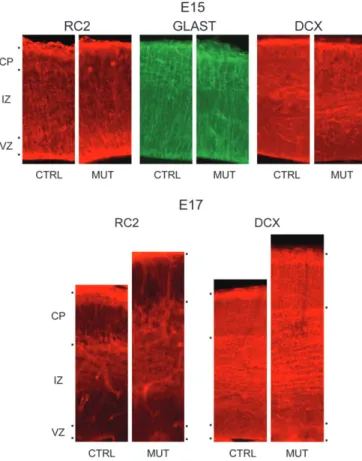
cells within the IZ in HeCo animals (see Fig. 6B). Finally,
immunochemistry for RC2 and GLAST (here used as marker for
the radial glia) and Dcx showed no obvious differences
between control and HeCo mice at E15 and confirmed the
increase in IZ thickness in HeCo mice at E17 (see Fig. 7).
Spontaneous Seizures
At 8--12 weeks of age, no epileptic seizures were observed
during the 24-h video recording period (n
=24). In younger
animals (4--5 weeks of age), spontaneous myoclonic jerks
associated with interruption in exploratory behavior were
observed in all of the 23 HeCo animals, but never in control age
matched animals (n
=35). In 3 out of the 23 HeCo animals
spontaneous seizures similar to pilocarpine induced seizures
(see below) occurred after behavioral experiments. This never
occurred in age matched controls (n
=35).
Pilocarpine Induced SE
Compared with wild-type animals, the HeCo mice showed
a significant increase in tendency to develop epileptic seizures
in the pilocarpine-induced model of epilepsy. In this model,
a SE is obtained at a dose of 300--350 mg/kg body weight
(Cavalheiro et al. 1996). When injected with a dose of 100 mg/kg
body weight, none of the 4 mutants tested developed a SE. On
the other hand, all the 9 HeCo mice developed a SE when
injected with the dose of 200 mg/kg body weight, whereas
none of the 4 control mice did with the same dose.
Behavioral Experiments
The results of the tests for somatic growth and sensorimotor
activity are presented in Figures 8 and 9. The mice of the 2
genotypes do not differ in growth rate (see Fig. 8A). Despite
their apparently normal growth rate, the HeCo showed
a significant delay in hair growth (see Fig. 8B) and eye opening
(see Fig. 8C). Separate one-way ANOVAs revealed significant
effects of genotype on hair growth (F
1,34=25.850, P
<0.0001)
and eye opening (F
1,34=7.855, P
=0.0083).
The slower development of locomotion in some of the HeCo
mice is illustrated in Figures 8D and 9. In fact, all of the control
mice (n
=35) displayed a normal locomotion pattern at the age
of 10 days, whereas only 14 of 23 HeCo mice reached the same
criterion. This was related to a one-day delay in the
de-velopment of efficient righting response and to a more marked
delay in geotaxis reflexes (see Fig. 8E,F). The behavior in
sensorimotor tests was significantly correlated with the
de-velopment of walking. Individual results for the righting test
(see Fig. 9) were correlated with the onset of walking (r
=0.669, P
<0.0001) and the response in negative geotaxis tested
at 9 days (r
=0.278, P
=0.0343). These analyses were confirmed
by Spearman rank correlations.
General activity assessed by the Y-Maze was significantly
different between control and HeCo mice, but this difference
Figure 2. Results of the morphometric analysis. (A) Mean thickness (±SD) of the normal cortex in control animals (HoCo—CTRL, n 5 16), and the HoCo (HoCo—MUT) and the radial extent of the heterotopia (HeCo—MUT) in mutant mice (n 5 16). A slight, non significant, decrease in HoCo thickness was observed in mutant mice. (B) Comparison of the mean layer thickness within the HoCo of both the control (CTRL, n 5 16) and mutant (MUT, n 5 16) mice. Note that a significant decrease in layer thickness was only observed for layers II--III. (C) Comparison of the mean cell density (±SD) within layers II--III of the HoCo of both the control and HeCo mice. A significant decrease in cell density was observed in mutant animals. (D) Comparison of cell size (here represented by cell area) between the heterotopia (HeCo) and layers II--III of the HoCo of mutant animals; no significant differences were detected.Figure 4. Results of immunochemistry for BrdU injected at embryonic day 13 (E13) 15 (E15) and 18 (E18) in both control (CTRL) and mutant (MUT) mice. (A) Photomicrographs at low magnification showing after injection at E13 labeling in lower layers in both control mice and HoCo of mutant mice with almost no labeling in HeCo; after injection at E15, labeling in intermediate layers in both control mice and HoCo of mutant mice with again almost no labeling in HeCo; and, after injection at E18, labeling in upper layers in both control mice and HoCo of mutant mice, together with intense labeling in the HeCo. (B--D) Line graphs of BrdU analysis. (B) Comparison of the number of labeled cells in HeCo between animals of the 3 injection time groups, embryonic age 13 (E13), 15 (E15), and 18 (E18) and determined at P13. Note the relatively low number of cells at E13 and E15 and the important number of labeled cells when the injection took place at E18. (C) Comparison of the number of labeled cells in the HoCo in mutant (MUT) and control (CTRL) mice when the injection was performed at E18 with determination at P13. Note the important drop in labeled cells in the superficial part in the HoCo of mutant mice. (D) Comparison of the number of labeled cells in AdCo in mutant mice and control animals when the injection was performed at E18 with determination at P13. Note the significant drop in labeled cells in the superficial stripes in mutant mice.
Figure 3. Results of immunohistochemistry for Tbr-1 and Cux-2 at P6. Note the strong cell labeling of deep cortical layers by anti-Tbr-1 antibody in both the normal cortex of the control (CTRL) mouse and the HoCo of the mutant (MUT) mouse, with almost no cell labeling of the HeCo. Intense cell labeling by anti-Cux-2 antibody is observed in superficial cortical layers in both the normal cortex of the control mouse and the HoCo of the HeCo mouse but also in the HeCo. Scale bar represents 200 lm. SCWM: Subcortical white matter, PS: pial surface.
was only observed at the age of 2 months (see Fig. A in
Supplemental Data). This was confirmed by a 2-way ANOVA (4
ages
32 genotypes) revealing a significant effect of age (F
3,28=68.017, P
<0.0001) but not of genotype, and a significant
interaction between age and genotype (F
3,84 =8.674, P
<0.0001). Unpaired T-tests revealed a significant effect of
genotype at 2 months only (P
=0.0191). The frequency of
complete alternations (e.g., ABC pattern vs. ABA, BAA, or AAA)
was lower in the HeCo than in control mice at 20 days only
(see Fig. A in supplemental data). This was confirmed by a
2-way ANOVA (4 ages
32 genotypes) revealing a significant
effect of age (F
3,28=6.342, P
=0.0006) but not of genotype, and
a significant interaction between age and genotype (F
3,84 =2.913, P
=0.0391). Unpaired T-tests revealed a significant
effect of genotype at 20 days only (P
=0.0044). Arm selection
analyzed on the combined 20- and 22-day-old mice with the
2-way ANOVA (3 arms, 2 genotypes) revealed a significant arm
effect (F
2,56=11.945, P
<0.0001), no effect of genotype nor of
interaction between these 2 factors (see Fig. A in Supplemental
Data). It was interesting to note that the mice preferred on the
one hand the arm near the cue, as well as the starting arm, in
comparison with the supposed neutral third arm. In addition,
an unpaired T-test carried out on the cued arm revealed that
the preference for this arm was significantly higher in the HeCo
than in the control mice at P20 (P
=0.0210).
Figure B of the supplemental data illustrates the
perfor-mance during task acquisition in the automated radial maze
based on the number of visits in non baited arms (reference
errors) until the mice had visited the 3 baited arms. The 2-way
repeated measure ANOVA (genotype
33-trials blocks)
con-ducted on the 2-month-old group revealed a significant effect
of the repetition (F
2,25 =20.375, P
<0.0001) and genotype
(F
1,25 =4.285, P
=0.0489) indicating better performance in
controls but no interaction between genotype and repetition.
The same analysis conducted in the groups aged above
7 months revealed also a significant effect of repetition (F
2,67=96.783, P
<0.0001) and genotype (F
1,67 =7.655, P
=0.0073)
without interaction but in this case results of control mice
were worse.
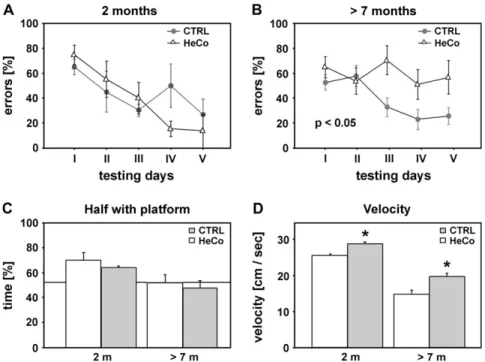
During the Morris water maze task, the acquisition of spatial
learning was assessed from the average number of errors
(failures) in reaching the platform (see Fig. 10A,B). Separate
2-way repeated measure ANOVAs (genotype
3days) were
conducted as an indication of task acquisition in each age
groups. There was a significant effect of genotype in the
7-month-old group (F
4,22=5.967, P
=0.0231), but not in the
2-month-old group. Indeed, the HeCo mice aged above 7 months
were significantly impaired. A 2-way repeated measure ANOVA
(age
3days) revealed a significant effect of age (F
1,12 =6.155,
P
=0.0289) in the HeCo mice but not in the control group.
For the Probe trial, a 2-way measure ANOVA (genotype
3age) on the bias toward the training position (i.e., % time in
the reinforced half of the pool) during the probe trial did not
reveal a significant effect (see Fig. 10C). However, a 2-way
measure ANOVA (genotype
3age) on the velocity during the
probe trial (see Fig. 10D) revealed a significant effect of
genotype (F
1,18=19.776, P
=0.0003) and of age (F
1,18=34.996,
P
<0.0001).
In summary, when compared with controls, HeCo mice do
not differ in overall growth rate, but show a significant delay in
Figure 5. (A) Photomicrographs of coronal Nissl-stained sections through the developing cerebral cortex of control (CTRL) and mutant (MUT) mice at embryonic age 16 (E16), 17 (E17), and 19 (E19). Note the increase in IZ thickness in HeCo mice at all ages with normal thickness of the VZ and the cortical plate (CP) as compared with the control animals. Asterisks highlight a condensation of cell bodies within the IZ in HeCo mice, which is already present at E16. (B) Photomicrographs of consecutive coronal sections through the forebrain of a new born HeCo mouse. Note the presence of the cortical heterotopia throughout the antero-posterior axis, which is very similar to the observed heterotopia distribution in adults.hair growth and eye opening, a slower development of
loco-motion and a decrease in general activity as assessed by the
Y-Maze task. They have a significantly lower performance
during task acquisition in the automated radial maze and make
significantly more errors in reaching the platform during the
Morris water maze task at the age of 7 months.
Discussion
Human neuronal migration disorders are not uncommon
pathologies, especially among epileptic patients (Meencke
and Veith 1992; Guerrini 2005). Despite the discovery of the
doublecortin gene, associated with the majority of cases of
subcortical band heterotopia in humans (des Portes et al. 1998)
and our current understanding of the mechanisms leading to
cortical heterotopias (Clark 2004; Gressens 2006), a complete
appreciation of the molecular and cellular events that underlie
their pathogenesis is still needed. Different molecular pathways
have been determined as important for neuronal migration,
some involving the migrating neuron, others being necessary
for correct interactions with glia and/or other neurons. Several
molecules of the cytoskeleton, or their associated proteins,
have been shown to be involved in the migration of cortical
neurons (Gressens 2006). In humans, filamin-A, an
actin-binding protein, is mutated in periventricular nodular
hetero-topia, Dcx, a microtubule-associated protein, is mutated in
diffuse subcortical band heterotopia (double cortex) and
lissencephaly, and Lis1, a microtubule-associated protein and
dynein regulator, is mutated in isolated type 1 lissencephaly
and Miller--Dieker syndrome (Gressens 2006). On the other
hand, molecules of the reelin pathway, a glycoprotein mutated
in lissencephaly associated with cerebellar hypoplasia in
humans and in the reeler mouse mutant, are involved in
cortical lamination (Gressens 2006). The molecules mentioned
above are currently thought to be responsible for only a small
percentage of the genetic disorders leading to the altered
migration of cortical neurons in humans (Browne and Holmes
2001). To further develop the understanding of these neuronal
migration disorders a larger number of animal models are
therefore needed. Dcx null mutations in mice neither disrupt
isocortical neuronal migration nor cause subcortical band
heterotopia formation. In utero RNA interference of Dcx in
Figure 6. (A) Photomicrographs of coronal sections processed for Tbr-1 immunochemistry through the developing cerebral cortex of control (CTRL) and mutant (MUT) mice at embryonic age 15 (E15), 17 (E17), and 19 (E19). Note the thickness increase of the developing cortex in HeCo animals from E17, the cortical plate being more superficial. This was mainly due to an increase in thickness of the IZ. Note also the more diffuse distribution of Tbr-1 positive cells in HeCo animals at E17 and E19, some of them straggling within the IZ. (B) Photomicrographs of coronal sections processed for BrdU immunochemistry through the developing cerebral cortex of control (CTRL) and mutant (MUT) mice at embryonic age 15 (E15, BrdU injection at E14), 16 (E16, BrdU injection at E15), and 17 (E17, BrdU injection at E16). These images also show the increased thickness of the IZ and the corresponding larger extent of BrdU-positive cells within the IZ in HeCo animals at E16 and E17.rats (but not in mice), in contrast, creates an animal model of
subcortical band heterotopia (Corbo et al. 2002; Bai et al. 2003;
Ramos et al. 2006). Other animal models of cortical
malforma-tions are the reeler mouse, the Lis1 knockout mouse and the
spontaneous tish (telencephalic internal structural heterotopia)
mutant rat (for review see Ross 2002). The tish rat is
a spontaneous mutant that appeared in a colony of
Sprague--Dawley rats (Lee et al. 1997). The transmission mode is
autosomal recessive. Some of the affected animals present both
electrographical and clinical seizures. In this mutant it was
shown that the heterotopic neurons have connections with both
the overlying cortex and deep structures such as the thalamic
nuclei (Schottler et al. 1998), as in our model. It was proposed
that, in the tish model, the abnormal band of gray matter is
generated by an ‘‘extra’’ germinal zone (Lee et al. 1998) during
preplate formation (E15). Therefore, the pathogenesis of the tish
mutant occurs early during cortical development. Furthermore,
the number of PARV
+
neurons is decreased in tish rat normotopic
and HeCo as compared with control animals and the PARV
+
neurons within the HeCo are distributed in patches rather than
in distinct layers as in control cortex (Trotter et al. 2006).
In our model however, the cells forming the heterotopia in
the adult seem to be born mainly late in development. At P13,
a moment where cortical layering is well established, the
heterotopia is populated by neurons born at E18, an age that is
well beyond the formation of the cortical plate and when the
formation of the infragranular layers is already well underway.
Furthermore, the results of the morphometric analysis
con-cerning layer thickness, and cell density and size show that the
superficial layers of the HoCo, normally populated by neurons
born at E17-E18, displayed a decreased thickness and cell
density compared with control animals. We also demonstrate
that some of the neurons which have their final destination in
the infragranular layers and which are born between E13 and
E15 display an abnormal migration pattern because a condensed
cell layer is already observed in the IZ at E16. However, at P13
these neurons have reached their correct position in the HoCo.
The presence of PARV
+
neurons within the HeCo together
with the abnormal development of supragranular layers within
the HoCo and AdCo further suggest that both projection and
Figure 7. Photomicrographs of coronal sections processed for RC2, GLAST, and Dcximmunochemistry through the developing cerebral cortex of control (CTRL) and mutant (MUT) mice at embryonic age 15 (E15) and 17 (E17). Note again the increase in IZ thickness at E17 and the relatively similar pattern of labeling in both HeCo and control mice.
interneuron migratory pathways in the forebrain are affected
by the mutation.
The detailed comparison between the tish rat and HeCo
indicates that cortical band heterotopia in these 2 animal models
could be due to different molecular mechanisms. Therefore, the
shared morphological and physiological features of the HeCo
mouse and the tish rat do not imply necessarily that the mutated
gene is identical in both models. To our knowledge the gene
responsible for the cortical malformation in tish rat has not yet
been identified. We are currently localizing the gene mutation in
the HeCo genome using polymorphic marker analyses as part of
an ongoing collaboration with the Institut Cochin, France and
the French Centre National de Ge´notypage.
Recently, LoTurco and Bai (2006) hypothesized that the
perturbation of early phases of cortical development (e.g., after
loss of filamin-A function), creates nodular periventricular
heterotopia because cells remain in the so-called multipolar
stage and are unable to polarize and make radial progress
through the IZ. By contrast, they hypothesized that failure or
delay of the transition out of the multipolar stage, for instance
in the case of Dcx or LIS1 mutations, could cause formation of
subcortical band heterotopia. The HeCo phenotype seems to be
comparable with this second type of subcortical band formation
as was shown notably by the birth date analyses and the increase
in IZ thickness visualized using the anti-Tbr-1 antibody.
In-terestingly, when we observe the first signs of HeCo formation,
markers of radial glia (RC2 and GLAST), as well as Dcx, display
a pattern that is roughly similar to that in control mice.
The tendency to develop epilepsy in the tish rat was linked
to a disturbance of inhibitory GABAergic neurotransmission
before seizure onset, characterized by an altered GABAergic
neuron distribution in both heterotopic and normotopic
cortex, and a significant reduction in the frequency and
amplitude of spontaneous inhibitory postsynaptic currents
(sIPSCs) and miniature inhibitory postsynaptic currents (IPSC)
recorded from pyramidal neurons (Trotter et al. 2006).
Interestingly, the amplitudes of sIPSCs in normotopic cortex
were also reduced. In human patients suffering from
periven-tricular nodular heterotopia, interictal spiking activity was
found in ectopic gray matter but also in the cortex overlying
the nodules and in the mesial temporal structures. The
heterotopia was involved in seizure onset in the majority of
patients, but some patients had seizures originating in mesial
temporal structures only (Aghakhani et al. 2005). We
demon-strate here that the density of PARV
+
neurons in the HeCo is of
the same magnitude as in the overlying HoCo, and as in control
cortex. We realize that the density of PARV
+
neurons is just
one parameter characterizing the GABAergic system, roughly
representing 50% of the normal number of GABAergic neurons
in cerebral cortex. In addition to such a number, more
infor-mation is needed on the synaptology of GABAergic innervation
of the HeCo, as well as the mode of transmission within this
part of the nervous system before a possible link could be
proposed on the origin of the lowered threshold for
epilepto-genesis in the HeCo mouse.
The results of the behavioral experiments indicate a
signif-icantly delayed somatic maturation (eye opening and fur
growing) in the HeCo mice. This was accompanied by delays
in the maturation of locomotor abilities, particularly in the
geotaxis response. No genotype effect was evident in the
expression of spontaneous alternation in juvenile subjects, but
HeCo mice expressed a more marked preference for the cued
arm at the age of 20 days, suggesting a marked tendency in cue
guidance (see Wiener and Schenk 2005). In the adult subjects
the cognitive performance was nearly normal in HeCo mice at
the age of 2 months. In the radial maze in particular, it is
possible that a cue guidance might have facilitated an optimal
performance because the task design required only reference
memory capacities. This suggests that HeCo mice were
depen-dent on olfactory or visuo-spatial cues for spatial performance.
Thus, HeCo mice appeared more adaptive, selecting the
spe-cific cues in comparison with control mice. During the Morris
water maze task, no effect of genotype in the 2-month-old
group was observed, indicating relatively preserved memory
abilities in young animals. This conclusion is in accordance
with the results of the neuropsychological assessment reported
in children with subcortical band heterotopia due to a mutation
Figure 9. Development of movement. Note that the development of the walk isdelayed in HeCo mice and the correlation between the righting test and the apparition of walking. The gray stripe in the middle graph highlights the delay in the development of walking between control and HeCo mice. For details, see text.
in Dcx, which demonstrated intellectual impairment and
deficits in all cognitive domains (processing speed, attention,
language, visuomotor skills and fine motor ability) except
ver-bal and visual episodic memory (Hashimoto et al. 1993; Jacobs
et al. 2001; D’Agostino et al. 2002; Janzen et al. 2004).
We present here a new and unique mouse model of cortical
heterotopia. This model shares with its human counterpart the
morphology of the HeCo which lies inside the subcortical
white matter, a certain degree of ventricular enlargement, the
presence of GABA cells inside the HeCo (Hammers et al. 2001),
and a tendency to develop epileptic seizures and SE (Meencke
and Veith 1992). It represents therefore a true animal model of
cortical heterotopia. The difference in transmission mode
(X-linked for human ‘‘double cortex,’’ autosomal recessive for the
HeCo mouse), suggests that the gene involved here is part of
a new, as yet uncharacterized pathway, and cloning this gene
will undoubtedly contribute to our understanding of cerebral
cortex development.
Furthermore, the presence of spontaneous epileptic
seiz-ures, at least in the younger animals, makes this model a useful
tool to study spontaneous chronic epilepsy in the mouse and to
examine the relationship between structural abnormalities and
epileptogenesis as well as structural modifications after
epilep-tic seizures. It is also likely to provide a new tool to test and
develop antiepileptic therapies.
Supplementary Material
Supplementary material can be found at: http://www.cercor. oxfordjournals.org/
Funding
Swiss National Science Foundation (310000 -- 108246 Egbert
Welker); and a ‘‘2007 Young Investigator Grant’’ from the
Faculty of Biology and Medicine, University of Lausanne,
Switzerland (Alexandre Croquelois).
Notes
We thank Dr Fiona Francis for her review of this paper and her valuable comments, Caroline Musetti and David Rodriguez for help with the histological processing, Thi Dung Hau Iuliano-Dao for mice inbreeding, Jean-Pierre Hornung for help with the immunochemistry procedure and Alain Croquelois for help with BrdU and PARV analysis.
Conflict of Interest: None declared.
Address correspondence to Alexandre Croquelois, MD, Service de Neuropsychologie et de Neurore´habilitation, Unite´ Universitaire de Neurore´habilitation, Centre Hospitalier Universitaire Vaudois (CHUV), Avenue Pierre Decker 5, CH-1011 Lausanne, Switzerland. Email: [email protected].
References
Aghakhani Y, Kinay D, Gotman J, Soualmi L, Andermann F, Olivier A, Dubeau F. 2005. The role of periventricular nodular heterotopia in epileptogenesis. Brain. 128:641--651.
Altman J, Sudarshan K. 1975. Postnatal development of locomotion in the laboratory rat. Anim Behav. 23:896--920.
Bai J, Ramos RL, Ackman JB, Thomas AM, Lee RV, LoTurco JJ. 2003. RNAi reveals doublecortin is required for radial migration in rat neocortex. Nat Neurosci. 6:1277--1283.
Browne TR, Holmes GL. 2001. Epilepsy. N Engl J Med. 344:1145--1151. Cavalheiro EA, Santos NF, Priel MR. 1996. The pilocarpine model of
epilepsy in mice. Epilepsia. 37:1015--1019.
Clark GD. 2004. The classification of cortical dysplasias through molecular genetics. Brain Dev. 26:351--362.
Corbo JC, Deuel TA, Long JM, LaPorte P, Tsai E, Wynshaw-Boris A, Walsh CA. 2002. Doublecortin is required in mice for lamination of the hippocampus but not the neocortex. J Neurosci. 22:7548--7557. Croquelois A, Bronchti G, Welker E. 2005. Cortical origin of functional recovery in the somatosensory cortex of the adult mouse after thalamic lesion. Eur J Neurosci. 21:1798--1806.
D’Agostino MD, Bernasconi A, Das S, Bastos A, Valerio RM, Palmini A, Costa da CJ, Scheffer IE, Berkovic S, Guerrini R, et al. 2002. Figure 10. Morris water maze task. (A and B) Average number of errors during acquisition. (C and D) Probe trial on day 5. (C) Mean (±SE) time spent in the half containing the platform. At 2 months all animals showed a significant bias toward the quadrant containing the platform. (D) Speed during a 60-s exploration. HeCo mice were significantly slower than control mice. Asterisks highlight statistical significance.
Subcortical band heterotopia (SBH) in males: clinical, imaging and genetic findings in comparison with females. Brain. 125:2507--2522. des Portes V, Pinard JM, Billuart P, Vinet MC, Koulakoff A, Carrie A, Gelot A, Dupuis E, Motte J, Berwald-Netter Y, et al. 1998. A novel CNS gene required for neuronal migration and involved in X-linked subcortical laminar heterotopia and lissencephaly syndrome. Cell. 92:51--61.
Dobyns WB, Truwit CL. 1995. Lissencephaly and other malformations of cortical development: 1995 update. Neuropediatrics. 26:132--147. Eriksson SH, Malmgren K, Nordborg C. 2005. Microdysgenesis in
epilepsy. Acta Neurol Scand. 111:279--290.
Farrell MA, DeRosa MJ, Curran JG, Secor DL, Cornford ME, Comair YG, Peacock WJ, Shields WD, Vinters HV. 1992. Neuropathologic findings in cortical resections (including hemispherectomies) performed for the treatment of intractable childhood epilepsy. Acta Neuropathol. 83:246--259.
Grandchamp N, Schenk F. 2006. Adaptive changes in a radial maze task: efficient selection of baited arms with reduced foraging in senescent hooded rats. Behav Brain Res. 168:161--166.
Gressens P. 2000. Mechanisms and disturbances of neuronal migration. Pediatr Res. 48:725--730.
Gressens P. 2006. Pathogenesis of migration disorders. Curr Opin Neurol. 19:135--140.
Guerrini R. 2005. Genetic malformations of the cerebral cortex and epilepsy. Epilepsia. 46(Suppl 1):32--37.
Hammers A, Koepp MJ, Richardson MP, Labbe C, Brooks DJ, Cunningham VJ, Duncan JS. 2001. Central benzodiazepine receptors in malformations of cortical development: a quantitative study. Brain. 124:1555--1565.
Hashimoto R, Seki T, Takuma Y, Suzuki N. 1993. The ‘double cortex’ syndrome on MRI. Brain Dev. 15:57--59.
Honda T, Tabata H, Nakajima K. 2003. Cellular and molecular mechanisms of neuronal migration in neocortical development. Semin Cell Dev Biol. 14:169--174.
Jacobs R, Anderson V, Harvey AS. 2001. Neuropsychological profile of a 9-year-old child with subcortical band heterotopia or ‘double cortex’. Dev Med Child Neurol. 43:628--633.
Janzen L, Sherman E, Langfitt J, Berg M, Connolly M. 2004. Preserved episodic memory in subcortical band heterotopia. Epilepsia. 45:555--558. Lee KS, Collins JL, Anzivino MJ, Frankel EA, Schottler F. 1998. Heterotopic
neurogenesis in a rat with cortical heterotopia. J Neurosci. 18: 9365--9375.
Lee KS, Schottler F, Collins JL, Lanzino G, Couture D, Rao A, Hiramatsu K, Goto Y, Hong SC, Caner H, et al. 1997. A genetic animal model of human neocortical heterotopia associated with seizures. J Neurosci. 17:6236--6242.
LoTurco JJ, Bai J. 2006. The multipolar stage and disruptions in neuronal migration. Trends Neurosci. 29:407--413.
Meencke HJ, Veith G. 1992. Migration disturbances in epilepsy. Epilepsy Res Suppl. 9:31--39.
Meencke HJ, Veith G. 1999. The relevance of slight migrational disturbances (microdysgenesis) to the etiology of the epilepsies. Adv Neurol. 79:123--131.
Rakic P. 1988. Defects of neuronal migration and the pathogenesis of cortical malformations. Prog Brain Res. 73:15--37.
Rakic P. 2003. Elusive radial glial cells: historical and evolutionary perspective. Glia. 43:19--32.
Ramos RL, Bai J, LoTurco JJ. 2006. Heterotopia formation in rat but not mouse neocortex after RNA interference knockdown of DCX. Cereb Cortex. 16:1323--1331.
Ross ME. 2002. Brain malformations, epilepsy, and infantile spasms. Int Rev Neurobiol. 49:333--352.
Schottler F, Couture D, Rao A, Kahn H, Lee KS. 1998. Subcortical connections of normotopic and heterotopic neurons in sensory and motor cortices of the tish mutant rat. J Comp Neurol. 395:29--42. Takahashi T, Nowakowski RS, Caviness VS, Jr. 1992. BUdR as an S-phase
marker for quantitative studies of cytokinetic behaviour in the murine cerebral ventricular zone. J Neurocytol. 21:185--197. Trotter SA, Kapur J, Anzivino MJ, Lee KS. 2006. GABAergic synaptic
inhibition is reduced before seizure onset in a genetic model of cortical malformation. J Neurosci. 26:10756--10767.
Van der Loos H, Welker E, Dorfl J, Rumo G. 1986. Selective breeding for variations in patterns of mystacial vibrissae of mice. Bilaterally symmetrical strains derived from ICR stock. J Hered. 77:66--82. Veenman CL, Reiner A, Honig MG. 1992. Biotinylated dextran amine as
an anterograde tracer for single- and double-labeling studies. J Neurosci Methods. 41:239--254.
Wiener SI, Schenk F. 2005. Behavioral studies of directional orientation in developing and adult animals. In: Taube JS, Wiener SI, editors. Head direction cells and the neural mechanisms underlying directional orientation. Cambridge: Massachusetts Institute of Technology Press. p. 247--274.
Wonders C, Anderson SA. 2005. Cortical interneurons and their origins. Neuroscientist. 11:199--205.