Université Hadj Lakhdar-Batna
Institut d'Hygiène et Sécurité Industrielle Laboratoire de Recherche en Prévention Industrielle
THESE
En vue de l’obtention du grade de
DOCTEUR
En Hygiène et Sécurité Industrielle
Option: Management des Risques Industriels et Environnementaux
Par
CHEBILA Mourad
Modélisation et Evaluation des Performances des
Systèmes Instrumentés de Sécurité avec Prise en
Compte des Incertitudes
Soutenue le 10 mai 2015 devant le jury composé de:Djebabra Mebarek, Professeur à l’université de Batna Innal Fares, Maître de conférences à l’université de Batna Hamzi Rachida, Maître de conférences à l’université de Batna Nait-Said Rachid, Professeur à l’université de Batna
Korichi Mourad, Maître de conférences à l’université d’Ouargla Hassini Abdelatif, Maître de conférences à l’université d’Oran
Président Rapporteur Co-rapporteur Examinateur Examinateur Examinateur
University Hadj Lakhdar - Batna
Institute of Industrial Health and Safety
Laboratory of Research in Industrial Prevention
MODELING AND EVALUATING THE PERFORMANCE OF
SAFETY INSTRUMENTED SYSTEMS WITH THE
CONSIDERATION OF THE ASSOCIATED
UNCERTAINTIES
A thesis presented
by
Mourad Chebila
in partial fulfillment of the requirements for the degree of
Doctor
in the subject ofIndustrial Health and Safety
Option: Management of Industrial and Environmental Risks
Advisory Committee:
Djebabra Mebarek, Professor at Batna University Innal Fares, Associate Professor at Batna University Hamzi Rachida, Associate Professor at Batna University Nait-Said Rachid, Professor at Batna University
Korichi Mourad, Associate Professor at Ouargla University Hassini Abdelatif, Associate Professor at Oran University
President Advisor Co-advisor Examiner Examiner Examiner May 2015
ii
Abstracts
In today’s industrial facilities that are often based on the employment of the sophisticated equipments and activities as well as the highly hazardous substances, safety instrumented systems (SISs) constitute an essential layer in the process of preventing the occurrence of the dangerous events and protecting the exposed targets (e.g., human beings, environment and properties). Evaluating the performance of such safety devices is fundamental to forecast the level of their ability to perform their intended functions when required and the one of their spurious activations. The main objective of this PhD thesis is to develop a set of generalized and simplified analytical formulas for some of the widely used performance indicators of SISs, namely: average probability of failure on demand (PFDavg), probability of failure per hour (PFH), average probability of failing safely (PFSavg) and spurious trip rate (STR). The implementation of such purpose requires some preliminary investigation on the involved models and assumptions. Moreover, the treatment of the associated parametric uncertainty is indispensable and must be carried out in an appropriate framework.
Keywords: Functional safety, safety instrumented systems, common cause failures, reliability, partial stroking tests, uncertainty and sensitivity analysis.
صخل م يف ةيعانصلا انتآشنم ام ابلاغ يتلا دنتست فيظوت ىلع تازيهجتلا ةطشنلأاو ةدقعملاو ةروطتملا نع لاضف ةروطخلا ةديدشلا داوملا ، لكشت ةمظنأ ةملاسلا ةزهجملا ( SIS ) ةقبط يف ةيساسأ عنم ةيلمع عوقو ةريطخلا ثادحلأا ةيامحو ةضرعملا فادهلأا اهل ( لثم رشبلا ةئيبلا ، تاكلتمملاو .) ربتعي ءادأ مييقت هذه لثم ايساسأ ارمأ ةزهجلأا ؤبنتلل ب ىوتسم لع اهتردق ى اهفئاظو ءادأ ةدوصقملا ءاضتقلاا دنع طاشنلا ىلع اهتردق ىلإ ةفاضلإاب هيف بوغرم ريغلا و فئازلا . فدهلا هاروتكدلا ةلاسر نم يسيئرلا وه هذه نم ةعومجم حارتقا غيصلا ةيليلحتلا لا ةممعم لاو ضعبل ةطسبم ءادلأا تارشؤم ةمدختسملا عساو قاطن ىلع ل SIS يهو ، : طسوتم لامتحا لشفلا بلطلا ىلع ( gva DFP ) ، لشفلا لامتحا ةعاسلاب ( DFP ) ، طسوتم لامتحا لشفلا نامأب ( gva DFS ) و لدعم طاشنلا لا فئاز ( STS .) قيقحت ضرغلا اذه بلطتي ضعب ةيلولأا تاقيقحتلا جذامنلا نع و تاضارتفلاا ةلمعتسملا . كلذ ىلع ةولاعو نإف ، ةجلاعم نيقيلا مدع لا ةطبترملا يدودح ىنغ لا هنع و هذيفنت يغبني يف بسانملا هراطإ . ملك تا ةيحاتفم : ةملاسلا ةمظنأ ،ةيفيظولا ةملاسلا ،ةزهجملا لشف كرتشم ببسب ،ةيقوثوملا ، تارابتخا سجلا ةيئزجلا ، ليلحت نيقيلا مدع و ةيساسحلا . Résumé
Dans les installations industrielles d'aujourd'hui qui sont souvent fondées sur l'emploi des équipements et activités sophistiqués ainsi que les substances extrêmement dangereuses, les systèmes instrumentés de sécurité (SIS) constituent une couche essentielle dans le processus de prévention de l’occurrence des événements dangereux et protection des cibles exposés (p.ex., êtres humains, environnement et propriétés). L'évaluation des performances de ces dispositifs de sécurité est fondamentale pour la prévision du niveau de leur capacité à accomplir leurs fonctions prévues en cas de besoin et l'un de leurs fausses activations. L'objectif principal de cette thèse est de développer un ensemble de formules analytiques généralisées et simplifiées pour certains des indicateurs de performance des SIS, qui sont: la probabilité moyenne de défaillance sur demande (PFDavg), probabilité de défaillance par heure (PFH), probabilité moyenne de défaillance en sécurité (PFSavg) et taux de déclenchement intempestif (STR). La mise en œuvre d'un tel objectif nécessite une étude préliminaire sur les modèles et les hypothèses impliquées. De surcroît, le traitement de l’incertitude paramétrique associée est indispensable et devrait être effectué dans un cadre approprié.
Mots clés: Sécurité fonctionnelle, systèmes instrumentés de sécurité, défaillances de cause commune, fiabilité, tests sur course partielle, analyse d'incertitude et de sensibilité.
iii
Publications
1) Unification of Common Cause Failures’ Parametric Models Using a Generic Markovian Model. Mourad Chebila and Fares Innal. Journal of Failure Analysis and Prevention.Vol: 14, No: 3, pp. 426-434. 2014.
2) Generalized Analytical Expressions for Safety Instrumented Systems' Performance Measures: PFDavg and PFH. Mourad Chebila and Fares Innal. Journal of Loss Prevention in the Process Industries.Vol: 34, pp. 167-176. 2015.
3) Comparative Study between the Beta Factor and Multiple Beta Factor Models.
Mourad Chebila and Fares Innal. Third International Conference on Industrial
Engineering and Manufacturing (ICIEM’2014). Batna, 2014.
4) Treatment of Uncertainty in Probabilistic Risk Assessment Using Monte Carlo Analysis. Fares Innal, Mourad Chebila, Mouloud Bourareche and Antar Si Mohamed. Proceedings of the 3rd International Conference on Systems and Control. Algiers, 2013. 5) Monte Carlo Analysis and Fuzzy Sets for Uncertainty Propagation in SIS
Performance Assessment. Fares Innal, Yves Dutuit and Mourad Chebila. International Journal of Physical Science and Engineering, Vol: 7, No: 11, pp. 306-314. 2013.
6) Safety and Operational Integrity Evaluation and Design Optimisation of Safety Instrumented Systems. Fares Innal, Yves Dutuit and Mourad Chebila. Journal of Reliability Engineering and System Safety. Vol: 134, pp. 32-50. 2015.
iv
Acknowledgments
Alhamdulillah,
I would like to thank Dr. Fares Innal for his incessant help, enthusiasm and valuable guidance during the three years of preparation of this thesis. Honestly, I learned countless and priceless things from him. My sincere thanks also go to Dr. Rachida Hamzi for co-advising this work and, most importantly, for her immense support especially in the last year.
I would also like to express the deepest appreciation to my advisory committee’s members Pr. Mebarek Djebabra, Pr. Rachid Nait-Said, Dr. Mourad Korichi and Dr. Abdelatif Hassini for their efforts, encouragement and precious comments.
Big thanks to all the staff (professors and administrators) of the Institute of Industrial Health and Safety in Batna University.
I deeply appreciate the huge support of my dear friends Hamid, Antar, Zakaria and Assam, thank you for being there for me.
My deepest thanks are reserved to the most important people in my universe: my parents, brothers and sisters.
v
Contents
Abstracts ... ii Publications ... iii Acknowledgments ...iv Contents ... vList of Tables ... vii
List of Figures ...ix
Abbreviations ... xii Introduction ... 1 1 1..BBAASSIICCCCOONNCCEEPPTTSS’’CCLLAARRIIFFIICCAATTIIOON ... 4N 1.1 Dependability ... 5 1.1.1 Threats ... 6 1.1.2 Attributes ... 7 1.1.3 Means ... 11 1.2 Process safety ... 12 1.3 Functional safety ... 18 1.4 Testing policies ... 23
1.4.1 Automatic on-line diagnostic testing ... 23
1.4.2 Proof testing ... 24
1.4.3 Partial stroke testing... 24
1.5 Conclusion... 26
2 2..QQUUAANNTTIIFFIICCAATTIIOONNOOFFTTHHEECCOOMMMMOONNCCAAUUSSEEFFAAIILLUURREESS’’CCOONNTTRRIIBBUUTTIIOON .... 27N 2.1 Common cause failures’ parametric models ... 28
2.1.1 Beta Factor model ... 30
2.1.2 Multiple Greek Letter (MGL) model ... 30
2.1.3 Alpha Factor model ... 30
2.1.4 Binomial Failure Rate (BFR) model ... 31
2.1.5 Multiple Beta Factor (MBF) model ... 31
2.2 Unification of the parametric models ... 32
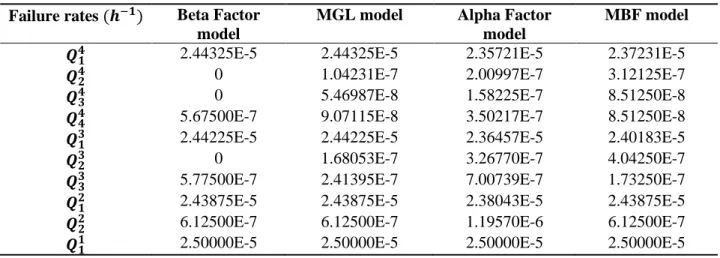
2.3 Illustrative example ... 33
2.3.1 1oo4 architecture ... 35
2.3.2 2oo4 architecture ... 36
2.3.3 3oo4 architecture ... 37
2.3.4 4oo4 architecture ... 39
2.4 Quantitative comparison between the Beta Factor model and MBF model ... 40
2.4.1 Three components (N=3) ... 41 2.4.2 Four components (N=4) ... 43 2.5 Conclusion ... 46 3 3..IIMMPPAACCTTOOFFSSAAFFEE//DDAANNGGEERROOUUSSFFAAIILLUURREESSOONNSSAAFFEETTYY//OOPPEERRAATTIIOONNAALL I INNTTEEGGRRIITTY ... 48Y
vi
3.1 Quantitative evaluation of safe failures’ impact on the safety integrity ... 49
3.1.1 Modeling construction ... 49
3.1.2 Results presentation and discussion ... 56
3.2 Quantitative evaluation of dangerous failures’ impact on the operational integrity... 59
3.2.1 Results presentation and discussion ... 60
3.3 Conclusion ... 63
4 4..MMOODDEELLIINNGGTTHHEESSAAFFEETTYYIINNSSTTRRUUMMEENNTTEEDDSSYYSSTTEEMMSS’’PPEERRFFOORRMMAANNCCEE ... 64
4.1 Safety integrity related metrics ... 65
4.1.1 Considering the dangerous (detected/undetected) failures with proof tests ... 65
4.1.2 Considering the dangerous undetected failures with proof and partial stroking tests ... 69
4.1.3 Considering the dangerous (detected/undetected) failures with proof and partial stroking tests ... 74
4.2 Operational integrity related metrics ... 77
4.2.1 Generic Markov model for KooN architectures (safe failures) ... 77
4.2.2 Extracting PFSKooN and STRKooN from the Markov model ... 78
4.2.3 Results comparison ... 80 4.3 Conclusion ... 82 5 5..PPAARRAAMMEETTRRIICCUUNNCCEERRTTAAIINNTTYYAANNDDSSEENNSSIITTIIVVIITTYYAANNAALLYYSSIIS ... 83S 5.1 Uncertainty analysis ... 84 5.1.1 Definition ... 84 5.1.2 Classification of uncertainty ... 84 5.1.3 Representation of uncertainty ... 86 5.2 Sensitivity analysis... 93
5.2.1 Local sensitivity analysis ... 93
5.2.2 Global sensitivity analysis ... 94
5.3 Treatment of parametric uncertainty and sensitivity analysis in the context of safety instrumented systems ... 94
5.3.1 Case 1: All the probability distributions of all the input parameters can be defined ... 95
5.3.2 Case 2: Only bounds ... 98
5.3.3 Case 3: Multi-type parameters ... 101
5.4 Combining Monte Carlo and fuzzy sets approaches ... 105
5.4.1 General information ... 111
5.4.2 Monte Carlo simulation ... 111
5.4.3 Statistical analysis ... 111
5.4.4 Compliance measures ... 112
5.4.5 Sensitivity analysis ... 112
5.4.6 Illustrative example ... 113
5.5 Conclusion ... 117
Conclusions and perspectives ... 118
References ... 120
vii
List of Tables
Table 1.1 Reasons of the occurrence of failures in the three regions of the bathtub curve (Dhillon, 2006) 8
Table 1.2 Comparison of PSM systems (Bridges, 1994) ... 16
Table 1.3 Safety integrity levels – target failure measures for a safety function operating in low demand mode of operation (IEC 61508, 2010) ... 22
Table 1.4 Safety integrity levels – target failure measures for a safety function operating in high demand mode of operation or continuous mode of operation (IEC 61508, 2010) ... 22
Table 2.1 Modification factors, CMooN, based on system voting logic ... 31
Table 2.2 Values of the failure rates obtained by using different parametric models ... 34
Table 2.3 Uavg and wavg for the 1oo4 architecture ... 35
Table 2.4 Uavg and wavg for the 2oo4 architecture ... 36
Table 2.5 Uavg and wavg for the 3oo4 architecture ... 38
Table 2.6 Uavg and wavg for the 4oo4 architecture ... 39
Table 2.7 The different values obtained by using the two parametric models ... 41
Table 2.8 Uavg and wavg for the 1oo3 architecture ... 41
Table 2.9 Uavg and wavg for the 2oo3 architecture ... 42
Table 2.10 Uavg and wavg for the 1oo4 architecture ... 43
Table 2.11 Uavg and wavg for the 2oo4 architecture ... 44
Table 2.12 Uavg and wavg for the 3oo4 architecture ... 45
Table 3.1 Modeling parameters ... 50
Table 3.2 Modeling results for the PFDavg ... 56
Table 3.3 Modeling results for the PFH ... 57
Table 3.4 Safe failure states of each configuration ... 59
Table 3.5 Modeling results for the PFSavg ... 60
Table 3.6 Modeling results for the STR ... 61
Table 4.1 PFDavg and PFH values with DD/DU failures and PT (without CCF) ... 69
Table 4.2 PFDavg and PFH values with DD/DU failures and PT (with CCF) ... 69
Table 4.3 PFDavg values with DU failures, PT and PST (without CCF) ... 73
Table 4.4 PFHvalues with DU failures, PT and PST (without CCF) ... 73
Table 4.5 PFDavg values with DU failures, PT and PST (with CCF) ... 74
Table 4.6 PFHvalues with DU failures, PT and PST (with CCF) ... 74
Table 4.7 PFDavg values with DD/DU failures, PT and PST (without CCF) ... 77
Table 4.8 Results related to PFSavg for different KooN architectures... 82
Table 4.9 Results related to STR for different KooN architectures ... 82
viii
Table 5.2 Data associated with the 2oo3 subsystem (probability distributions) ... 95
Table 5.3 PFDavg and PFH of the 2oo3 subsystem (without uncertainty) ... 95
Table 5.4 PFDavg and PFH of the 2oo3 subsystem (with uncertainty handled by MC simulation) ... 96
Table 5.5 Sensitivity analysis related to PFDavg of the 2oo3 subsystem (probabilistic framework) ... 97
Table 5.6 Sensitivity analysis related to PFH of the 2oo3 subsystem (probabilistic framework) ... 97
Table 5.7 Data associated with the 2oo3 subsystem (intervals) ... 99
Table 5.8 A priori belief mass distributions of the root nodes of the 2oo3 subsystem ... 99
Table 5.9 PFDavg and PFH of the 2oo3 subsystem (with uncertainty handled by ENs) ... 100
Table 5.10 Sensitivity analysis of the 2oo3 subsystem (inputs as intervals) ... 101
Table 5.11 Non-exhaustive list of mathematical representations consistent with the nature of the information (Baudrit, 2005) ... 102
Table 5.12 Data associated with the 2oo3 subsystem (multi-type data) ... 102
Table 5.13 PFDavg and PFH of the 2oo3 subsystem (with uncertainty handled by PBA) ... 103
Table 5.14 Sensitivity analysis of the 2oo3 subsystem (multi-type parameters) ... 104
Table 5.15 Reliability characteristics of the SIS Elements ... 105
Table 5.16 Obtained results from the MC approach ... 105
Table 5.17 Fuzzy characteristics for the SIS elements ... 107
Table 5.18 Obtained results from the fuzzy sets approach ( =1E-3) ... 107
Table 5.19 Compliance measures related to different required SILs ... 109
Table 5.20 Reliability characteristics for the SIS elements ... 114
Table 5.21 Obtained results from the combined approach ... 114
ix
List of Figures
Fig. 1.1 The dependability tree (Avizienis, et al., 2004) ... 6
Fig. 1.2 Bathtub curve ... 8
Fig. 1.3 Representation of MTTF, MDT, MUT and MTBF (Villemeur, 1988) ... 9
Fig. 1.4 U.S. coal mining fatalities, according to (MSHA, 2013) ... 12
Fig. 1.5 Occupational safety vs. process safety ... 15
Fig. 1.6 Process safety indicator pyramid (ANSI / API RP-754, 2010) ... 17
Fig. 1.7 Relationship of some standards and guidelines to IEC 61508 (Smith, et al., 2004)... 19
Fig. 1.8 Overall safety lifecycle (IEC 61508, 2010) ... 20
Fig. 1.9 Typical risk reduction methods found in process plants (IEC 61511, 2003) ... 21
Fig. 1.10 Failures’ classification ... 23
Fig. 1.11: Safety loop failures sources ... 25
Fig. 2.1 Physical elements of a dependent event (NUREG/CR-4780, 1988) ... 28
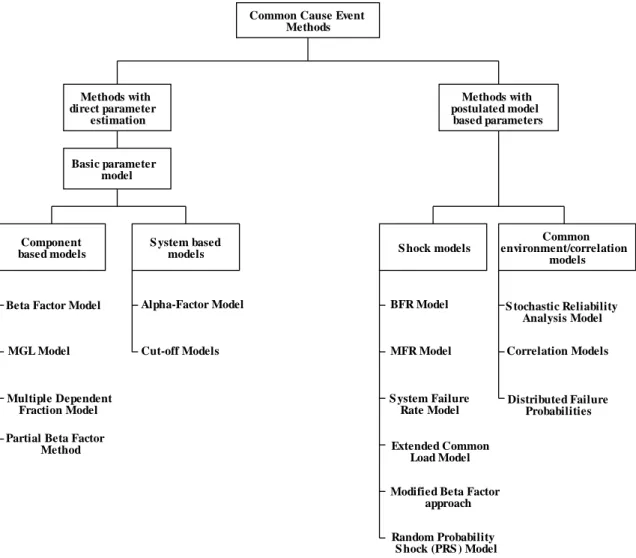
Fig. 2.2 Assignment of common cause models to different classes (NEA/ CSNI/ R (92) 18, 1993) ... 29
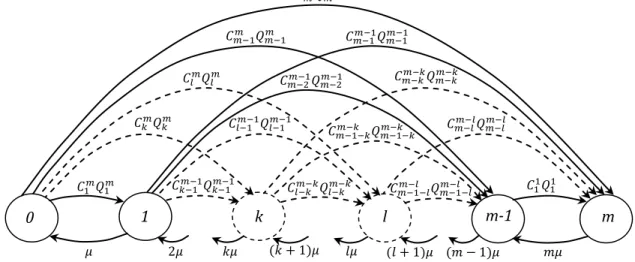
Fig. 2.3 Unified Markov model for the CCF parametric models ... 33
Fig. 2.4 Unified Markov model for a system of four components... 34
Fig. 2.5 U (t) for 1oo4 configuration ... 35
Fig. 2.6 w (t) for 1oo4 configuration ... 36
Fig. 2.7 U (t) for 2oo4 configuration ... 37
Fig. 2.8 w (t) for 2oo4 configuration ... 37
Fig. 2.9 U (t) for 3oo4 configuration ... 38
Fig. 2.10 w (t) for 3oo4 configuration ... 38
Fig. 2.11 U (t) for 4oo4 configuration ... 39
Fig. 2.12 w (t) for 4oo4 configuration ... 39
Fig. 2.13 U (t) for 1oo3 configuration ... 41
Fig. 2.14 w (t) for 1oo3 configuration ... 42
Fig. 2.15 U (t) for 2oo3 configuration ... 42
Fig. 2.16 w (t) for 2oo3 configuration ... 43
Fig. 2.17 U (t) for 1oo4 configuration ... 43
Fig. 2.18 w (t) for 1oo4 configuration ... 44
Fig. 2.19 U (t) for 2oo4 configuration ... 44
Fig. 2.20 w (t) for 2oo4 configuration ... 45
Fig. 2.21 U (t) for 3oo4 configuration ... 45
x
Fig. 3.1 1oo1 electrical diagram ... 50
Fig. 3.2 1oo1 multi-phase Markov model ... 50
Fig. 3.3 1oo2 electrical diagram ... 51
Fig. 3.4 1oo2 multi-phase Markov model ... 51
Fig. 3.5 2oo2 electrical diagram ... 52
Fig. 3.6 2oo2 multi-phase Markov model ... 52
Fig. 3.7 1oo2D electrical diagram ... 53
Fig. 3.8 1oo2D multi-phase Markov model ... 53
Fig. 3.9 1oo3 electrical diagram ... 54
Fig. 3.10 1oo3 multi-phase Markov model ... 54
Fig. 3.11 2oo3 electrical diagram ... 55
Fig. 3.12 2oo3 multi-phase Markov model ... 55
Fig. 3.13 Impact of safe failures on the safety integrity represented by: (a) PFD for 2oo2 and (b) PFH for 1oo2D ... 58
Fig. 3.14 (a) impact of dangerous failures on PFS for the 1oo1 and (b) impact of the DC value on STR for the 1oo2D ... 62
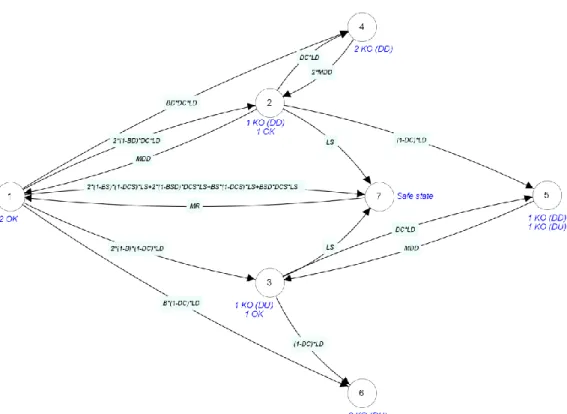
Fig. 4.1 Markov model of a component subject to DD/DU failures and PT ... 66
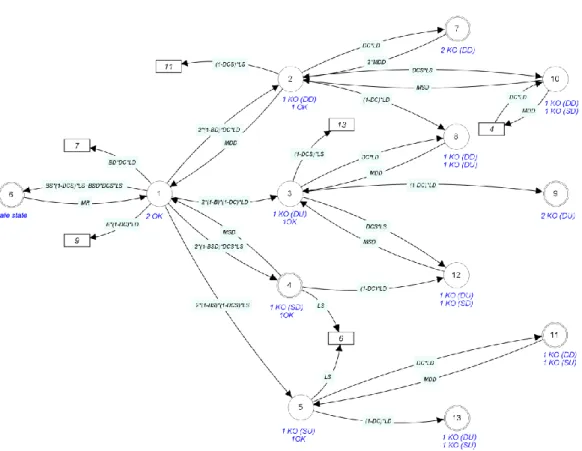
Fig. 4.2 Markov model of a component subject to DU failures, partial and proof tests ... 70
Fig. 4.3 Generic approached Markov model for KooN architectures: (a) independent safe failures and (b) dependent safe failures (CCF) ... 78
Fig. 4.4 Markov models for 2oo2 configuration: (a) multi-phase and (b) approximated models ... 81
Fig. 4.5 PFS(t) and STR(t) for 2oo2 architecture obtained from: (a) multi-phase and (b) approximated models ... 81
Fig. 5.1 Relationship between Belief, Plausibility and Uncertainty ... 90
Fig. 5.2 Frequency distribution of: (a) PFDavg and (b) PFH ... 96
Fig. 5.3 Cobweb plot of PFDavg and its input parameters... 97
Fig. 5.4 Evidential network of the 2oo3 subsystem ... 98
Fig. 5.5 PFDavg of the 2oo3 subsystem and its related parameters in the context of evidential networks 100 Fig. 5.6 Sensitivity analysis for PFDavg and PFH of the 2oo3 subsystem when the inputs are given as intervals ... 101
Fig. 5.7 PFDavg and PFH of the 2oo3 subsystem represented as hybrid numbers (P-boxes) ... 103
Fig. 5.8 Sensitivity analysis for PFDavg and PFH of the 2oo3 subsystem when the inputs are with different natures ... 104
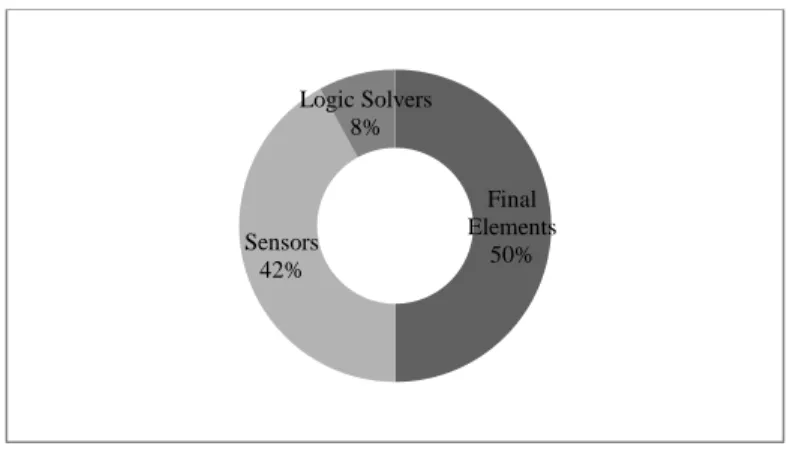
Fig. 5.9 Histograms related to PFDavg and PFH for S, LS, FE and SIS ... 106
Fig. 5.10 Cumulative distribution function of PFDavg and PFH ... 106
Fig. 5.11 Fuzzy numbers related to PFDavg and PFH for S, LS, FE and SIS ... 107
Fig. 5.12 Possibility and necessity measures for a given SILRU ... 109
xi
Fig. 5.14 Overall process for combining MC and fuzzy sets ... 110
Fig. 5.15 Confidence interval for the average fuzzy number ... 112
Fig. 5.16 Average fuzzy numbers related to PFDavg and PFH ... 115
Fig. 5.17 Histograms and CDFs for COGs related to the SIS PFDavg and PFH ... 115
xii
Abbreviations
ANOVA avg Bel BFR CCCG CCF CDF COG DC DD DST DU E/E/PE eFAST EN ESD EUC FAR FAST HFT ind K(M)ooN LOPA LOPC MBF MC MDT MGL MPM MRT MTBF MTTF MTTR MUT OAT PBA P-box PCC pdf PEAR(PPMCC) PFD PFH PFS Pl PRA PRCC Analysis of Variance Average BeliefBinomial Failure Rate
Common Cause Component Group Common Cause Failure
Cumulative Distribution Function Center of Gravity Diagnostic Coverage Dangerous Detected Dempster-Shafer Theory Dangerous Undetected Electrical/Electronic/Programmable Electronic Extended FAST Evidential Network Emergency Shut-Down Equipment Under Control Fatal Accident Rate
Fourier Amplitude Sensitivity Test Hardware Fault Tolerance
Independent N(M)-out-of-N
Layer of Protection Analysis Loss of Primary Containment Multiple Beta Factor
Monte Carlo Mean Down Time Multiple Greek Letter Multi-Phase Markov Mean Repair Time
Mean Time Between Failures Mean Time To Failure
Mean Time To Repair (restoration) Mean Up Time
One-At-a-Time
Probability Bounds Analysis Probability Box
Partial Correlation Coefficient Probability Density Function
Pearson Product-Moment Correlation Coefficient Probability of Failure on Demand
(Average) Probability of Failure per Hour Probability of Failing Safely
Plausibility
Probabilistic Risk Assessment (Analysis) Partial Rank Correlation Coefficient
xiii PSM PST PT PTC RAMS RSS RU SA SFF SIL SIS SPEA SRC SRRC STR TFR UA UPM
Process Safety Management Partial Stroke Testing Proof Testing
Proof Test Coverage
Reliability, Availability, Maintainability and Safety Residual Sum of Squares
Required Upper Bound Sensitivity Analysis Safe Failure Fraction Safety Integrity Level Safety Instrumented Systems
Spearman Rank Correlation Coefficient Standardized Regression Coefficient Standardized Rank Regression Coefficient Spurious Trip Rate
Trinomial Failure Rate Uncertainty Analysis Unified Partial Method
1
Introduction
One of the striking features of post–World War II era is the focus of most of the leaders and regimes on taking, one way or another, the economic side as the forefront of their priorities, the aspect that has an immediate impact on the internal social and political stability as well as the external relations and geopolitical dynamics that added water, food and energy security to the collection of parameters they are controlled by. Such propensity has become a necessity in the global village’s period where the physical distances and boundaries are faded by dint of the informational revolution, which has mightily helped in raising people’s aspirations for more comfortable living conditions and welfare. The result is a tremendous and ceaseless escalation of the demand on water, goods and energy. To exemplify, the BP Company is expecting in its energy outlook (BP, 2014) that primary energy demand increases by 41% between 2012 and 2035, with growth averaging 1.5% per annum, where industry remains the dominant source of growth for primary energy consumption, both directly and indirectly. Under these circumstances, the negative effects are not only limited to the exhaustion of the raw materials and natural resources but they also extend to the direct and immense impact of the industrial facilities, which can be described by their pivotal role in the economy’s engine and their continuous growth in terms of spread, size and risk on human being (health and safety) and environment that has already reached a momentous degree of damage.
With the augmentation of its threats that never stop on showing how severe they could be, industry is obliged to prove that a certain acceptable level of risk is guaranteed. Actually, the current practice, which reflects the accumulation of tens of years of experience, emphasizes that several technical and organizational measures must be employed and distributed over several levels to prevent the occurrence of the undesired events and protect the vulnerable targets. It is well known that the automatic systems constitute an indispensable and irreplaceable element in the process of risk reduction in almost all of nowadays’ industrial facilities. Taking advantage of the giant technological and practical advancements, those safety devices are witnessing a continuous development in terms of efficiency and sophistication. To a large extent, it has been recognized that a comprehensive approach must be adopted to accompany the automatic safety systems throughout their lifecycle in order to manage their criticality and complexity, the matter that is reflected by the engendered standards, codes and techniques in this context. In addition to ensuring that the safety purposes are appropriately defined, measured, carried out and pursued, the usefulness of such approach includes the avoidance of the problem of over-design whose implications are twofold: a) superfluous cost at several stages and b) higher likelihood of occurrence of the spurious shutdowns that result from the erroneous activation of the safety functions due to the so-called safe failures.
2 The IEC 61508 is an international functional safety-related standard that adopts an overall safety lifecycle approach as a technical framework for the coverage of all of the involved steps and functions in the process of reducing risks to a certain tolerable level that includes the intervention of the electrical / electronic / programmable electronic (E/E/PE) safety-related systems. This generic standard, which gained an important attention within the industrial and scientific communities, represents a foundation of many specific product and application sector standards like the IEC 61511 that exclusively deals with the process industry sector. However, the provided lifecycle holds multiple activities from the initial concept, though design, implementation, operation and maintenance to decommissioning of the safety instrumented systems (SISs), which correspond to the (E/E/PE) safety-related systems in the process industry sector. Those activities are habitually categorized into three distinct phases, which are the analysis, realization and operation.
Indeed, one of the key steps in the realization phase that has a forthright effect on the whole process is the quantitative evaluation of the performance of SISs to verify their ability to suitably accomplish their intended safety instrumented functions (SIFs) whose magnitudes are defined via the concept of safety integrity level (SIL). For the physical hardware portion, such evaluation is customarily probabilistic based on the estimation of the average probability of failure on demand (PFDavg) and average probability of failure per hour (PFH), where each metric is
dedicated to a specific demand mode of operation. However, these performance indicators are functions of a variety of types of factors and parameters, such as failure rates, testing capabilities and intervals, and repair times. Finding an appropriate formalization for those elements is the challenging task because of the involved behaviors and interactions what requires the use of several simplifications and assumptions to handle that complexity that worsens as the number of the redundant components increases. A large number of tools and techniques could be employed for the sake of reliability modeling of the performance of SISs like Reliability Block Diagrams, Fault trees, Markov models, Petri nets, etc., where the selection entails the observance of the criteria of easiness and capability to take the various characteristics into consideration.
As the SISs can cease to provide the intended function when it is required (potentially unsafe conditions), it also common that they go to the other extreme by falsely activating the safety function when there is no need for it. According to (Lundteigen, et al., 2008 (a)), such undesirable disruptions may lead to production loss, stress on affected components and systems, and hazards during system restoration. The significance of those consequences necessitates the assessment of this performance side of SISs, which is known as operational (production) integrity, during the designing stage to forecast the spurious trips’ occurrence and judging their acceptance. There exists several metrics in the context of operational integrity like the average probability of failing safely (PFSavg), spurious trip rate (STR) and mean time to failure-spurious
(MTTFspurious). Similarly to the safety integrity’s ones, these latter performance indicators are
3 Indubitably, modeling the performance of SISs is quite delicate and intricate, where the occasions of mistaking are numerous and their disclosure may not be very accessible whereas even the smallest mistakes can affect the credibility of the ultimate results. In this context, it is explicitly pointed out in the sixth part of the IEC 61508 that it is very important that the user of a particular technique is competent in using the technique and this may be more important than the technique which is actually used. Under many factual circumstances, the simplified equations approach represents the best possible and safest alternative. One of the principal objectives of this thesis is to provide a new formulation for the various performance indicators of both safety and operational integrity that bridges several gaps in the already existing ones. Besides the consideration of the various involved features (e.g., CCF events and PST) the proposed formulas should be generalized to handle any KooN architecture and, most importantly, hold certain simplicity in implementation and flexibility in adapting them to many possible situations. Prior to that, it is important to investigate some comprised choices and hypotheses like the selection of the model to be used for the quantification of CCF events’ contribution and the exclusion’s impact of certain constituents.
Uncertainty is thoroughly embedded in the evaluation of the performance of SISs under several forms and types, the concern that must be understood and addressed. An in depth description and clarification of this aspect would be presented in purpose of correctly deciding on which is the treatment way that can fit the nature and specificity of SISs. Another related objective is weighing the contribution of each source to the overall uncertainty in the outputs.
This thesis consists of five chapters. Chapter 1 is entirely dedicated to the study of the various relevant terms, concepts and notions in purpose of clarifying the relationships between them and attempting to demystify some of the prevalent confusions in such scope. The aim of chapter 2 is to scrutinize the CCFs that have the leading role in most of the situations with an utter focus on the different models that could be used to quantify the contribution such events. The effect of neglecting the safe failures in the evaluation of the safety integrity on the one hand and the dangerous failures in the evaluation of the operational integrity on the other one is the theme of chapter 3. Chapter 4 is devoted to modeling the performance of SISs by proposing new generalized formulas for all of PFDavg, PFH, PFSavg and STR, while the analysis of both
4
1
1
.
.
B
BA
AS
S
IC
I
C
C
C
ON
O
N
CE
C
EP
PT
TS
S’
’
C
CL
LA
A
RI
R
I
FI
F
I
CA
C
AT
TI
I
ON
O
N
It is recognizable that even the simplest activities in the everyday life are accompanied by certain relative risks, the fact that necessitates the human being to learn how to deal with their existence since a very young age. Not to mention the industrial activities which mainly rely on extremely complex and sophisticated technologies and usually highly hazardous substances. In brief, an industrial hazard is defined in (IAPA, 2007) as “The potential of any machine, equipment, process, material (including biological and chemical) or physical factor that may cause harm to people, or damage to property or the environment”, while the concept of risk is considered in (Crowl, et al., 2011) as “a measure of human injury, environmental damage, or economic loss in terms of both the incident likelihood and the magnitude of the loss or injury”. Actually, any effort to reduce the incident likelihood is viewed as a prevention measure, whereas working on the magnitude of the consequences is customarily considered as a measure of protection or mitigation.
Over the years, the industrial community has developed several approaches, means and techniques in purpose of facing up to such events. The unfortunate industrial accidents that occurred all over the world have contributed in revealing many gaps in the way the industrial safety is regarded and dealt, and also helped to the dissemination of the public awareness concerning this issue, the fact that added an extra pressure to ensure a certain level of safety that goes along with the complexity and riskiness of the dealing with systems and materials. Today, the industrial safety has reached an important and compound level, the truth that can be verified through the advanced management strategies, the abundance of the related tools and data, and also through the effectiveness and accuracy of the technical safeguarding measures.
This first chapter is utterly devoted to provide a theoretical summing up of the current practice and perception regarding the concept of safety, its relationship with many other close concepts and theories as well as its partitions and the means it relies on to attain that major goal. Indeed, among those means the highlight will be focused on the safety instrumented systems (SIS) and their corresponding notions and standards, since they are the hub of this work and such description is indispensable for the rest of chapters.
5
1.1 Dependability
The early years of the twentieth century witnessed an unprecedented growth in terms of systems’ technology used in the different fields of industry. That growth at that point was a logical continuation to the previous century’s innovations such as battery, automobile, electricity,… and a necessity to keep up first with the political, economic and social instability (world wars, great depression, etc.) of that period and then with the insatiable productivity which was supplied by the immense rising demand for more goods and services with certain level of quality which, in turn, reflected the evolution in the standards of living in several parts of the world. To deal with the fact that the systems become more complex and the traditional practice become unable to cope with that situation, new disciplines have appeared progressively such as control engineering, logistics engineering, reliability engineering, performance engineering,… to manage that complexity. Later on, those disciplines have been gathered under the name of system engineering. Within this latter the concept of dependability has came into view, which is considered at the beginning as a synonym of reliability but it soon took its appropriate track.
In fact, there is no consensus on how to define dependability or what it should comprise. It is a broad concept and it has a considerable flexibility that allows it to take different forms and handle different notions. In what follows we cite some of the widely accepted definitions in purpose of taking a quick look at the meaning of dependability from different corners.
Starting first by (Villemeur, 1988), in which dependability is considered as: a) the science of failures that includes their knowledge, evaluation, prediction, measurement and mastery, and more strictly b) the ability of an entity to satisfy one or more required functions under given conditions. In a similar fashion, (Avizienis, et al., 1986) considers dependability as a property of a computer system that allows reliance to be justifiably placed on the service it delivers. Later on, the providers of this latter definition have amended it in purpose of making it more convenient and in line with the definitions of its attributes, where it is defined in (Avizienis, et al., 2000) as the ability to deliver service that can justifiably be trusted.
The standard (EN 13306, 2010) defines dependability as the ability to perform as and when required. Moreover, the characteristics of this latter include availability and its inherent or external influencing factors, such as: reliability, fault-tolerance, recoverability, integrity, security, maintainability, durability and maintenance support. The upcoming elucidation of the different attributes of dependability will show that this definition is somehow abridging this latter in one of its constituents, which is the availability concept.
The acronym RAMS (Reliability, Availability, Maintainability and Safety) substitutes the term dependability in many documents such as (IEC 62278, 2002). In fact, dependability is much larger because it takes into account the ingredients of this acronym and many other ones. However, from this sample of definitions, it can be concluded that dependability is an umbrella term, where its constituents may vary from an area to another.
6 The dependability tree (see Fig. 1.1) has been used for many years in many references such as (Avizienis, et al., 1986; Laprie, 1995 (a); Laprie, 1995 (b); Avizienis, et al., 2000) to describe the structure of dependability and how its constituents are interconnected. Actually, this tree has passed through several stages to reach this format which is obtained from (Avizienis, et al., 2004). In what follows, a brief description of the various constituents of the tree will be provided.
Fig. 1.1 The dependability tree (Avizienis, et al., 2004)
1.1.1 Threats
Also known as impairments and as it appears from the tree, they cover faults, errors and failures. Like their names imply, those notions can elicit unpleasant situations, disturbances or harms to the system’s dependability, in other words, they are able to prevent the system (or part of it) from properly fulfill its function.
Faults: could happen at any stage of the system’s lifecycle and they denote weak, wrong or imperfect actions, circumstances or things that happen inside the system itself or in its environment, where their consequences may be limited to this extent or upgrade to more serious levels.
Errors: basically follow faults, they may be detectable or not. In fact, they represent the inconsistency between the desired and the existent performance of the system. Under some conditions they can generate other errors or even lead to the failure of the system. Failures: simply defined by the Oxford dictionary as the actions or states of not
functioning. A failed system represents any system with no ability to fulfill its planned function. They are typically caused by errors. Furthermore, the manner in which a system fails is called failure mode.
FAULTS ERRORS FAILURES AVAILABILITY RELIABILITY SAFETY CONFIDENTIALITY INTEGRITY MAINTAINABILITY FAULT PREVENTION FAULT TOLERANCE FAULT REMOVAL FAULT FORECASTING THREATS ATTRIBUTES MEANS DEPENDABILITY
7 It should be noted that there is no accord on which one of the three concepts occur before the other, and contrary to what it has been stated here many consider that faults result from failures. Also many consider that the main difference between a fault and a failure lies in the fact that the first is a state where the other is an event. In this context, (Cheol Kim, et al., 2015) reviews many definitions related to those terms.
1.1.2 Attributes
The dependability’s attributes stand for a set of metrics that essentially aim to gauge its performance, like the readiness and/or the continuance of delivering a correct service. As it has been mentioned earlier, other than those metrics listed in the tree and will be targeted hereinafter, many other ones can be found that depends on the scope and the user’s need.
In point of fact, before introducing those attributes, it would be quite useful to pass through certain essential concepts. Let the random variable T ≥ 0 to be the time to failure of a given item, with a certain distribution (e.g., exponential, weibull, gamma and normal). Then, F(t) is the cumulative distribution function (CDF) of this latter, which represents the probability that the corresponding item will fail in the interval [0,t], and f(t) is its probability density function (pdf) that is defined in Eq. (1.1).
Δt Δt) t T Pr(t lim dt dF(t) f(t) 0 Δt (1.1)
The term
f
(
t
)
t
symbolizes the (unconditional) probability that the item will fail in the time interval (t
,
t
t
]. In fact, it is more popular and useful within the dependability studies to employ the conditional probability that the item will fail in the time interval (t
,
t
t
] given that this latter item has remained immune to failures until the time t. This conditional probability is customarily denoted by
(
t
)
t
and extracted from the next equation:1 F(t) f(t) Δt ) t T Δt t T Pr(t lim λ(t) 0 Δt (1.2)
The function
(t
)
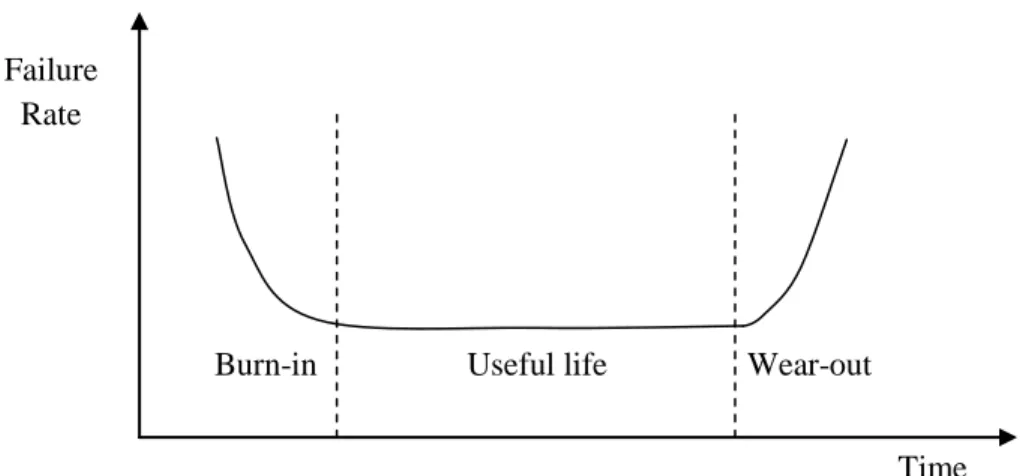
is known as failure rate function or hazard rate function and it forms one of the most significant concepts in the field of dependability. Obviously, it can be interpreted as the probability of failure in an infinitesimal unit interval of time (Finkelstein, 2008). It is common to assimilate the form of the failure rate function over the item’s lifetime (especially the electronic ones) to the bathtub curve (see Fig. 1.2).8
Fig. 1.2 Bathtub curve
Three distinct regions (or phases) can be noticed in the bathtub curve. The burn-in region represents the early life of the item where the failure rate begins high and then decreases until it reaches the useful life phase, in which the failure rate remains almost constant, particularly for the electronic items. Lastly, in the wear-out phase the failure rate increases as the functioning time is running. Table 1.1 provides some of the failures’ causes in each phase.
Table 1.1 Reasons of the occurrence of failures in the three regions of the bathtub curve (Dhillon, 2006)
Phase Cause
Burn-in Poor manufacturing methods Poor process
Poor quality control Poor debugging Human error
Substandard materials and workmanship Useful life Low safety factors
Undetectable defects Human errors Abuse
Higher random stress than expected Natural failures
Wear-out Wear-out caused by friction Poor maintenance
Incorrect overhaul practices Corrosion and creep
Short designed-in life of the item Wear caused by aging
Time Failure Rate Wear-out Useful life Burn-in
9 In fact, other useful concepts are extensively used in this field, namely: MTTF, MDT, MUT and MTBF. Actually, Fig. 1.3 that is obtained from (Villemeur, 1988) provides one of preeminent ways to explain the relationship between these different notions.
Mean Time To Failure (MTTF): represents the expected value of T, it is useful for the non-repairable items. Mathematically, MTTF can be defined as follows:
0 tf(t)dt MTTF (1.3) Mean Down Time (MDT): is the expectation of the total down time, it includes the needed time to detect and repair the failure as well as the needed time to return the item into service. In other words, the well known Mean Time To Repair (MTTR) belongs to the MDT, and it can substitute it whenever the other two related times considered relatively less important.
Mean Up Time (MUT): after the occurrence of the failure, detecting and repairing it, MUT represent the expected time between the moment of returning the item to perform its intended function till the occurrence of the next failure. Conversely to MTTF, MUT is the utilized one for the repairable items.
Mean Time Between Failures (MTBF): is the expected time between two consecutive failures. MTBF can be expressed in terms of MDT and MUT as follows:
MTBFMDTMUT (1.4)
It should be noted that in many cases the term MTBF is used instead of MUT, this fact can be referred whether to the unpopularity of this latter or the negligence of MDT compared to MUT.
Fig. 1.3 Representation of MTTF, MDT, MUT and MTBF (Villemeur, 1988)
Availability
This attribute is related to the repairable systems, it is defined in (IEC 60050, 1999) as the ability of an item to be in a state to perform a required function under given conditions at a given instant of time or over a given time interval, assuming that the external resources are provided. Regardless how many times the corresponding item has failed and repaired formerly, its
Failure 1
0 Time
MTTF MDT MUT
MTBF
10 availability represents its readiness of correctly functioning. Actually, the reader should be aware that there exist several meanings and interpretations of availability, while some of them are used more frequently than others. The three most famous kinds of availability are the instantaneous availability, average availability, and steady state availability:
Instantaneous (point) availability: as its name indicates, the instantaneous availability focuses on the ability of suitably performing at the specific instant t. It can be written in the following manner (Shooman, 2002):
A(t)Pr(no failurein [0,t]1 failure and 1 repair in [0,t]) (1.5)
Average availability: aka, interval availability represents the average of the former availability over a given period of time Z.
Z avg At dt Z A 0 ) ( 1 (1.6) Steady state availability: usually deemed as asymptotic availability or limit availability, which represents the limit of the instantaneous availability as time tends to infinity:
A()tlimA(t) (1.7) Also, it is habitually computed as follows:
MDT MUT MUT A (1.8) Reliability
As an attribute, reliability is habitually defined as the ability of an item to perform its required function under given conditions for a certain time interval [0, t], given that it was functioning properly at t=0. From a quantitative viewpoint, that ability is simply handled as probability and denoted by R(t).
R(t)
Pr(T
t)
1
Pr(T
t)
1
F(t)
(1.9)Where, F(t) is the unreliability, which is in fact, the CDF of T.
Safety
Sharing the use of the same tools and methods had created a sort of confusion between safety and other traditional attributes (reliability in particular), but the outcrop of many terms such as safe/unsafe failures has put an end to that bafflement. Safety could be viewed as: a) the freedom from those conditions that can cause death, injury, occupational illness, damage to or loss of equipment or property, or damage to the environment (MIL-STD-882D, 2000), or merely as b)
11 the ability of an item to keep all over its lifecycle an acceptable level of risk that could constitute a threat of any kind to human being, good, and/or environment.
Confidentiality
Irrefutably, data and information are a priceless treasure that must be tightly protected and kept away from the not permitted individuals’ access. According to (Rogers, et al., 2009), confidentiality is violated whenever sensitive or proprietary information is disclosed to any unauthorized entity (human, program, or computer system). Encryption is commonly renowned as a powerful tool to boost confidentiality.
Integrity
Actually, this attribute is somewhat interrelated with the preceding one. It is defined in (Avizienis, et al., 2004) as the absence of improper system alterations. In reality, the seriousness of this attribute lies in its capability to directly impinge on the other ones. In other words, the infringement of this latter can be overwhelming for other attributes like safety, reliability and/or availability since the relied upon information became fallacious.
Maintainability
To end with maintainability, which is defined in (MIL-STD-721C, 1981) as the measure of the ability of an item to be retained in or restored to specified condition when maintenance is performed by personnel having specified skill levels, using prescribed procedures and resources, at each prescribed level of maintenance and repair. The beforehand seen MTTR is the basic measure of this fundamental dependability’s attribute.
To seal this topic, let us mention the confidentiality, integrity and availability form jointly one of the core features of security, which is well known as the CIA triad.
1.1.3 Means
Opposing the threats, means of dependability represent a set of tools, measures or defensive barriers that endeavor to enhance the system’s dependability, by confronting those previously discussed threats. They are habitually split into four categories, where they cover the entire lifecycle of the system.
Fault prevention: by acting early (i.e., eliminating all the possible causes that have the potential to generate faults), this practice is intended to keep the item away from faults and therefore errors and failures.
Fault tolerance: is an important and widely used technique to guarantee the continuation of the function, even with the existence of certain number of faults and errors. Indeed, the concept of redundancy (hardware, software, information or time) has a vital role in achieving this task.
12
Fault removal: now, if the faults already exist, this technique typically aims to detect that existence and fix them using a combination of several procedures such as verification (which in turn employs lots of techniques like the various testing and inspection policies), diagnosis and correction.
Fault forecasting: is a whole approach that seeks to process those threats in detail by predict, assess and control their occurrence. This could be done via different tools and methods such as block diagrams, Fault trees, Markov models, Petri nets, etc.
Unfortunately, the practical implementation of these means is not always trouble-free as it seems theoretically and their effects are not utterly positive. Moreover, they may contribute in increasing the complexity and therefore the undependability of the system.
1.2 Process safety
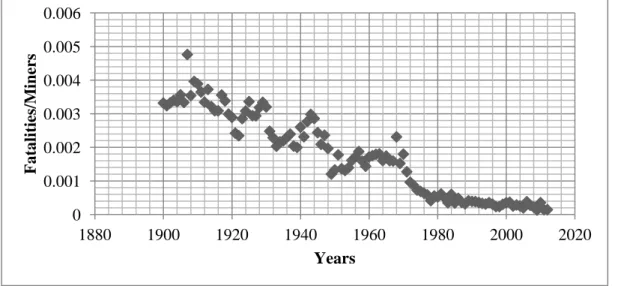
The early years of the twentieth century has witnessed the lucid birth of the concept of safety in the industrial world. That birth was not a luxury or a coincidence, but an outcome of the terrible rates of work-related fatalities, illnesses and injuries that reached deplorable levels because of the human obsession with rapid profits that escalated with the emergence of the industrial revolution. Through the effective striving of several scientists, activists and unions like Alice Hamilton, Irving Selikoff and Frances Perkins in the U.S. and in the advanced countries in general a considerable attention has been paid to this issue and the result was the drawing up of more rigorous laws, regulations and standards in order of making the workplaces safer and protecting the rights of workers concerning this matter. A tangible progress has been achieved thanks to those endeavors, the fact that can quantitatively verified through the important decline in the total number of occupational incidents. For instance, Fig. 1.4 shows the fatalities’ rates in the U.S. coal mining since 1900, where the tremendous progress is observable.
Fig. 1.4 U.S. coal mining fatalities, according to (MSHA , 2013)
0 0.001 0.002 0.003 0.004 0.005 0.006 1880 1900 1920 1940 1960 1980 2000 2020 F at al it ies /M iner s Years
13 Gradually, that trend of protecting the workers from the work-related hazards and risks has become a priority in most parts of the world and it is well-known today under the name of occupational safety. Furthermore, scientist and engineers have created over the years several metrics and indicators to measure the industrials’ performance regarding that vital aspect. For example, it is advised to employ the following formula in order to compute the Fatal Accident Rate (FAR) that is taken for 1000 employees working for 100,000 hours during their lifetime (see (Crowl, et al., 2011) for further reading):
covered period during employees all by worked hours Total 10 fatalities of Number FAR 8 (1.10)
After the end of the Second World War (1939-1945) with its colossal consequences that massively affected the economic situation and exhausted the human being throughout the globe, an unprecedented gluttony towards more goods with high qualities has appeared. The bulk of the mission of dealing with that situation has entrusted to the different sectors of industry, which in turn have carried it out to the fullest. Indeed, the upshot of that important recovery and shift from a situation to another superior one was a big demographic growth, which soared from about 1.6 billion in 1901 to 6.1 billion at the end of that century. Eventually, the causal relationship between the economic conditions and the population size has created a sort of snowball where the growth of the first causes the growth of the second and vice versa.
Logically, in purpose of convoying that growth, it is required from the different sectors of industry, especially the process ones (e.g., oil and gas, chemical, food, textiles, etc.), to produce quantitatively and qualitatively, which does not mean nothing else than more industrial facilities that employs extremely complex procedures and technologies with huge amounts of highly hazardous materials and substances.
The unfortunate result of the combination of all those factors was the tragic manifestation of the so-called major accidents that have rocked and still rocking everywhere and causing disastrous consequences especially to persons and environment. Certainly, the horrific number of those regrettable events makes the task of exhaustively counting them in this manuscript so intricate, instead some of the most famous and change prompters ones will be briefly pointed out hereinafter. Further details can be found in the third volume of (Mannan, 2005).
Flixborough, England (1974)
A ruptured bypass system at a chemical plant led to the leak of the hazardous cyclohexane, forming a colossal flammable vapor cloud. In contact with a source of ignition, this latter has exploded leaving more than 28 workers killed and 36 injured in addition to the complete destruction of the entire plant. This accident has led to the set up of the Advisory Committee on Major Hazards.
14
Seveso, Italy (1976)
A dense white vapor cloud of TCDD (type of dioxin witch known as a carcinogenic and extremely poisonous substance) released through the relief valve of a reactor in a chemical plant manufacturing pesticides and herbicides causing the contamination of approximately ten square miles of land, the matter that led to the evacuation of more than 600 habitants and treating 2000 people for dioxin poisoning in addition to the important fauna and flora losses. This disaster was the primary cause to adopt the so-called Seveso Directives throughout the European continent.
Bhopal, India (1984)
More than 43 tons of the poisonous methyl-isocyanate (MIC) gas escaped into the atmosphere from a pesticide plant in exposure of 500,000 persons living around the factory. About 8,000 innocent were killed during the first days and almost 100,000 significantly injured. Incontrovertibly, the huge number of deaths and how dreadfully they have been killed in addition to the long term effects (e.g., cancers and deformities) make this accident the worst industrial disaster in history.
Mexico City, Mexico (1984)
A series of BLEVE (Boiling Liquid Expanding Vapor Explosion) explosions in the form of domino effect initiated by an UVCE (Unconfined Vapor Cloud Explosion) took place at a LPG (Liquefied Petroleum Gas) terminal. In addition to the entire facility, a large part of the local town of San Juan Ixhuatepec has been devastated. The human tolls were estimated by 500 fatalities and around 5000 people severely injured.
As it has been mentioned earlier, those four major accidents are a little sample of many other ones such as Pasadena (1989), AZF Toulouse (2001) and Venezuela (2012). Locally, in 2004 an explosion rocked one of the world’s biggest LNG (Liquefied Natural Gas) plants located in Skikda, destroying three of the six liquefaction trains and leaving 27 people dead and 74 others injured. This catastrophic event has attracted a big national attention to the vital role of industrial safety and the result was more stringent and control on the application and use of the safety reports through several laws and decrees like (JORA, 2004; JORA, 2006; JORA, 2007).
In purpose of coping with that emerging threat, a new branch of safety has come into view which principally focuses on minimizing the occurrence likelihood and cruelty of such major accidents. Within the process industries that branch became known as process safety and in some references loss prevention. Process safety is defined in (API) as a disciplined framework for managing the integrity of hazardous operating systems and process by applying good design principles, engineering, and operating and maintenance practices. Indeed, there is a vast difference between the occupational safety and the process one. As illustrates the following figure, the occupational safety related events (e.g., falls and electrifications) are frequent and relatively less severe since they affect a limited number of employees, while the process ones
15 (e.g., fires and explosions) are rare but have very tough impacts not only on the corresponding facility zone but on its human and natural environment as well.
Fig. 1.5 Occupational safety vs. process safety
Several regulations and standards have been enacted in order of organizing the facilities that include major-accident hazards and ensuring that the generated risks are deeply defined, analyzed and controlled. After the Seveso disaster, the member states of the European Union adopted in 1982 the Council Directive 82/501/EEC on the major-accident hazards of certain industrial activities (Seveso I) (OJ, 1982) that was replaced later by the Council Directive 96/82/EC on the control of major-accident hazards (Seveso II) (OJEC, 1997) in 1996 and lately by the Directive 2012/18/EU of the European Parliament and of the Council of 4 July 2012 on the control of major-accident hazards involving dangerous substances (Seveso III) (OJEU, 2012). Those replacements and many other modifications, emendations and extensions reflect principally the learned lessons from the occurrence of major tragedies in different parts of the world. However, the gist of Seveso directives is the so-called safety report, which should be prepared by the operator of the upper-tier establishments and under his responsibility. According to (OJEU, 2012), the following five elements represent the outlines of the minimum data and information to be considered in the safety report. Yet, many documents like (INERIS – DRA, 2006) can be very helpful in terms of clarification and carrying out such a task.
Information on the management system and on the organization of the establishment with a view to major-accident prevention
Presentation of the environment of the establishment Description of the installation
Identification and accidental risks analysis and prevention methods
Measures of protection and intervention to limit the consequences of a major accident Occupational Safety Process Safety Likelihood of Occurrence Sever it y of C ons equenc es
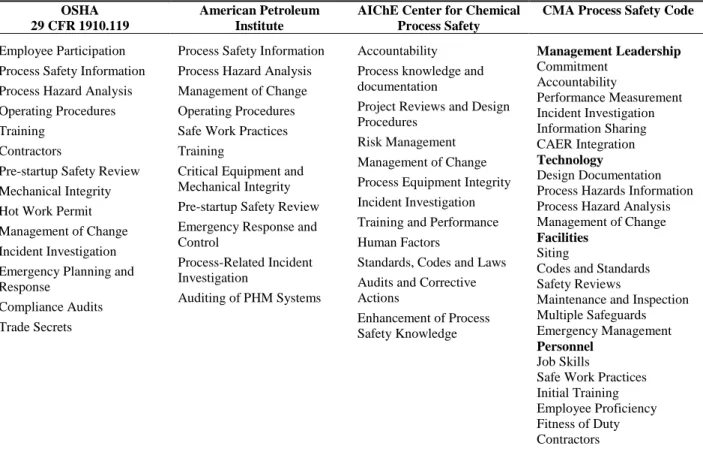
16 Outside the European Union, the U.S. Occupational Safety and Health Administration (OSHA) has issued the Process Safety Management of Highly Hazardous Chemicals standard (29 CFR1910.119, 1992) that contains requirements for preventing or minimizing the consequences of catastrophic releases of toxic, reactive, flammable, or explosive chemicals, by means of the so-called Process Safety Management (PSM). This latter concept, which by the way is currently used in many other countries like Canada, is defined in (CCPS, 1992 ) as the application of management principles to the identification, understanding, and control of process hazards to prevent process-related injuries and incidents. In other words, the main objective of the PSM is ensuring that the hazardous chemicals are kept inside their equipments. The subsequent table summarizes the elements of the PSM that slightly varies from one source to another.
Table 1.2 Comparison of PSM systems (Bridges, 1994)
OSHA 29 CFR 1910.119
American Petroleum Institute
AIChE Center for Chemical Process Safety
CMA Process Safety Code
Employee Participation Process Safety Information Process Hazard Analysis Operating Procedures Training
Contractors
Pre-startup Safety Review Mechanical Integrity Hot Work Permit Management of Change Incident Investigation Emergency Planning and Response
Compliance Audits Trade Secrets
Process Safety Information Process Hazard Analysis Management of Change Operating Procedures Safe Work Practices Training
Critical Equipment and Mechanical Integrity Pre-startup Safety Review Emergency Response and Control
Process-Related Incident Investigation
Auditing of PHM Systems
Accountability Process knowledge and documentation
Project Reviews and Design Procedures
Risk Management Management of Change Process Equipment Integrity Incident Investigation Training and Performance Human Factors
Standards, Codes and Laws Audits and Corrective Actions Enhancement of Process Safety Knowledge Management Leadership Commitment Accountability Performance Measurement Incident Investigation Information Sharing CAER Integration Technology Design Documentation Process Hazards Information Process Hazard Analysis Management of Change
Facilities
Siting
Codes and Standards Safety Reviews
Maintenance and Inspection Multiple Safeguards Emergency Management
Personnel
Job Skills
Safe Work Practices Initial Training Employee Proficiency Fitness of Duty Contractors
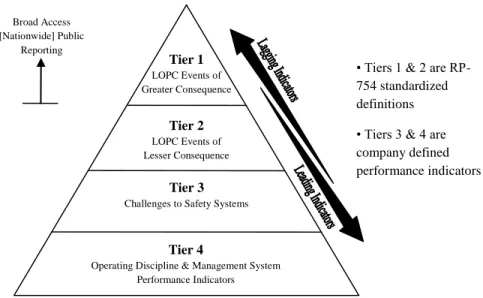
When it comes to metrics and indicators, the process safety is weaker than the other kind of safety, the matter that can be referred to the scarcity of occurrence of its related events (as we have seen before), and therefore a scarcity in the needed data to estimate such indicators. However, an important advancement has been made in this direction especially after the two reports (Baker III, et al., 2007; CSB, 2007) that issued in light of the 2005 BP Texas City explosion (15 deaths and more than 170 injuries) and recommend to find a common way to measure the process safety performance via the lagging and leading metrics. In response to those