-I-BIOGEOCHEMISTRY OF DISSOLVED FREE AMINO ACIDS IN MARINE SEDIMENTS by
SUSAN MARGARET HENRICHS B. S., University of Washington
(1975)
SUBMITTED IN PARTIAL FULFILLMENT OF THE REQUIREMENTS FOR THE
DEGREE OF
DOCTOR OF PHILOSOPHY at the
MASSACHUSETTS INSTITUTE OF TECHNOLOGY and the
WOODS HOLE OCEANOGRAPHIC INSTITUTION August, 1980
Signature of Author.. f...
Joint Program in Oceanography, Massachusetts Institute of Technology-Woods Hole Oceanographic Institution, and Department of Earth and Planetary Sciences, and Depa tent of Meteorology, Ma sachusetts Institute of
T ogy,
4gukt,/98.
, /sCertified by..
C i b John W. Farrington, Thesis Suer -
-Accepted by...
.
...
.. , .Chairman, Joint Oceanography Committee in the Earth Sciences, Massachusetts Institute of Technology - Woods Hole Oceanographic Institution.
Susan Margaret Henrichs
Submitted to the Joint Oceanographic Committee in the Earth Sciences, Massachusetts Institute of Technology and Woods Hole
Oceanographic Institution on August 15, 1980 in partial fulfillment of the requirements for the Degree of Doctor of Philosophy.
Abstract
Dissolved free amino acids (DFAA) were measured in interstitial water samples squeezed from sediments collected in a variety of
deposi-tional environments. These sediments were further characterized by measurements of total organic carbon, oatal nitrogen, dissolved organic
carbon, total hydrolyzable amino acids, and pore water-dissolved remin-eralization products.
Surface sediments from the oxygen minimum zone of the Peru Up-welling Region, which consisted of a filamentous bacterial mat, were sampled at three locations. DFAA concentrations within the mat ranged from 5 to 220 VM, with the highest concentrations found in the upper 4 cm at two stations on the landward and seaward edges of the zone, and lower concentrations at a station in the middle of the oxygen minimum zone. Within cores, lower concentrations were found at depths below tne mat; and below 30 cm depth concentrations were between 0.7 and 3 pM. Two short cores of offshore sediments had concentrations between 14 and 40
pM
(1400 m depth) and between 3 and 8 pM (5200 m). Glutamic acid was the predominant amino acid in nearly all surface sediment samples, making up 30 to 70 mole %. In sediments below 15 cm depth, B-aminoglutaric acid was often more abundant than glutamic acid and other amino acids were virtually absent.
Glutamic acid, both from several analyses performed during this work and from data available in the literature, is a major DFAA of bac-terial pools, and bacteria are a likely source for the high concentra-tions seen in interstitial water samples. DFAA may be extracted from living cells by the squeezing process, or may be excreted by the bacteria under natural conditions. -Aminoglutaric acid is a non-protein amino acid isomer of glutamic acid which has not been previously reported as a natural product. However, this work has shown it to be a constituent of the free amino acid pools of some bacteria at about 5 mole %. Its much larger relative abundance in sediments could stem from organisms which biosynthesize greater amounts than those analyzed, or from relatively slow biodegradation.
Buzzards Bay, Massachusetts surface sediments (17 m water depth) also contained high DFAA concentrations, near 50
vM,
which decreased gradually with depth to about 5 pM at 30 cm. Glutamic acid andbecoming relatively more abundant with depth in core. Repeated sampling of this station was carried out, and both the concentration and
compostion of DFAA in replicate samples was very similar. Sediments from the Pettaquamscutt River Estuary, Rhode Island (an anoxic basin), had low DFAA concentrations ranging from 2 to 6 1M. Glutamic and 6-aminoglutaric acids made up 30 to 50 % of the total.
Three cores of Gulf of Maine basin sediments had DFAA concentra-tions and composiconcentra-tions which were similar to each other and to Buzzards Bay sediments, except that glycine was a major constituent of some of the
samples. Its distribution was irregular over the less than 30 cm depth intervals sampled. Glycine is the major DFAA in the pools of many benthic invertebrates. Its presence in these cores is consistent with
independent evidence that Gulf of Maine basin sediments are extensively bioturbated.
Two cores of carbonate-rich sediments from the continental rise to the east of the Gulf of Maine and from the Bermuda rise had surface
sediment DFAA concentrations of 33 and 0.9 1M, respectively. Despite the large difference in concentration, compositions were very similar, with glycine and glutamic acid the major constituents. The very low concen-trations in the Bermuda Rise sediments may be related to very low
metabolizable organic carbon concentrations. Two nonprotein amino acids, y-aminobutyric acid and -alanine, were major constituents of the total hydrolyzable amino acids in the Bermuda Rise sediments.
Biological processes, specifically microbial, appear to be respon-sible for the major features of DFAA concentration and composition in the sediments studied. The concentrations of DFAA measured could be of significance to the nutrition of benthic organisms via transepidermal uptake or to the formation of humic substances in sediments, if these levels are found outside cells. However, as a sink for DFAA in sedi-ments, the latter two processes are slow relative to microbial uptake.
Thesis Supervisor: Dr. John W. Farrington Associate Scientist Chemistry Department
Woods Hole Oceanographic Institution Woods Hole, MA 02543
ACKNOWLEDGEMENTS
I thank Dr. John W. Farrington, my thesis supervisor, for five years of guidance and support without which this work would not have been possible. Drs. Cindy Lee, Fred Sayles, and Edward Boyle have served on my thesis committee and have provided valuable advice and helpful com-ments on this manuscript. Portions of this thesis were critically
reviewed by Dr. R. B. Gagosian.
Dr. Nelson Frew obtained the amino acid mass spectra. Dr. Zofia Mlodzinska performed most of the interstitial water ammonia, nitrate, and
nitrite analyses. Phil Clarner measured the total organic carbon and nitrogen in sediment samples. Dr. Roy Carpenter and Robert Anderson performed the Pb-210 analyses on Peru sediment samples. Dr. James Quinn allowed me to use his DOC analyzer, and Gary Mills provided instruction in its operation. Nancy Hayward and Carolyn Taylor provided conscien-tious assistance in the laboratory. Hovey Clifford, Dr. Arthur Gaines, Bruce Tripp, Jack Livramento, Dave Mason, and Dr. Stuart Wakeham assisted at various times with sampling. The officers and crew of the R/V Knorr and the R/V Oceanus, and Dick Colburn of the R/V Asterias, also con-tributed to the success of sampling operations.
The Office of Marine Geology, Atlantic-Gulf of Mexico Branch,
U.S.G.S. loaned the large sediment squeezer used to extract porewater for organic analysis.
Russell Cuhel contributed greatly to the work on the free amino acid composition of bacteria, providing culture material, advice, and
dis-cussion. Dr. Craig Taylor, Dr. John Hobbie, Freddy Valois, and Dr. Ned Ruby were also helpful.
Figures for this thesis were drafted by Graphic Services at WHOI. Christine Anderson provided invaluable advice on the idiosyncrasies of
the Wang Word Processor.
Financial support was provided by the Woods Hole Oceanographic Institution Education Office, the Paul M. Fye Fellowship, ONR Contract N00014-79-C-0071, and NSF Grant No. OCE 79-08665. Travel funds to Peru were provided by NSF Grant No. OCE 77-26180.
Finally, I thank my parents for supporting and encouraging my educa-tion for 21 years.
TABLE OF CONTENTS Page Chapter 1. Approval Page... Abstract ... Acknowledgements... Table of Contents... List of Figures... ... List of Tables... General Introduction... Dissolved organic carbon in interstitial water...
Specific organic compounds in interstitial water. Sources and sinks ... Organization of the thesis ...
Chapter 2. Methods ... Sampling ...
Amino acid analysis ... Other methods ... Reproducibility and sample storage... Comparison of squeezing with other
interstitial water sampling methods... Summary and conclusions ...
Chapter 3. Amino Acid Composition of
Several Marine Organisms and Bacteria.... Introduction...
Samples and methods... Resultsand discussion... Conclusions...
Chapter 4. Results from the Peru Upwelling Region ... Introduction... Results... Discussion... Summary of conclusions.. 77 83 113 136
Chapter 5. Results from Buzzards Bay and the
Pettaquamscutt River Estuary... Introduction ... Results ...
Discussion ... Summary of conclusions ...
Results frqm the Gulf of Maine
Northwestern Atlantic Continental Rise and Bermuda Rise ...
Introduction ... Results ... Discussion ... ... Summary of conclusions ...
Chapter 7. Summary and Concluding Remarks... References ... Appendix I. Amino Acid Abbreviations... Appendix II. Data Used in Preparing Figures... Biographical Note ... 138 138 140 163 189 191 191 195 219 225 227 231 244 245 253 Chapter 6.
LIST OF FIGURES
Figure Page
1-1. Schematic of sources and sinks for organic substances
in interstitial water... 24
2-1. Glass capillary gas chromatogram of the (N,O)-heptafluorobutyryl n-butyl ester derivatives of a mixed amino acid standard... 36
3-1. Mass spectrum of e-aminoglutaric acid from Chromobacterium... 72
4-1. R/V Knorr 73-2 station locations... 79
4-2. Dissolved oxygen section running west from the Peru coast near 150S... 81
4-3. Composition of total hydrolyzable amino acids in Peru Upwelling Region sediments... 87
4-4a. Ammonia, total carbon dioxide, nitrate, nitrite, and sulfide concentrations in Station 4 interstitial water... 91
4-4b. Ammonia, total carbon dioxide, nitrate, nitrite, and sulfide concentrations in Station 5A interstitial water... 93
4-4c. Ammonia, total carbon dioxide, and sulfide concentrations in Station 6 interstitial water... 95
4-4d. Ammonia, total carbon dioxide, nitrate, and nitrite concentrations in interstitial water from Station 8... 97
4-4e. Ammonia, total carbon dioxide, and nitrate concentrations in interstitial water from Station 2A... 97
4-5a. Dissolved free amino acids in Station 4 sediments... 101
4-5b. Dissolved free amino acids in Station 5A sediments... 103
4-5c. Dissolved free amino acids in Station 6 sediments... 105
4-5d. Dissolved free amino acids in Station 8 sediments... 107
4-5e. Dissolved free amino acids in Station 2A sediments... 107
4-6. Dissolved B-aminoglutaric acid/glutamic acid ratio vs. depth in core in Peru Upwelling Region sediments... 110
5-1. Composition of total hydrolyzable amino acids in Buzzards
Bay and Pettaquamscutt River Estuary sediments... 143 5-2. Buzzards Bay, Station P interstitial water ammonia
concentrations... 147 5-3. Buzzards Bay, Station P interstitial water total
carbon dioxide concentrations... 149 5-4. Pettaquamscutt River Estuary ammonia and total
carbon dioxide concentrations... 152 5-5. Dissolved free amino acid concentrations in Buzzards
Bay sediments sampled on 6/26/79... 154 5-6. Dissolved free amino acid concentrations in Buzzards
Bay sediments sampled on 12/5/79... 156 5-7. Dissolved free amino acid concentrations in Pettaquamscutt
River Estuary sediments... 158 5-8. Dissolved $-aminoglutaric acid/glutamic acid ratio vs.
depth in sediment... 161 5-9. Chemical ionization mass spectrum of -aminoglutaric
acid from an interstitial water sample. ... 175 5-10. Electron-impact ionization mass spectrum of -aminoglutaric
acid from an interstitial water sample. ... 177 6-1. Station locations, Knorr 69-1 and Oceanus 74... 192 6-2. Interstitial water ammonia concentrations, Knorr 69-1... 197 6-3a. Mass spectrum of $-alanine from BR3, 30-36 cm total
hydrolyzable amino acids... 205 6-3b. Mass spectrum of Y-aminobutyric acid from BR3, 30-36 cm
total bydrolyzable amino acids... 207 6-4a. Dissolved free amino acid concentrations in GM3 sediments.... 209 6-4b. Dissolved free amino acid concentrations in GM4 sediments.... 211 6-4c. Dissolved free amino acid concentrations in GM8 sediments
and NA O0 sediments... 213 6-5. Free -aminoglutaric acid/glutamic acid ratio vs.
LIST OF TABLES
Table Page
2-1. Recoveries of amino acids from cation exchange
chromatography... 31
2-2. Relative molar response factors for (N,O)-heptafluorobutyryl n-butyl esters... 38
2-3. Blanks (Oceanus 74)... 40
2-4. Amino acid concentrations in re-hydrolyzed sediment... 43
2-5. Reproducibility of squeezing... 46
2-6. Effect of sample storage after squeezing... 48
2-7. Effect of prolonged sample storage after squeezing... 49
2 8. Comparison of water extractions with squeezing... 52
2-9. Recovery of spikes from water extracts... 55
2 10. Comparison of centrifugation with squeezing... 58
2-11. In situ sampler total dissolved free amino acid concentrations... 61
3-1. Dissolved free amino acid and protein composition of two benthic invertebrates... 68
3-2. Free amino acid pool composition of some marine bacteria... 70
3-3. Composition of insoluble bacterial protein... 74
3-4. Free amino acid pool composition of fermenting bacteria from Pettaquamscutt River Estuary sediment... 75
4-1. Sediment composition data for samples collected during Knorr 73-2... 84
4-2. Bottom water composition... 100
4-3. Calculated remineralization rates... 100
5-1. Composition of sediments from Buzzards Bay and the Pettaquamscutt River... 141
5-3. Results of remineralization rate calculations... 164
5-4. Adsorption of amino acids by Buzzards Bay sediments... 185
5-5. Comparison of Freundlich and Langmuir isotherms... 186
6-1. Composition of sediments from the Gulf of Maine... 196
6-2. Composition of Bermuda Rise sediments and interstitial water... 200
6-3. Composition of Gulf of Maine total hydrolyzable amino acids... 202
6-4. Total hydrolyzable amino acid composition of Bermuda Rise sediments... 203
6-5. Dissolved free amino acid composition of Gulf of Maine sediments... 215
CHAPTER 1: GENERAL INTRODUCTION
Near-surface sediments are a zone of transition and interaction between the water column and the permanent deposit. The non-equilibrium association of organic matter, mineral particles, and seawater results in early diagenetic reactions, which are often biologically mediated (Berner,
1976a). Briefly, organic matter deposited to the sediment-water interface is utilized as an energy source by benthic organisms. Organisms can
remineralize the organic matter, use it to synthesize new cell components, or excrete it in solid or soluble form. The incorporated and excreted
organic matter may be ingested repeatedly; ultimately only a small propor-tion of the total supplied to the sediment-water interface is buried
(Rhoads, 1974). The soluble products may return to the water column via diffusion, precipitate in various mineral phases, or interact with detri-tal minerals via adsorption or ion exchange. Further geochemical reac-tions result from changes in acidity and redox potential in sediments due to the oxidation of organic matter (Price, 1976).
Study of the decomposition and transformation of organic matter in near-surface sediments is thus central to understanding the process of early diagenesis. However, the extreme complexity and heterogeneity of marine organic matter (Blumer, 1975) has hampered investigations of pro-cesses affecting it in sediments. Measurements of total organic content give only the net result of a variety of reactions occurring at different
environ-ment. Measurements of individual organic compounds or compound classes can provide specific information on processes affecting a small proportion of the organic matter, and can be used to trace certain reactions
affecting the bulk of organic matter (Andersen, 1977; Degens and Mopper, 1976). A complication, though, is suggested by the work of Johnson (1974) who found at least 18 types of organic-mineral particle associations in an estuarine sediment. Each of the particle types could represent one or more microenvironments with different conditions for the transformation of organic matter. For example, Thompson and Eglinton (1978) have found different concentrations and compositions of fatty acids and hydrocarbons
in different particle-size fractions of a Recent sediment. It has been shown, using several extraction methods to release sterols and fatty acids from sediments, that differences in chemical accessibility can be related to difterences in diagenetic behavior (Lee et al., 1977; Farrington et al., 1977a). Amino acid racemization rates in sediments depend on
physiochemical parameters such as temperature, catalysis by certain metal ions, whether the amino acid is free or peptide bound, and on the
structure of the particular compound (Schroeder and Bada, 1976).
This thesis describes a study of dissolved free amino acids in Recent sediments. This study was undertaken in order to improve our
under-standing of the diagnenesis of organic matter in near-surface sediments, a process which includes remineralization and transformation of biosyn-thesized organic compounds to the relatively complex, poorly-defined organic matter in sediments. Amino acids have been chosen as the primary
subject of this study because, in peptide-bound form, they are major constituents of both organisms and sediment organic matter; the range of structure within the amino acid compound class provides individual com-pounds with potential as source markers and a range of chemical and biochemical activity; and the literature on the geochemistry of amino acids indicates that they undergo significant diagenesis in near-surface
sediments (Schroeder and Bada, 1976; Kvenvolden, 1975).
Interstitial water was chosen as a sediment subenvironment of par-ticular interest, since variations in pore water composition are very sensitive indicators of chemical and biological reactions in sediment.
- - + 2- 2- C 2+ 2+ 2+
3-Analyses of 022 NO'3 NO2, NH 4 SO , S , HCO3) CH 4 Ca , Fe , Mn , and PO 4,
for example, have shown large concentration gradients between bottom water and interstitial water which are directly or indirectly the result of the microbial decomposition of organic matter (Berner, 1976a). Solu-ble organic compounds are also released during bacterial decomposition of organic matter (Doelle, 1975); and, by analogy to the above biologically active inorganic substances, inputs of organic compounds to pore waters
should be present. However, there have been only a few previous measure-ments of organic substances dissolved in interstitial water.
Dissolved Organic Carbon in Interstitial Water
Starikova (1970) measured dissolved organic carbon (DOC) in inter-stitial water of marine sediments from the Pacific and Indian Oceans, the Black Sea, and the Sea of Azov. Interstitial water of surface sediments
from these regions, including even Pacific red clays and carbonate oozes containing only 0.1 to 0.3 % total organic carbon (TOC), were enriched ten times in DOC with respect to the overlying seawater, with measured concentrations in the range 5 to 10 mgC/L. No consistent trend with depth was observed in oxidizing sediments. However, in reducing sed-iments DOC increased with depth to concentrations of 20 to 60 mgC/L at 3 to 6 m.
Krom and Sholkovitz (1977) measured DOC and molecular weight frac-tions in pore water of organic-rich sediments from Loch Duich, Scotland, a fjord-type estuary. In two cores of oxidizing sediments, 40 to 60 cm in length, DOC remained fairly constant with depth at 8 to 16 mgC/L, about twice the concentration in overlying seawater. DOC in three cores of anoxic sediment increased linearly with depth from an average of 14 mgC/L at the surface to 56 to 71 mgC/L at 80 cm. The low molecular weight (<1000 a.m.u.) fraction was approximately constant with depth at
10 mgC/L in both oxidizing and reducing sediments. The high molecular
weight fraction increased with depth only in the anoxic sediments.
Nissenbaum et al. (1972) measured DOC in the pore waters of sediment from Saanich Inlet, an anoxic fjord on the coast of Vancouver Island. They found very high concentrations, ranging from 50 to 150 mgC/L. From 5 to 30 % of this material consisted of a high molecular weight polymer.
DOC concentrations tended to increase with depth. Martens and Goldhaber
(1978) found DOC concentrations ranging from 50 to 150 mgC/L in inter-stitial water from sediments of the White Oak River Estuary, North
water salinity, total sediment organic content, or depth in core.
DOC in sediment pore waters from the Florida Everglades and Mobile
Bay was measured by Lindberg and Harriss (1974). The seven cores of Everglades sediment were extremely high in TOM (20 to 80 %), with DOC ranging from 20 to 70 mgC/L. DOC was essentially constant with depth. Mobile Bay sediments had lower TOM (5 to 20 %) and DOC (6 to 10 mgC/L), and again no trend with depth was observed. About 60 % of the DOC in the Everglades samples had a molecular weight of less than 500, but in Mobile Bay 70 % of the pore water DOC had a molecular weight of greater than
100,000.
Other than those by Starikova (1970), there have been few measure-ments of DOC in deep-sea sedimeasure-ments. Karl, et al. (1976) found 2 mgC/L in
surface sediments from the Nares Abyssal Plain, decreasing to 0.7 mgC/L at 16 cm. Suess (1976) found that DOC increased with depth from 2 to 6 mgC/L in an 80 cm core from the central Pacific.
These data indicate that DOC is substantially enriched in inter-stitial water with respect to overlying seawater. Thus some process(es) in sediments must be supplying-soluble organic compounds to pore waters. The data also indicate that rates and/or processes of supply and removal vary in different sedimentary enviroments, resulting in different con-centrations, depth distributions, and molecular weights of organic
matter. However, measurement of a complex, heterogeneous mixture such as
DOC can provide only limited information on the specific processes
Specific Organic Compounds in Interstitial Water
A few studies of specific organic compounds or compound classes in interstitial waters have been done. Dissolved free amino acids in pore waters of Georgia salt marsh sediments were measured by Gardner and
Hanson (1979). Concentrations ranged from less than 100 nM up to 7500 nM in vegetative sediments made up largely of Spartina alterniflora roots and detritus. Pore water amino acid concentrations in non-vegetative
surface sediments (from a mud flat and creek bank) were 1014 and 442 nM respectively. Glutamic acid, alanine, and an unknown ninhydrin-positive compound were the most abundant amino acids.
Jorgensen et al. (in preparation) found dissolved free amino acid concentrations ranging from 2 to 20 vM in four intertidal sediments from Limfjorden, Denmark. Glutamic acid (especially in anoxic sediments),
serine, glycine, and leucine were the most abundant amino acids. Close resemblance of the amino acid composition of interstitial water and overlying seawater at some locations suggested diffusion from sediments was a source of free amino acids to the water column.
Starikova and Korzhikova (.1972) analyzed amino acids in pore waters of reducing surface sediments from the Black Sea. Using paper chroma-tography, they found from 1290 to 6000 pg total hydrolyzable amino acids/L, an average of 12 times the concentration in Black Sea water. The amino acid compostion was similar to that found in sediment.
Nissenbaum et al. (1972) investigated the compostion of high molecu-lar weight material dissolved in interstitial water from Saanich Inlet. The polymer contained large quantities of amino acids (more than 35 %)
which were released by 6N HC1 hydrolysis. The presence of non-protein amino acids suggested that at least some of the material was of bacterial origin. Non-protein amino acids were also found in interstitial water
from Lake Ontario sediments by Kemp and Mudrochova (1973). They made up only a few per cent of the total dissolved amino acids, however, which were present at concentrations of 7 pg/g (free) and 36 Pg/g
(hydro-lyzable).
Jorgensen (1979) found 16 to 56 ~M dissolved free primary amines (by fluorescamine assay) in sediments from Kysing Fjord (Jutland). Concen-trations varied with depth in sediment and seasonally, with concentration maxima associated with the redox discontinuity layer. Stephens (1975) and Stephens et al. (1978) also measured dissolved free primary amines in pore waters and found concentrations in the range of 10 to 100 PM. Ho and Lane (1973) found 3 to 10 mgN/L dissolved free a-amino acid nitrogen
in organic-rich, highly reducing sediments from the Barataria Bay (Louisiana) system.
Specific organic compounds other than amino acids have been even less frequently measured in interstitial water. Lyons et al. (1979) found 0.2 to 10 mg/L dissolved carbohydrate and from less than 1 to 9 mg/L dis-solved humic substances in pore waters of nearshore Bermuda carbonate sediments, where DOC ranged from 4 to 19 mgC/L. A decrease in carbo-hydrate concentrations with depth was attributed to microbial utiliza-tion. Romankevich and Urbanovich (1971) measured dissolved carbohydrates in interstitial water from the Peru Upwelling Region using the
than 1000 to more than 4000 pg/L. Interstitial water carbohydrate concentrations decreased with overlying water column depth.
Aliphatic hydrocarbons and fatty acids were enriched 2 to 160 times in interstitial waters of surface sediments from the Cariaco Trench, Demerara plain, and Amazon River cone relative to seawater (Saliot and
Tissier, 1978). Barcelona et al. (1980) measured 150 pM C to C
5
volatile organic acids in a surface sediment pore water sample from the Newport Canyon (California).
Like the available information on DOC in interstitial waters, the data on specific organic compounds suggest that biogeochemical processes in near-surface sediments are a net source of soluble organic
sub-stances. However, the data are limited both in number of analyses and geographic coverage. Because of varied sampling and analytical methods, it is difficult to compare results of different workers. Further, the distribution of dissolved organic compounds in seawater results from complex interactions between biological sources and sinks (Andersen,
1977). Thus, an understanding of the distribution of dissolved organic compounds in interstitial water probably requires knowledge of the chemical, biological, and physical characteristics of the sedimentary environment. Although some efforts have been made in this direction
(e.g. Krom and Sholkovitz, 1977), the available dissolved organic concentration data are not usually part of a systematic study of the
Sources and Sinks
Five areas of research suggesting processes which might act as sources or sinks for dissolved organic compounds in sediments are:
(1) Biological cycling of organic matter.
(2) Transepidermal uptake of dissolved organic compounds by soft-bodied benthic organisms.
(3) Sorption of organic compounds by clay mineral and other sediment components.
(4) Melanoidin formation or the "humification" reaction. (5) Physical transport via diffusion and bioturbation. These processes will be discussed below.
Sources of dissolved organic compounds in seawater include extra-cellular release of photosynthetic products by plankton, decomposition of detritus by bacteria, and excretion by zooplankton (Whittle, 1977). The dissolved compounds may be taken up by heterotrophic bacteria and
decomposed to inorganic nutrients or used to synthesize cellular material which provides food for higher heterotrophs (Gagosian and Lee, 1980). Several studies (Crawford et al., 1974; Andrews and Williams, 1971; Lee and Bada, 1977; Wright, 1978) provide evidence that turnover rates for simple monomers such as amino acids and glucose are very rapid in
estuarine and open ocean surface waters, in the range of 10 to 100 % per day. A parallel for the seawater cycle, involving decomposition of organic detritus by bacteria and benthos to release soluble organics, uptake and decomposition or incorporation by bacteria, and ingestion of bacterial cells by benthos, can be hypothesized. The actual importance
and rates of these processes in sediments is not well-known. Some
attempts have been made to measure the turnover rates of free amino acids in salt marsh, estuarine, and lake sediments using radiolabelled
substrates. A range of turnover times, from less than one hour (Harrison et al., 1971; Christensen and Blackburn, in press; Henrichs et al., in preparation) to several days (Hanson and Gardner, 1978) have been measured. Both differences in methodology and differences in the sediments studied probably contribute to the range of values. The
observed uptake of radiolabelled amino acids has been largely attributed to microbial activity, although other processes may have been significant.
One potentially important sink for dissolved organic compounds in pore water which has received considerable attention is trans-epidermal uptake by benthic invertebrates. Using radiolabelled substrates, uptake of amino acids (primary amines), glucose, and/or fatty acids has been demonstrated in polychaete worms, echinoderms, and pogonophores
(Ferguson, 1971; Southward and Southward, 1972; Stephens, 1975). Because the concentrations of these compounds in natural habitats is not well-known and because the uptake has most often been studied on isolated organisms in aquaria, the rate of uptake in sediments and the signifi-cance of this process to the overall nutrition of the organisms is uncertain.
Adsorption by clays and other sediment minerals could also affect dissolved organic distributions. Free amino acids and sugars are
adsorbed by kaolinite and montmorillonite clays to the extent of only a few per cent of the total in solution at seawater concentrations ranging
from 10- 3 to 10 mg/L (Hedges, 1977). Fatty acids., however, are
strongly adsorbed from saline solutions by a variety of clay minerals, although the presence of other dissolved organic compounds decreased
adsorption (Meyers and Quinn, 1973). Carter (1978) found that quartz and calcite were weak adsorbers of fulvic acids, taking up a few per cent or less from distilled water solutions at concentrations of 5 to 500 mgC/L. Clay-mineral adsorption of melanoidin-type polymers (formed by reacting free amino acids and sugars) was strongly dependent on their composition (Hedges, 1978). Basic polymers (formed from lysine and glucose) were quantitatively sorbed by montmorillonite from 10 to 1000 mg/L solutions, while neutral (valine) and acidic (glutamic acid) polymers were about
10 % and 2 % adsorbed, respectively. These results, although they apply
strictly only to artificial systems, suggest that both solubility and specific organic-mineral and organic-organic interactions may be impor-tant to determining the amount of adsorption in natural sediments.
Humic substances, organic polymers of complex, ill-defined structure, make up much of the organic matter in seawater and marine sediments.
Nissenbaum (1974) has proposed a pathway for the formation of humic substances which involves a Maillard-type condensation of amino acids with reducing sugars to give soluble products. These polymers undergo
further condensation, dehydration, cyclization, elimination of labile functional groups, and aromatization to form insoluble, macromolecular products. This process could be a sink for labile dissolved organic com-pounds in sediments. Laboratory studies support the potential signifi-cance of this reaction. Hedges (1978) reacted various combinations of
0.01 M solutions of glucose, lysine, valine, and glutamic acid at 800 C
for 20 hours, and found that the melanoidin polymers formed strongly resembled natural humic substances. The basic amino acid lysine reacted with glucose at a much greater rate than glutamic acid or the neutral amino acid valine. Abelson and Hare (1971) found that marine kerogens and humic acids took up amino acids when reacted with dilute solutions
(0.1 mM). Again, dibasic amino acids were the most reactive, with 90 to
100 % uptake by most of the macromolecular substances investigated.
Transport along concentration gradients via diffusion and bioturba-tion has been shown to be important to the distribubioturba-tion of solutes in interstitial water, especially near the sediment-water interface. The concentration profiles and fluxes of substances dissolved in interstitial water have been modelled (eg. Lasaga and Holland, 1976; Berner, 1976b; Schinck and Guinasso, 1977). In thoroughly studied environments, these models can be used to quantify specific sources and sinks, and have been applied to calculations of remineralization rates from pore water alka-linity, sulfate, and ammonia profiles (Murray et al., 1978; Goldhaber et al., 1977).
Figure 1-1 summarizes the discussion of processes which may influence the distribution of dissolved organic substances in sediments. Although the complexity of this picture is cautionary, it also indicates the potential of careful study of dissolved organic substances in sediments for improving our understanding of several aspects of the sedimentary carbon cycle.
Figure 1-1: Schematic of sources and sinks for organic substances in interstitial water.
Organization of the Thesis
Chapter 1 has been a general introduction to the subject of this thesis and a review of previous work in the area of dissolved organic matter in interstitial water. Chapter 2 will discuss sampling and analytical methods used in the collection of data for this thesis. Particular attention will be given to methods of pore water extraction and their effects on dissolved free amino acid reservoirs in sediments.
Chapters 4, 5, and 6 will present data on the distribution of dissolved free amino acids (DFAA) in sediments from the Peru Upwelling Region, Buzzards Bay, the Pettaquamscutt River Estuary, the Gulf of Maine, and the Northwestern Atlantic. These sediments represent a wide range of environments, from water column depths of 10 to 5000 m, total organic carbon contents of 0.1 % to 20 %, and oxidizing to reducing conditions. These environments have been characterized by collection of data on DOC, TOC, TN (total nitrogen), THAA (total hydrolyzable amino
acids), and pore-water dissolved remineralization products. Variations of DFAA concentration and composition with depth in sediment and sedi-mentary environment, and specific relationships between DFAA and certain
environmental characteristics, will be used to identify probable sources and sinks.
Chapter 7 will summarize the most important results of this re-search. Data used in the preparation of figures will be given in an Appendix.
CHAPTER 2: METHODS
Sampling Coring:
No one corer was available or suitable for sampling at all loca-tions. The coring devices used in this work are listed below:
(1) Gulf of Maine, Knorr 69-1: Sandia-Hessler Type MK3 (Oceanic
Instruments, San Diego, CA), 0.25 m2
X 30 cm box corer.
(2) Peru Upwelling Region, Knorr 73-2: Soutar box corer, 0.1 2
m X 1 m, Stations 4, 5A, and 6; Sandia-Hessler Type MK3, Stations 8 and 2A.
(3) Buzzards Bay, Station P, 6/26/79: Sphincter corer (Burke, 2
1968), 0.03 m X 1 m; van Veen-type grab sampler.
(4) Pettaquamscutt River Estuary: Hand-driven plastic core 2
liner, 40 cm X 1 m.
(5) Bermuda Rise, Oceanus 74: Gravity corer, 40 cm2 X 1.5 m.
(6) Buzzards Bay Station P, 12/5/79: Soutar corer, van Veen grab. (7) Buzzards Bay, Station BBBC: Diver-emplaced BEB-corer, 0.02 2
m X 30 cm.
(8) Great Harbor, Woods Hole: Diver-emplaced BEB-corer.
The length dimensions given are the maximum which could be obtained with a particular corer.
The Sandia-Hessler Type MK3 corer is a slow-entry type which re-covered a relatively undisturbed sample of surface sediments. The large
volume of sediment allowed sectioning at 2 cm intervals. The Soutar box corer also retrieved an intact surface sediment sample. Sectioning
intervals were controlled by the width of removable plates along the box. The sphincter corer produced dome-shaped distortion of
unconsolidated surface sediments. The small-cross section Pettaquamscutt River Estuary and Bermuda Rise cores required 6-cm sectioning intervals
to obtain sufficient sample for analysis. The BEB-corer is a
diver-operated device which recovered an undisturbed surface sediment sample.
All cores were sectioned immediately after recovery with the excep-tion of the Pettaquamscutt River core which was stored overnight at
1000C prior to sectioning. Sediment samples were placed in clean glass
jars and stored at 20C until-squeezed (usually within 24 hours). Squeezing:
Squeezing of sediments for organic analysis was carried out in a hydraulically-powered, stainless steel squeezer at about 2000 p.s.i. The portions of this apparatus which contacted the sample were carefully cleaned to eliminate possible contamination. The pore water sample passed through two internal Reeve Angel(R ) glass fiber filters (precom-busted at 4500C for 24 hours to eliminate organic matter) and then passed through an external precombusted Gelman Type A(R ) glass fiber
filter. Filtered pore water was collected in clean glass bottles and refrigerated at 20C prior to cation exchange chromatography.
Pore water for inorganic analysis was obtained using a hydrau-lically-powered squeezer constructed of Delrin and polycarbonate. The
pore water passed through internal Whatman #42 or #541 ashless cellulose filters and was refiltered through 0.4 V Millipore or Gelman membrane filters.
Amino Acid Analysis
Glass capillary gas chromatography (GCGC) was used to determine the amino acid concentrations and compositions of the samples analyzed for this thesis. This method involves three steps:
(1) Separation of amino acids from interfering organic and
inor-ganic substances in the sample by cation-exchange chromatography. (2) Derivatization of the free amino acids to form the volatile (N,0)-heptafluorobutyryl n-butyl esters.
(3) GCGC of the amino acid derivatives.
Gas chromatography has seen some application in the measurement of amino acids in geological materials, especially for the determination of enan-tiomer ratios (Kvenvolden, 1975). But ion-exchange or reverse phase high performance liquid chromatography, with post-column formation of nin-hydrin or fluorescent derivatives for detection, has been more frequently
used than GCGC in recent studies of amino acids in seawater and sediments (e.g. Lee and Bada, 1977; Schroeder and Bada, 1976; Dawson and Pritchard, 1978; Garrasi et al., 1979). A recently developed method employing
pre-column formation of fluorescent derivatives and high performance liquid chromatography for the separation of amino acids offers the advan-tage that step (1) can be eliminated, since seawater samples can be used
directly (Lindroth and Mopper, 1979). However, GCGC can be readily in-terfaced with mass spectrometry, allowing the identification of unknown chromatographic peaks which are all-too-frequently present in environ-mental samples. It will be shown that the necessary clean-up and
deriva-tization procedures do not compromise the GCGC analytical results. Cation Exchange Chromatography:
Free amino acids were isolated from the sample matrix (interstitial water, sediment hydrolyzate, etc.) via cation-exchange chromatography on a 15 to 20 cm3 BioRad(R ) AG 50W-X8 (50 to 100 mesh) resin column
(procedure similar to Degens and Reuter, 1963). The resin was brought to +
the H form by eluting with 20 ml of 6N HCI and washing out the excess acid with water. Typically, a 10 to 25 ml sample was spiked with an internal standard (usually norleucine) and applied to the column. The column was then eluted with 20 ml H20 and about 20 ml of 1.5 to 2.0 N NH OH, until the base front (identified by a warm zone) just reached the bottom of the column. The first 70 ml of basic eluate, containing the amino acids, were collected, evaporated to dryness on a Buchi
all-glass rotary evaporator at 400C, and the residue redissolved in 0.1 N HC1 to a final concentration in the range of 0.01 to 1
pM.
Recoveries of amino acids from the cation exchange chromatography were checked by dissolving known amounts of 25 protein and nonprotein amino acids in 10 ml seawater with very low indigenous amino acid con-tent. Total amino acid concentrations used were 16, 32, 80, and 160 PM, with individual components at about 0.6, 1.3, 3.2, and 6.4 -M. Recov-eries of nearly all amino acids was good (greater than 80 %) and
repro-TABLE 2-1
Recoveries of Amino Acids from Cation Exchange Chromatography
Amino Acid % Recovery from % Recovery from
Seawater Distilled Water
alaa 114 (15)b 106 (5) gly 98 (20) 95 (3) a-aba 101 (3) 104 (6) val 106 (12) 105 (5) thr 97 (7) 100 (7) ser 98 (6) 91 (2) leu 92 (10) 96 (0.5) ile 94 (10) 97 (2) norleu 89 (9) --- c Y-aba 100 (14) 92 (7) pro 99 (10) 92 (3) hypro 111 (9) 89 (2) daba 75 (3) 82 (5) met 73 (31) 93 (4) asp 104 (12) 104(11) phe 83 (11) 81 (3) orn 81 (13) 82 (7) glu 106 (12) 92 (9) S-glu 108 (18) 88 (6) lys 59 (17) 80 (6)e tyr 0d 80 (6)e a-aaa 100 (5) 87 (10) tryp 0 11 (8) dapa 116 (15) 87 (10) cys 23 (17) 78 (10)
aSee Appendix I for explanation of amino acid abbreviations. bStandard deviation or four runs: see text.
cInternal standard.
dVery small peak, not resolved from lysine.
eLysine and tyrosine were not resolved. Recovery reported is for sum of two peaks (i.e. the average recovery).
ducible (Table 2-1, col. 1). Recovery of basic amino acids (diamino-butyric acid. ornithine, lysine) was slightly lower than average.
Sulfur-containing amino acids (methionine and cystine) were poorly recov-ered at 0.6 pM, but their recoveries increased with concentration (from
36 to 98 % and from 0 to 48 %, respectively). Tyrosine recovery was low and variable, and tryptophan was not recovered. However, a similar experiment (in quadruplicate) with a 20 pM amino acid solution in
distilled water gave good recoveries of tyrosine, methionine, and cystine (Table 2-1, col. 2). Cation exchange recoveries for samples were moni-tored by comparing internal standards (generally norleucine and nor-valine) added before and after column chromatography.
Derivatization:
Prior to gas chromatography, free amino acids must be converted into less polar, more volatile compounds by derivatization of the carboxylic acid and amino functions. A wide variety of derivatization methods have been developed for' this purpose (Husek and Macek, 1975). Esterification of the carboxylic acid and subsequent acylation of the amino (and any hydroxyl) groups has been extensively investigated by Gehrke and
co-workers (Roach and Gehrke, 1969). This appears to be the most satis-factory method available in terms of stability and chromatographic
characteristics of the derivative. In this work, the (N,0)-heptafluoro-butyryl n-butyl esters (HFBBE) have been used. These compounds are more stable with respect to hydrolysis, less volatile (which minimizes evapor-ative losses during workup), and less polar than the corresponding
The following derivatization procedure has been optimized to give maximum and reproducible yields:
(1) An aliquot of the 0.1 N HC solution of amino acids
recov-ered from cation exchange chromatography, containing approximately 0.01 to 1.0 Vmole total amino acids, is placed in a 1 ml Reac-tivial(R ) (Pierce) and the solution evaporated to dryness at
100 C under an N2 stream. CH2C12 (0.2 ml) is added and
evap-orated to azeotrope any remaining water.
(2) After the vial has cooled to room temperature, 0.2 ml 3N HC1 in n-butanol (Regis) and 0.05 ml CH2Cl2 are added. The vial is
sealed with a Teflon-lined screw cap, sonicated for 15 minutes to aid solution of the amino acids, and then heated to 1100
C for 30
minutes. Excess reagent is evaporated at 60 to 7000 under an N
2
222
stream until about 0.01 ml remains, 0.2 ml of CH2C12 is added,
and the solution is evaporated to dryness at room temperature under an N2 stream.
(3) 0.1 ml of 20 % v/v heptafluorobutyric anhydride (Pierce or Regis) in acetonitrile is added, and the solution heated at 11000 for 15 minutes.
(4) After the vials have cooled to room temperature, excess reagent is evaporated under an N2 stream. When dry the vials are immediately sealed with septum screw caps. The HFBBE derivatives are dissolved in CH2Cl2 for GCGC analysis. Samples are withdrawn
through the septum to prevent exposure to atmospheric moisture and oxygen.
(5) Reagent-grade CH2Cl2 and acetonitrile must be
redis-tilled from anhydrous CaCI2 to remove water and stored in a desic-cator. Heptafluorobutyric anhydride and 3 N HC1 in n-butanol are used as received from the suppliers noted. N2 was prepurified
grade.
(6) HFBBE derivatives are stable for about a month except for those of serine, tyrosine, and methionine which decompose in about one week.
Glass Capillary Gas Chromatography
Gas chromatographic analyses were carried out on a 32 m X 0.3 mm i.d. SE-54 or a 20 m X 0.3 mm i.d. SE-52 glass capillary column (Grob et al., 1978; Grob et al., 1979) installed in an HP 5840 gas chromatograph
equipped with a splitless injector and a flame ionization detector. Run parameters were varied to optimize resolution. Typical values were: injector temperature 2500C; initial column temperature 400C;
temperature program 300C/min to 700C and then at between 20C/min and 40C/min to 2500C; He flow 1 to 3 ml/min; FID temperature 2500C. Under these GCGC conditions and using the derivatization procedure described above, cysteine and histidine gave no peak on the chromatogram, and the arginine peak was highly variable. These amino acids were not measured in this study. Aspargine and glutamine are esterified during the derivatization procedure and thus were not distinguished from aspartic and glutamic acids respectively. The
remaining protein amino acids, and several nonprotein amino acids, can be measured with good accuracy and precision. a-Alanine/valine and
lysine/tyrosine were not always resolved, and are reported together in some cases. A typical GCGC of a mixed amino acid standard is shown in Figure 2-1. When resolution of amino acid enantiomers was desired, a Chirasil-Val(R) (N-propyl L-valine t-butylamide polysiloxane) coated, 25 m X 0.3 mm i.d. glass capillary column (Applied Science Laboratories) was used.
Table 2-2 shows typical relative molar response factors (RIRF) for 25 amino acids relative to norleucine (col. 1). Relative standard devia-tions (col. 2) are for derivatization and GCGC analysis of 4 subsamples
(1.6
pmoles
each) of a mixed amino acid standard solution and average about 5 %. The relative error due to GCGC alone (including automatic peak integration) determined from four replicate injections of a single derivatization, is 1 to 5 % (col. 3). As expected, the RMRF are pri-marily a function of the number of carbon atoms in the molecule (but with negligible contribution from flourinated carbon). It was found that a"hot needle" injection technique (Grob and Grob, 1979) increased relative response and precision for amino acids eluting after ornithine. GCGC RMRF were checked periodically, but varied only slightly (10% to 20%), mostly for the less stable derivatives of serine, methionine, and
tyrosine.
The linearity of the derivatization and GCGC analysis over the con-centration range encountered was also checked. Derivatization of 0.16, 1.6, 8.0, and 16 pmoles total amino acids (approximately 8, 80, 400, and 800 nmoles/component) was carried out. The mean and relative standard deviation of the RMIRF are given in columns 4 and 5 of Table 2-2. No
Figure 2-1: Glass capillary gas chromatogram of the
(N,O)-heptaflurobutyryl n-butyl ester derivatives of a mixed amino acid standard. In order, from the arrow, the major peaks are: alanine, glycine, a-aminobutyric acid, valine, threonine, norvaline, serine, leucine, isoleucine, norleucine,
y-aminobutyric acid, proline, hydroxyproline, diaminobutyric acid, methionine, aspartic acid, phenylalanine, ornithine, glutamic acid, -aminoglutaric acid, lysine, tyrosine,
a-aminoadipic acid, tryptophan, diaminopimelic acid, and cystine. Conditions are given in the text.
TABLE 2-2
Relative Molar Response Factors
for (N,0)-Heptafluorobutyryl n-butyl estersa
Amino Acid RMRFb RSD (%)c RSD (%)d RMRFe RSD (%)
ala 0.705 7.0 1.4 0.635 10.0 gly 0.623 5.5 1.1 0.571 3.7 a-aba 0.850 5.2 0.96 0.811 7.9 val 0.952 4.5 0.85 0.914 8.3 thr 0.959 5.0 0.80 0.923 4.6 norval 1.01 5.2 2.0 1.04f 11.5 ser 0.867 4.8 1.1 0.693 4.5 leu 1.10 3.8 1.2 1.06 2.0 ile 1.09 5.0 1.0 1.06 3.4 norleu 1.00 --- --- 1.00 ---Y-aba 0.735 4.4 4.7 0.714 11.2 pro 0.963 3.4 1.2 0.894 4.6 hypro 1.08 4.6 0.60 1.02 9.9 daba 0.813 4.7 2.4 0.784 10.5 met 0.492 7.4 2.0 0.606 13.7 asp 1.10 4.1 1.5 1.12 5.5 phe 1.41 4.4 1.1 1.22 9.8 orn 0.986 6.1 3.6 0.956 8.4 glu 1.21 4.3 3.5 1.13 6.2 -glu 1.23 4.9 6.0 1.07 7.9 lys 1.09 5.2 4.1 1.08 8.6 tyr 1.19 4.5 4.2 1.00 8.6 a-aaa 1.20 4.9 3.1 1.11 7.7 tryp 1.03 4.4 3.8 0.743 4.2 dapa 0.581 6.9 5.8 0.549 4.5 cys 0.757 10.1 9.2 0.750 3.7 aRelative to norleucine.
bAverage of four derivatizations of 1.6
pmoles
mixed standard solution. cRelative standard deviation, derivatization + GCGC.dRelative standard deviation, GCGC only (four runs).
eRelative molar response factor for derivatizations of 0.16, 1.6, 8.0, and 16 pmoles mixed amino acid standard.
trend with concentration was observed. Also, solutions containing 7.9 nmoles of norleucine and 2.2, 22, 220, and 2200 nmoles of glutamic acid
(the amino acid with the largest concentration range in pore water samples) were derivatized. The GCGC peak area ratios (glutamic
acid/norleucine) were 0.301, 2.87, 33.8, and 321, which give an average RMRF of 1.15 (s = 0 08).
Peak identification in samples was by comparison of GCGC retention times and electron-impact ionization (and in some cases chemical ioniza-tion) mass spectra to those of authentic standards (Sigma).
Electron-impact ionization mass spectra were obtained using an SE-52 glass capillary column installed in a Varian Aerograph 1400 gas chromato-graph interfaced with a Finnigan 1015C quadrupole mass spectrometer. Mass spectral fragmentation patterns of (N.0)-trifluoroacetyl n-butyl esters have been discussed by Leimer et al. (1977). Those of the HFBBE are virtually identical except that m/e of all fragments containing tne heptafluorobutyryl group is increased by 100 a.m.u.
Blanks:
At the low amino acid concentrations found in geological samples, contamination from sources such a human fingers, impure reagents, and unclean glassware can invalidate results (Oro and Skewes, 1965; Lee, 1975). The following precautions were taken in this study to reduce analytical blanks to low levels:
(1) All glassware was Chromerged overnight, rinsed with tap water, 3X with 3N HC1, 5X with distilled water, and 5X with
TABLE 2-3
Blanks (Oceanus 74) (nmoles)a
Blank Number Amino Acid 1 2 3 4 5 6 ala 0.28 0.07 0.10 --- 0.10 0.23 gly 1.1 0.36 0.10 0.38 0.38 0.51 val 0.22 0.31 0.16 0.29 --- 0.17 thr 0.14 _ b b. -- --pro 0.08 --- --- --- ---asp 0.11 0.04 .. 0.07 0.07 glu 0.11 0.04 --- --- 0.07 0.07 TOTAL 2.0 0.8 0.4 0.7 0.6 1.1 d.l.c 0.05 0.04 0.08 0.08 0.07 0.07
aper 70 mL cation exchange column bBelow detection limit.
cDetection limit.
(2) Cation exchange resin was repeatedly washed with 6N HCI, water, 7N NH4OH, and water until the eluates were colorless before
use. The same resin was used repeatedly throughout this work, and resin blanks decreased with time. Resin was always rinsed with at least one cycle (HC1, H20, NH4OH, H20) berore use and between
samples.
(3) Water used for column chromatography and final glassware rinsing was prepared by distilling twice, the second time from potassium permanganate solution in an all-glass still. Aqueous NH OH (1.5 to 2.0 N) was prepared by bubbling anhydrous ammonia
through double-distilled water. Two successive azeotropic distilla-tions in an all-glass still were used to prepare purified 6N HCI for column chromatography and hydrolyses (Peltzer, 1979).
(4) Glassware and resin used for low-level samples (porewater and seawater) was kept separate from that used for high-level samples
(sediments and organisms).
(5) Care was taken at all times to prevent sample contact with fingers, air-borne contaminants, and other sources of extraneous amino acids.
Blanks for column chromatography were run on shipboard during Knorr 73-2 and Oceanus 74. Table 2-3 gives the results of the six blanks from Oceanus 74, which are representative of all blanks run. The average total amino acid blank was 0.9 (s = 0.6) nmoles, made up mostly of glycine. This would be equivalent to a concentration of 0.05 PM for a sample size of 20 ml. Blanks were only rarely significant with respect to sample concentrations.
Other Methods Total Hydrolyzable Amino Acids:
Approximately 1 to 2 g wet sediment was placed in a 5 ml Reactivial along with 2 ml twice-distilled 6N HCI and an internal standard (norleu-cine). The vial was flushed with N2 and sealed with a Teflon-lined screw cap. The vial was shaken to thoroughly disperse the sediment and then sonicated for 30 minutes. Hydrolysis was carried out at 1100
C for
24 hours. Rehydrolysis of sediments yielded less than 10 % of the original extract, except for a slightly higher amount of sterically hindered residues (valine and isoleucine) in the organic-rich Pettaquam-scutt River sediments and of y-aminobutyric acid in the Bermuda Rise sediment (Table 2-4). The hydrolyzate was- filtered through a precom-busted glass fiber filter to remove the sediment, which was then washed with approximately 25 ml of double-distilled water. The filtrate was evaporated to near-dryness, redissolved in double-distilled water, and re-evaporated to remove acid. Analysis of the free amino acids in the hydrolyzate was carried out as described earlier.
Total Carbon, Total Organic Carbon, Total Nitrogen, and Dissolved Organic Carbon:
For total carbon (TC), total organic carbon (TOC), and total nitrogen (TN) analyses, sediment subsamples were dried overnight at 1100C and then ground in a mortar and pestle. The sample was split in two and one part was treated with 2M twice-distilled HCl to pH 2 to destroy carbon-ate. The sediments were redried, and the carbon and nitrogen contents
TABLE 2-4
Amino Acid Concentrations in Re-hydrolyzed Sediment (% of first hydrolysis)
Amino PRE PRE BBPl2/5 BBPl2/5 BR3
Acid 24-30 cm 30-36 cm 0-2 cm 2-5 cm 6-12 cm ala 5.9 6.6 2.4 3.5 ---gly 3.5 3.8 1.2 1.7 ---val+ -ala 13 14 4.6 5.9 5.1 thr 4.3 4.8 1.5 2.5 ---ser 4.0 4.8 2.3 3.2 ---leu 11 11 4.3 6.3 ---ile 17 18 7.0 9.2 ---y-aba --- --- --- --- 22 pro 5.0 5.2 1.2 2.0 ---hypro 3.6 4.0 --- --- ---asp 3.5 4.2 1.2 2.0 ---phe 8.3 8.3 3.5 5.6 ---glu 4.6 5.5 1.6 2.5 ---lys+tyr 6.4 7.5 2.4 3.5 ---TOTAL 5.7 6.3 2.8 3.0 1.5
measured on a Perkin-Elmer CHN Analyzer.
Pore water samples for DOC analysis were diluted from 5 to 40 times with double distilled water to give solutions containing from 1 to 10 mgC/L. Seawater samples were analyzed without dilution. The samples were aciditied with 3 % H3PO4 and purged with N2 to remove
inor-ganic carbon. Three 10 ml aliquots of each sample were placed in precom-busted glass ampules, 0.2 g of potassium persulfate was added, and the ampule purged with N2 and sealed. Oxidation was carried out at 1000
to 110 C for three hours. The CO2 evolved was measured on an Ocean-ography International Model 0524 Carbon Analyzer. Calibration was rela-tive to sucrose solutions of known concentration treated as for samples. Analytical precision was 10 %.
Inorganic Pore Water Analyses:
Nitrate, nitrite, and ammonia were measured using a Technicon
Autoanalyzer according to the methods described in Technicon Industrial Systems Method No. 168-71W (1972) and Adamski (1976). During the Gulf of Maine cruise (Knorr 69-1), ammonia was measured using the method of
Solorzano (1969).
Total carbon dioxide was measured using a head-space gas chromato-graphic method. From 0.5 to 1 ml of pore water was placed in a 20 ml
(R)
Vacutainer , 0.05 ml of 2 M H3PO4 was added, and a subsample of
the evolved CO2 was withdrawn in a gas-tight syringe. The CO2 was
Ppk(R)
measured gas chromatographically using a Porpak(R) QS column and a thermal conductivity detector. Precision was 5%, but accuracy may have been affected in some cases by sampling problems due to the precipitation
of calcium carbonate from supersaturated pore waters.
Sulfide was measured by the method of Gilboa-Garber (1971). The pH of pore water samples was measured using a Beckman #39102 combination electrode. Total water content of sediment was determined by the difference between wet weight and weight after drying at 1100C to
constant weight.
Reproducibility and Sample Storage
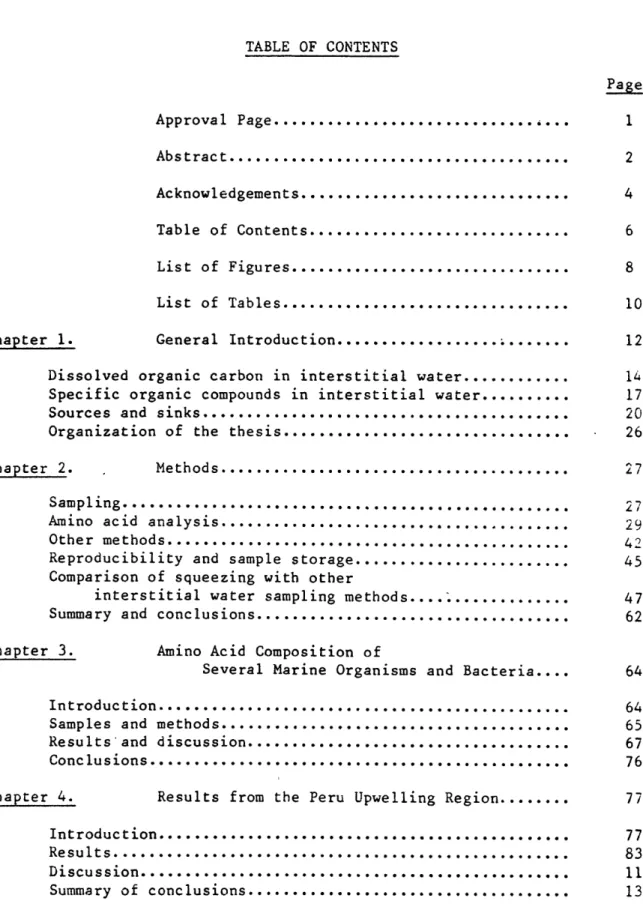
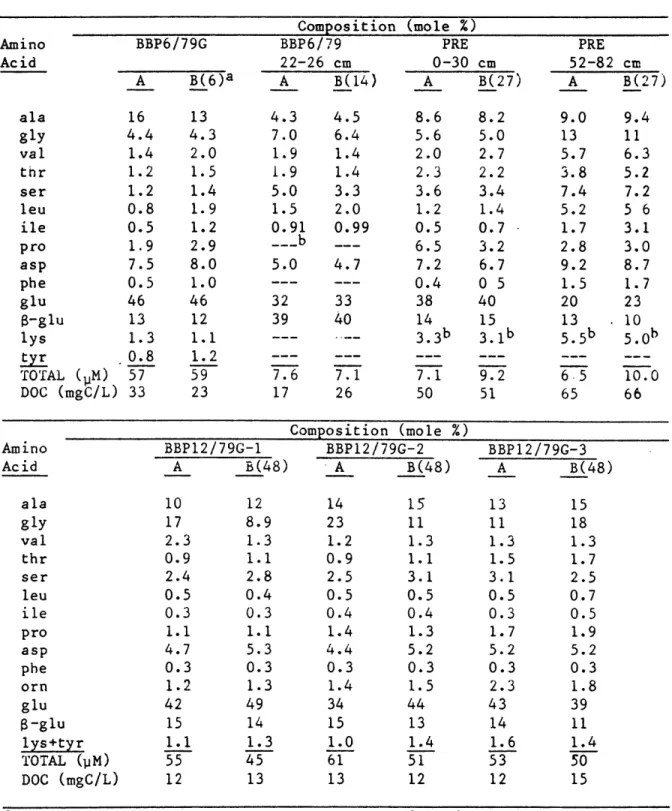
During the course of this research, replicate squeezing and analyses have been conducted on selected sediment samples to find the magnitude of variability in amino acid concentration and composition due to sampling. This data is summarized in Table 2-5. Total concentrations of replicate squeezings differ by an average of 18 %, about 2 to 3 times the strictly analytical error but still in quite good agreement. The concentration differences are largely due to glycine, which is the major free amino acid in several benthic organisms (see Chapter 3). Thus some of the variability may be due to heterogeneous distribution of these organisms. The number in parentheses next to the second of each pair of analyses is the time in hours of storage at 2 C between squeezings. There are no consistent trends in concentration or composition with time, indicating that storage of sediment for reasonably short times has little effect.
DOC in replicated samples differed by an average of 20 % and again showed
no consistent direction of change with storage.
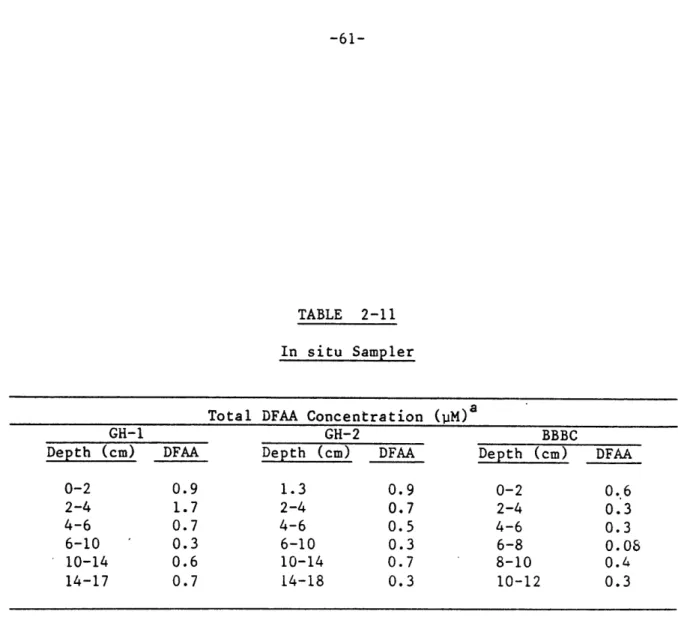
It was also necessary to store samples after squeezing, usually for no more than 24 hours at 2 C, before cation exchange chromatography
TABLE 2-5 Reproducibility of Squeezing BBP6/79G A B(6)a Composition BBP6/79 22-26 cm A B(14) (mole %) PRE 0-30 cm A B(27) PRE 52-82 cm A B(27) ala gly val thr ser leu ile pro asp phe glu 8-glu lys tyr TOTAL (PM) DOC (mgC/L) BBP12/79G-1 A B(48) Composition (mole %) BBPl2/79G-2 A B(48) BBP12/79G-3 A B(48) ala gly val thr ser leu ile pro asp phe orn glu 8-glu lys+tyr TOTAL (pM) DOC (mgC/L) aHours of refrigerated bNone detected.
storage between squeezing of subsamples A and B. Amino Acid 16 4.4 1.4 1.2 1.2 0.8 0.5 1.9 7.5 0.5 46 13 1.3 0.8 57 33 13 4.3 2.0 1.5 1.4 1.9 1.2 2.9 8.0 1.0 46 12 1.1 1.2 59 23 4.3 7.0 1.9 1.9 5.0 1.5 0.91 --- b 5.0 32 39 7.6 17 4.5 6.4 1.4 1.4 3.3 2.0 0.99 4.7 33 40 7.1 26 8.6 5.6 2.0 2.3 3.6 1.2 0.5 6.5 7.2 0.4 38 14 3.3b 7.1 50 8.2 5.0 2.7 2.2 3.4 1.4 0.7 3.2 6.7 0 5 40 15 3.1b 9.2 51 9.0 13 5.7 3.8 7.4 5.2 1.7 2.8 9.2 1.5 20 13 5.5 b 6.5 65 9.4 11 6.3 5.2 7.2 5 6 3.1 3.0 8.7 1.7 23 10 5.0 b 10.0 66 Amino Acid 10 17 2.3 0.9 2.4 0.5 0.3 1.1 4.7 0.3 1.2 42 15 1.1 55 12 12 8.9 1.3 1.1 2.8 0.4 0.3 1.1 5.3 0.3 1.3 49 14 1.3 45 13 14 23 1.2 0.9 2.5 0.5 0.4 1.4 4.4 0.3 1.4 34 15 1.0 61 13 15 11 1.3 1.1 3.1 0.5 0.4 1.3 5.2 0.3 1.5 44 13 1.4 51 12 13 11 1.3 1.5 3.1 0.5 0.3 1.7 5.2 0.3 2.3 43 14 1.6 53 12 15 18 1.3 1.7 2.5 0.7 0.5 1.9 5.2 0.3 1.8 39 11 1.4 50 15
could be completed. The glass fiber filters used did not completely exclude bacteria (nominal pore size of glass fiber filters is 0.3 to 1 P). Table 2-6 shows replicate analyses of four Buzzards Bay (BBBC) surface sediment pore water samples. Sample A in each case was acidified to pH 2 immediately after squeezing to halt bacterial activity and then subjected to cation exchange chromatography. Sample B was stored for 24 hours at 20 before cation exchange chromatography. There are no
significant differences between the two analyses. Samples kept for excessive periods without acidification do, however, deteriorate as seen
in Table 2-7. Seven days of storage resulted in losses of all amino acids except B-aminoglutaric acid in two out of three samples. Higher bacterial cell counts (provided by J. E. Hobbie) were present in the more decomposed samples. Similar decomposition was observed after two years of frozen storage for some samples from Knorr 73-2, which were not acidified prior to freezing, as compared to duplicate samples which had been subjected to on-board column chromatography.
Comparison of Squeezing with Other Interstitial Water Sampling Methods Water in sediments may be present as:
(1) Free water in interstices or "pores" between sediment
grains. Such water may interact with a portion of the solid phase having a particular composition and/or be in limited diffusive contact with other "pores", resulting in a unique composition.
(2) "Bound" water which is adsorbed to clays or present as water of hydration in iron oxides or other minerals, and has a
charac-TABLE 2-6
Effect of Sample Storage after Squeezing
Composition (mole %) Amino 0-2 cm Aaib Acid A ala 22 gly 15 val 1.4 thr 1.2 ser 2.4 leu 0.6 ile 0.5 pro --- c asp 8.1 phe 0.4 orn 1.2 glu 37 -glu 7.8 lys+tyr 3.4 TOTAL 83
( -P)
B 21 14 1.5 0.9 1.9 0.6 0.6 8.0 0.4 1.9 38 8.1 3.2 75 2-4 cm A 12 3.5 1.2 1.1 1.7 0.6 0.4 6.0 0.4 1.7 48 20 2.7 55 4-6 cm B 13 3.1 1.3 0.9 1.4 0.6 0.4 6.0 0.4 2.0 48 21 2.0 60 A 7.6 4.8 0.8 1.1 1.6 0.5 0.4 4.4 0.4 3.8 46 27 1.7 50 B 6.7 3.0 0.6 0.7 1.2 0.5 0.3 4.2 0.2 2.0 50 30 0.8 40 6-8 cm A B 10 8.6 3.7 3.3 0.8 0.8 1.0 0.9 1.8 1.7 0.5 0.5 0.4 0.4 3.3 3.2 0.4 0.4 3.7 2.6 42 44 31 33 1.4 1.3 30 27aAcidified immediately after squeezing. bStored for 24 hours at 20C unacidified
chromatography.
before cation exchange cProline peak in these samples was obscured by a contaminant.