Publisher’s version / Version de l'éditeur:
Vous avez des questions? Nous pouvons vous aider. Pour communiquer directement avec un auteur, consultez la première page de la revue dans laquelle son article a été publié afin de trouver ses coordonnées. Si vous n’arrivez pas à les repérer, communiquez avec nous à PublicationsArchive-ArchivesPublications@nrc-cnrc.gc.ca.
Questions? Contact the NRC Publications Archive team at
PublicationsArchive-ArchivesPublications@nrc-cnrc.gc.ca. If you wish to email the authors directly, please see the first page of the publication for their contact information.
https://publications-cnrc.canada.ca/fra/droits
L’accès à ce site Web et l’utilisation de son contenu sont assujettis aux conditions présentées dans le site
LISEZ CES CONDITIONS ATTENTIVEMENT AVANT D’UTILISER CE SITE WEB.
Research Report (National Research Council of Canada. Construction),
2012-09-06
READ THESE TERMS AND CONDITIONS CAREFULLY BEFORE USING THIS WEBSITE.
https://nrc-publications.canada.ca/eng/copyright
NRC Publications Archive Record / Notice des Archives des publications du CNRC :
https://nrc-publications.canada.ca/eng/view/object/?id=e1d6311d-3245-417b-889b-4347d34f31b8 https://publications-cnrc.canada.ca/fra/voir/objet/?id=e1d6311d-3245-417b-889b-4347d34f31b8
Archives des publications du CNRC
For the publisher’s version, please access the DOI link below./ Pour consulter la version de l’éditeur, utilisez le lien DOI ci-dessous.
https://doi.org/10.4224/23001157
Access and use of this website and the material on it are subject to the Terms and Conditions set forth at
Office light source spectrum: effects of individual control on
perception, cognition, and comfort
Office Light Source Spectrum: Effects of Individual Control
on Perception, Cognition, and Comfort
Jennifer A. Veitch, E. Erhan Dikel, Gregory J. Burns and Sandra Mancini
NRCC-RR-386
National Research Council Canada Institute for Research in Construction
Ottawa, ON K1A 0R6, Canada
© 2012, National Research Council of Canada, Ottawa
Office Light Source Spectrum: Effects of Individual Control
on Perception, Cognition, and Comfort
Jennifer A. Veitch, E. Erhan Dikel, Gregory J. Burns, and Sandra Mancini
Abstract
Building on prior research concerning the benefits of individual control over illuminance, this experiment tested the effects of tunable light source colour and initial light-emitting diode (LED) spectrum on office workers’ cognitive performance, mood, and satisfaction over the working day. All participants experienced a fixed spectrum in the morning (nominally 3000 K or 6500 K). Half were permitted to use a colour-tuning control to adjust the light source spectrum throughout the afternoon; the other half made one selection at the end of the day. As predicted,
participants’ colour-tuning choices varied widely from one another; however, there was no influence of the starting spectrum on their choices. Participants who had colour-tuning control all afternoon used the controls more frequently than has been observed for dimming controls. Colour-tuning control led to a small increase in pleasant mood, and all participants verbally reported liking the technology. For participants with the fixed spectrum all day, there was a main effect in which 6500 K participants had faster psychomotor responses than 3000 K participants. Over the whole sample, participants did not show the expected drop in alertness and arousal during the latter parts of the day, a finding possibly attributable to the high correlated colour temperatures generally chosen with the colour-tuning system. Future research should explore the interface design for colour-tunable LEDs, provide greater experience with the system, and examine longer-term effects of dynamic changes (both automatic and individually selected) in light source spectrum.
Table of Contents 1.0 Introduction ...4 2.0 Method...5 2.1 Participants...5 2.2 Setting ...5 2.3 Lighting Conditions ...6 2.4 Dependent Measures...7 2.4.1 Demographic variables. ...7 2.4.2 Vigilance. ...8
2.4.3 Cognitive performance. — word judgement task...8
2.4.4 Complex judgements (“Briefing Book”)...9
2.4.5 Social behaviour. ...9 2.4.6 Colour discrimination. ...9 2.4.7 Personal appearance...9 2.4.8 Room appearance. ...9 2.4.9 Lighting judgements...10 2.4.10 Mood. ...10 2.4.11 Well-being...10
2.4.12 Workday experiences questionnaire. ...11
2.4.13 Colour-tuning choices. ...11
2.5 Procedure ...11
3.0 Results...12
3.1 Data Analysis Strategy...12
3.1.1 Planned comparisons. ...12
3.1.2 Data checking and cleaning. ...13
3.2 Individual Colour-Tuning Choices ...14
3.2.1 Characterizing lighting choices. ...14
3.2.2 Effects of experience. ...16
3.2.3 Effects of time-of-day. ...16
3.3 Colour-Tuning Effects on Performance, Mood, and Perceptions...17
3.4 Lighting Preference Effects on Performance, Mood, and Perceptions...20
3.4.1 Colour-tuning participants: regression analyses...20
3.4.2 No change participants: categorical analyses. ...21
3.5 Chosen Colour Quality Effects on Colour Discrimination...21
3.6 Assigned Spectrum Effects on Performance, Mood, and Perceptions...22
3.6.1 Full-day spectrum by time interactions...22
3.6.2 Morning-only effects...24
4.0 Discussion...25
4.1 Results versus Hypotheses...25
4.2 Limitations and Future Directions...27
4.3 Conclusions ...28
5.0 References...28
1.0 Introduction
Solid-state lighting (SSL), a category comprising light-emitting diodes (LEDs) and organic LEDs (OLEDs) is a new technology undergoing rapid development. Although
commercial products on the market today are as efficacious as linear fluorescents for general lighting, the efficacy of commercial white SSL sources is expected to double that of fluorescent in the long term. For SSL to make a major dent in the lighting energy budget requires
addressing general white light applications, particularly in offices. However, as yet the industry is not conducting very much research and development on new luminaire designs and operation modes using the unique properties of SSL, but remains focussed on incremental source efficacy improvements and socket-for-socket replacements in existing luminaires. New luminaire
designs and operation modes promise greater energy savings and value to the user; the latter will encourage earlier adoption of SSL systems. Put colloquially, few people will adopt an unfamiliar, complex, and (initially) more expensive technology unless it has the potential to offer features and functionality that is different from, and perceived as superior to, the existing
technology.
Previous research at NRC and elsewhere has demonstrated that personal control over light level in an office environment has benefits for occupant work engagement, satisfaction, comfort, and mood, and also contributes to energy savings (e.g., Boyce et al., 2006a; Newsham, Veitch, Arsenault, & Duval, 2004; Veitch, Stokkermans, & Newsham, in press). A field investigation found that these benefits also extend to enhanced job satisfaction and organizational commitment and reduced intent to turnover, as well as reduced absenteeism (Veitch, Newsham, Mancini, & Arsenault, 2010). Furthermore, the wide individual differences in preferred light levels result in energy savings for lighting on the order of ~10% over the usual fixed-illuminance design level (Galasiu, Newsham, Suvagau, & Sander, 2007). Taken together, these results support the case for making investments in office lighting quality because
enhanced lighting quality supports employees in their work and reduces human resources and energy costs.
LEDs now offer the possibility of some degree of control over delivered light spectrum, in addition to the capability to adjust light levels. If this feature adds to office lighting quality, it would contribute to the financial case for investments in new lighting technology. This
experiment is a test of the viability of individually tunable light source colour for general office lighting.
We hypothesized that individual preference for light spectrum does vary substantially across the population of office workers, and that having personal control over light source spectrum will enhance occupant well-being, cognitive performance, and satisfaction. Others have suggested that varying spectrum systematically by time of day might have direct physiological benefits, via linkages to circadian rhythms, or by other mechanisms (Bommel, 2006). Existing colour quality indicators (e.g., colour rendering index, CRI [CIE Ra]) are poor
predictors of colour quality for LED lighting, and the search for better metrics is a major part of international LED research (Davis & Ohno, 2009). The results of this experiment will also address LED colour quality effects as a contribution to this international debate.
The experiment is a 2 x 2 (initial spectrum X afternoon tunability) factorial design. The initial spectra had correlated colour temperatures (CCT) of ~3000 K and ~ 6500 K; half of the participants were given the option to change the light source spectrum after lunch in the full-day session. This experiment was designed to test five hypotheses:
H1: When given the opportunity, individuals will self-select different spectral power distributions as their preferred lighting.
H2: Being given control will stop or reverse the daily, fatigue-driven trend in reduced performance and mood (trends that have been observed previously).
H3: Those whose preference (selected spectrum) in the afternoon is most different from what they previously experienced (in the morning) will show the largest (favourable) changes in mood, satisfaction, and performance.
H4: Overall, colour discrimination performance will be better for conditions with higher colour quality. (This hypothesis will be tested with the participants’ selected light source spectra.)
H5: Overall, performance and alertness will be higher for the 6500 K group than the 3000 K group, and this will be particularly evident immediately after lunch in the absence of a post-prandial dip.
The overall objective of this experiment was to demonstrate that providing individually tunable light source spectrum, as is possible with LED lighting, improves the office environment by improving the satisfaction of office workers. Such a demonstration would facilitate the uptake of this new technology, thereby increasing the potential for energy savings as system efficacy improves over the conventional fluorescent systems that LED lighting will replace.
2.0 Method
2.1 ParticipantsParticipants were recruited by a temporary services agency following screening criteria provided by the researchers. Participants were required to be adults, fluent English speakers, to pass criteria on the agency tests for typing performance and word fluency, and to have normal or corrected-to-normal vision, normal hearing, and no mobility problems. They were
compensated for their time at the usual pay rate for clerical workers for a one-day session. Valid data were obtained from 82 participants, 40 men and 42 women, whose ages ranged from 18 to over 60 years. In addition to the valid cases, six colour-blind participants were tested, but their data were set aside. Data from six individuals was lost because of equipment failures.
2.2 Setting
The experiment took place in a laboratory at the National Research Council in Ottawa, Canada (45.4° N, 75.7° W). This laboratory is a windowless mock-up office with total
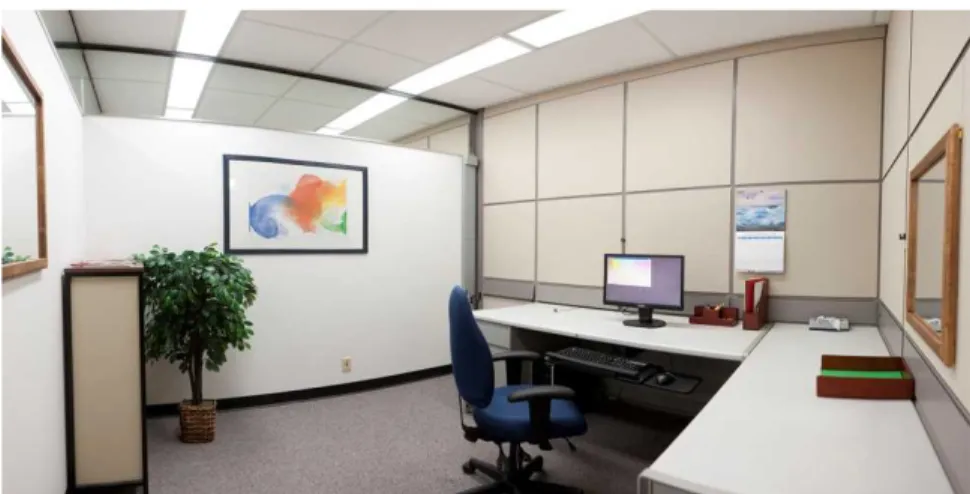
dimensions 6 m x 4.93 m x 2.73 m (19’ 8’ x 16’ 2” x 8’ 9”), equipped with two cubicles separated by full-height furniture panels, but with no doors. Each cubicle is 3.01 m x 2.67 m (9’ 8” x 8’ 7”) in size. Figure 1.Panorama view of one of the cubicles, as decorated for the experiment. The photo
was taken under the cooler of the two initial settings (see section 2.3). Photo: Harry Turner.
Figure 1 shows one of the two identical cubicles. Note that a mirror at the top of the wall and extending down 0.53 m (1’ 7”) gives the appearance of a larger space extending beyond the individual cubicle boundary. Each cubicle had an L-shaped desk with a smooth grey surface (ρ = .55). The desk was equipped with a personal computer, an adjustable keyboard tray with mouse extension, and an LCD monitor. The office chair was fully adjustable. The painted walls were a very light grey (ρ = .79) and the fabric panels were beige (ρ = .48) with taupe supports (ρ = .23). The floor was carpeted in a tweed pattern of grey with coloured flecks (ρ = .12). The colour scheme was chosen to avoid dramatic chromatic shifts under the tunable colours. Accents were provided in the form of art on the walls, an artificial plant, a calendar, and real wood desk accessories. The two mirrors on the walls had low-iron glass so that participants could make judgements of their own skin appearance with minimal colour distortion from the mirror.
2.3 Lighting Conditions
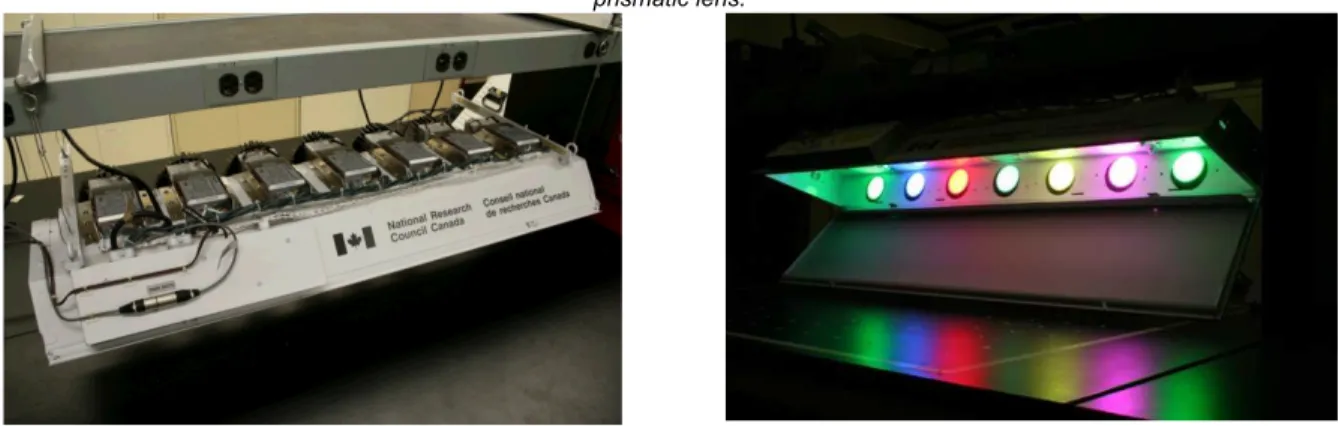
The ambient lighting was provided from recessed prismatic-lensed 1 ft by 4 ft luminaires that were modified to use seven LED units as the light source, instead of fluorescent lamps (see Figure 2). These light engines have three separately controllable channels for red, green and blue (RGB) LEDs. Each LED module also contains a group of white LEDs that are controlled by an internal feedback loop within the LED driver and are not adjustable. Outwardly the luminaires look like conventional fluorescent office lights.
Figure 2. Custom luminaire. Left photo: exterior of troffer (shown suspended from lab bench).
Right photo: LED sources are individually controllable and are aimed at the side of the troffer to provide a diffuse light through the prismatic lens.
Participants were randomly assigned to one of the two initial starting conditions,
nominally 3000 K or 6500 K white light (see Figure 3), both providing ~ 500 lx on the desk and CRI = 90. This lighting was fixed for the morning for all participants.
We characterized each lighting condition using spectroradiometric measurements on a reflectance standard in a fixed location in front of the monitor in each cubicle. Note that these measurements will take into account the inter-reflections in the cubicle and therefore are
records of the conditions as experienced rather than being pure measurements of the luminaire output. Table 1 summarizes the photometric and colorimetric characteristics of the two
conditions.
Table 1. Colour characterization of initial lighting conditions
Mean Measured Conditions
Nominal CCT CCT CRI Δuv x y CQS
3000 K (N=40) 2596 89 -0.0070 0.4554 0.3900 80
6500 K (N=42) 6377 90 -0.0110 0.3176 0.3079 83
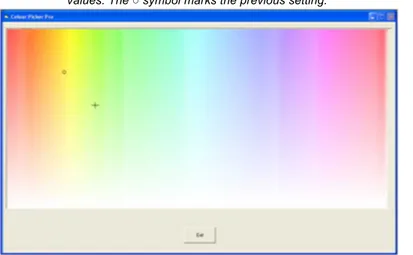
Half of the participants in each spectrum group had the opportunity to individually tune the lighting spectrum (maintaining the same illuminance) for the afternoon using custom-designed colour selection software (“Colour Picker“) presented on the computer screen (see Figure 4). The other half continued to work under the same lighting all day; they did not know that light source spectrum control was a possibility until the end of the day, at which time they used the colour selection software to indicate their personal spectral preference. This
independent variable is called Colour-Tuning elsewhere in this document.
Changing the cursor position on the Colour Picker image while pressing the left mouse button returned values for the RGB
channels to the lighting system. The LED units added a variable input from the W channel (which was outside our control) to maintain the constant illuminance. Custom software logged the RGB values every minute while the system was on, and after every instance in which the participant released the mouse button to make a new selection. Post-experimental spectroradiometric measurements of the re-created conditions were used to establish the CCT, CRI, chromaticity coordinates and other colour characteristics of the lighting conditions chosen by participants.
2.4 Dependent Measures
The dependent measures were selected to address all the concepts of interest: cognitive performance, alertness, mood, colour perception, room and personal appearance, physical comfort, and satisfaction.
Participants recorded their age, sex, education, years of work experience (both overall and experience as a temporary office worker), handedness (used for mouse), the state of their vision (corrected or not), eye colour, skin colour group, and hearing. The Early/Late Preferences Scale (Bohle, Tilley, & Brown, 2001) assessed the degree to which an individual prefers to be most active in the morning, or later in the day, on a scale from 0 (early) to 48 (late). Morningness/Eveningness (or chronotype) is thought to reflect underlying differences in circadian rhythm and might predict lighting preferences.
Figure 4. Colour Picker interface. The RGB values changed dynamically as participants clicked and moved the mouse (+); unclicking would fix the
values. The ○ symbol marks the previous setting.
Envelope. An envelope icon on the computer screen in a fixed
location changed colour, together with a ‘beep’ warning, to simulate e-mail arrival; these instances were pre-programmed, but appeared random to the participants. Participants were instructed to click on the icon as quickly as possible after the change. The speed of response to the envelope, in milliseconds (ms), is the measurement of vigilance; we averaged across the envelope events within each session. This outcome was sensitive to lighting control in previous NRC research (Boyce, Veitch, Newsham, Myer, & Hunter, 2003).
Target detection task (“Conveyor Belt”). This computer-based task presents moving
symbols that enter the screen from the left and exit on the right, in random order. This
movement was over a black, horizontal strip, simulating a conveyor belt. During passage across the screen the symbols pass through a defined region on the simulated conveyor belt.
Participants used the space bar to delete a specified target symbol as it entered this region. Measures of performance speed on this task are sensitive to lighting conditions (Veitch and Newsham, 1998). For this experiment we varied the difficulty level using both the speed of movement and the number of distractor symbols. Dependent variables for each complete presentation of the conveyor belt within an experimental session were the average reaction time (time in ms to correctly delete a target after it entered the removal zone), the total number of false positives, and the overall hit rate ([correct hits – false positives]/total targets).
This measure is based on the task-asymmetry phenomenon in cognitive psychology (Allport, Styles, & Hsieh, 1994; Wong & Leboe, 2009). Individuals perform a task more slowly and less accurately when it follows a different task than when it follows the same task. This switch-cost asymmetry increases with cognitive fatigue (Lorist et al., 2009).
We used the word judgement tasks developed by Wong and Leboe (2009). Participants view a pair of words, each for a very short time (500 ms). In response to each word, participants either identify a surface feature of the word, either colour (“red word or blue word?”) or print size (“large print or small print?”) (the easy task) or make a category judgement about the meaning of the word, either animal size (“large animal or small animal?”) or habitat (“land animal or sea animal?”) (“the difficult task). They make this response using one of two keys on the computer keyboard. The computer records the time required for the response (in ms).
Each trial requires participants to perform two tasks (questions) in succession and, varying at random, the two tasks could be either the same (both easy or both difficult) or different (with the first, prime display, either easy or difficult, and the second, probe task,
sometimes requiring a switch to the alternative task). Thus a trial could consist of task pairs that were easy-easy, easy-difficult, difficult-difficult, or difficult-easy. Relative to when both prime and probe displays require performance of the same task, participants should be slower when the probe task differs from the prime task. There were 32 trials in a block, and 8 blocks in a session. The trial order within each session was random. We did not include blocks one and two from session 1, following Wong and Leboe (2009) in treating these as training runs.
We created two dependent variables to assess this performance. For each variable, we analyzed the average score across all the relevant trials in all blocks within one session (i.e., across 6 blocks in session 1, and 8 blocks in sessions 2, 3, and 4). Hard task-switching was the difference in reaction time for trials that were easy-difficult and those that were easy-easy. That is, the former change should result in a longer processing time because the probe trial was more difficult than the prime. Easy task-switching was the difference in reaction time for trials that were difficult-easy and difficult-difficult. Because of task-asymmetry, we predicted that this too would show a processing cost; however, we expected it to be a smaller cost than for the more difficult shift.
We predicted for both hard and easy shifts that the size of the difference should become larger as participants become fatigued. We predicted that participants who experienced more
2.4.2 Vigilance.
short-wavelength light (either in the fixed 6500 K condition, or because of their self-selected light source spectrum), would show less fatigue over the afternoon, in form of a smaller
task-asymmetry effect.
This task was a filler task, to occupy time in an engaging manner and to provide time away from the computer. In each session there was a 20-minute paper task called "MP's briefing book". Playing the role of assistant to a Member of Parliament (MP), participants perused a set of current-affairs magazines and newspapers and reported on paper the titles and locations of any articles to which the "MP's" attention should be drawn. Responses to this task were not scored because there is no standardized scoring system.
Participants imagined that they worked in a company HR department, reviewing applicants for a given position. In each session (i.e., three times over the day), they read a fictional resume (modified versions of fictional resumes available on career websites such as www.monster.com), and evaluated the candidate on skills, competence, intelligence, and assigned a starting salary. Two scores were generated from these data: the average of the evaluation scores (range 0-4), and the salary awarded (expressed as a standardized score to normalize across the different salary ranges specified for the different jobs). A similar task was used in previous NRC research (Veitch & Newsham, 1998) and it is based on published work (Sauser, Arauz, & Chambers, 1978).
Light source spectrum should influence people’s ability to make subtle colour distinctions. We used the
Farnsworth-Munsell 100-hue test to measure this ability (Kinnear & Sahraie, 2002). For this task, individuals are presented with trays of colour samples in random order and are asked to sort them into hue and saturation orders. In this investigation, absolute performance was not of interest; we were interested in the comparative performance under the varying spectral
conditions. The dependent variable was the total error score (TES), which is 0 if the test is perfectly performed.
Previous NRC research found that individuals’
judgements of the acceptability of their skin colour vary in relation to the light source spectrum (Veitch et al., 2002). We tested this phenomenon by asking individuals to rate their own appearance using five semantic differentials
(unnatural/natural; colourless/colourful; unhealthy/healthy; ugly/beautiful; displeasing/pleasing), each recorded as a number between 0 and 100 based on the position of a slider on the
computer screen. Participants made this judgement after having looked at themselves in an iron-free mirror hanging in their cubicle. The iron-free glass lacks the green tint of an ordinary mirror, thereby minimizing colour distortions. The internal consistency of the scale formed by averaging the five scores was very good (Cronbach’s alpha = 0.86. 0.90, 0.89 in sessions 2, 3, and 4 respectively).
Evaluative judgements of the appearance of the office were collected using a set of semantic differentials based on Flynn, Hendrick, Spencer & Martyniuk (1979), Loe, Mansfield, and Rowlands (1994), and Veitch and Newsham (1998) and used in a recent field study (Veitch et al., 2010). These were
radiant/gloomy, distinct/vague, dim/bright (these three averaged to form the illumination scale), like/dislike, sombre/cheerful, ugly/beautiful, subdued/pleasant, and attractive/unattractive (these five averaged to form the attractiveness scale). We also created new items related to colour appearance for this study: colourful/colourless and natural colours/unnatural colours. The semantic differentials were scored using sliders giving responses between 0 and 100.
From these 10 items we created three scale scores: illumination (average of 3 items, Cronbach’s alpha = 0.50, 0.65, 0.70 in sessions 2, 3, and 4 respectively), attractiveness (average of 5 items, Cronbach’s alpha = 0.93, 0.95, 0.95 in sessions 2, 3, and 4 respectively), and colour (average of 2 items, Cronbach’s alpha = 0.67, 0.72, 0.71 in sessions 2, 3, and 4
2.4.4 Complex judgements (“Briefing Book”).
2.4.5 Social behaviour.
2.4.6 Colour discrimination.
2.4.7 Personal appearance.
respectively). The illumination and attractiveness scales were derived from previous experience with these scales and had been previously used in a field investigation (Veitch et al., 2010). The colour scale was new to this study. In analyses reported below, we added to these scale scores a colour naturalness scale derived from 3 Likert scales presented as part of the lighting quality set (see below, section 2.4.9).
We measured lighting judgements using the 5-point lighting quality scale developed by Veitch and Newsham (2000) during each work session. We also added 7 additional items related to colours, flicker, and brightness. These were scored on 5-point Likert scales from 0-4. From these we created three scale scores following principal components analysis. The colour and flicker scales were acceptable in their internal consistency across the three sessions (for colours, 3 items,
Cronbach’s alpha = 0.62, 0.68, 0.58 in sessions 2, 3, and 4 respectively; for flicker, 2 items, Cronbach’s alpha = 0.77, 0.91, 0.86 in sessions 2, 3, and 4 respectively). The brightness scale was not (2 items, Cronbach’s alpha = 0.41, 0.20, 0.16 in sessions 2, 3, and 4 respectively). The low reliability for the brightness scale probably resulted from the questions not having parallel wording: “The light was dim in this room” does not have the same evaluation function as “The electric lights were too bright”.
The lighting quality questions were presented together with questions concerning thermal comfort (the ASHRAE thermal sensation scale [on a slider, 0 cold to 100 hot] and the McIntyre thermal preference scale [-1, 0, 1]), air movement, and acoustic comfort (one question each, on a slide from 0-100, developed for this study). This was to distract attention from the emphasis on lighting and visual conditions.
Mood was assessed several times each day using two tools. One of these was the Affect Grid, a simple measure of pleasure and arousal in which the individual places a mark in one square of a 9 x 9 matrix on which one axis indicates pleasure and the other arousal (Russell, Weiss, & Mendelsohn, 1989). Scores may range from 1 to 9, with higher scores indicating greater pleasure or greater arousal.
The other scale was a new scale to assess immediate alertness, developed for this investigation. It consists of five items (alert, fresh, energetic, able to concentrate, able to focus on the tasks), to which individuals indicate their current sensation on a 5-point Likert scale from “not at all” to “extremely” . The items were adapted from the 7-item Toronto Hospital Alertness Scale (Shapiro et al., 2006). The internal consistency of this new scale was excellent
(Cronbach’s alpha = 0.91, 0.93, 0.92 for sessions 2, 3, and 4 respectively).
Discomfort. Visual and physical discomfort were assessed using
questionnaires presented on the monitor. The visual discomfort measurement used a modification of the scale developed by Wibom and Carlsson (1987), and with which they demonstrated that luminance ratios of greater than 10:1 between paper and a VDT screen tend to reduce visual comfort over several hours. The scale used asks the
participants to indicate the intensity (not at all, a little, moderately, very much, extremely) at which they are experiencing eight symptoms of eye discomfort (smarting, itching, gritty feeling, aches, sensitivity to light, redness, teariness and dryness). Visual discomfort was scored as the total of the intensity ratings for the eight symptoms, maximum 32. Physical discomfort was assessed using a similar scale for a set of nine general physical symptoms (sore throat, hoarseness, nose congested, sore back, sore wrists and arms, excessive mental fatigue, nervousness and irritability, headaches, unusually tired), maximum score 36. Veitch and Newsham (1998) have found that this measure is sensitive to changes in lighting conditions.
Overall Satisfaction. Indicators of overall satisfaction with the work environment and
one’s own performance in it were completed at the end of each session. Overall environmental satisfaction was measured using a modified version of the four-item scale developed by
Sundstrom, Town, Rice, Osborn, and Brill (1994). The scale (values may range 0-4) has
excellent internal consistency reliability (in this experiment, Cronbach’s alpha = 0.85, 0.90, 0.91)
2.4.9 Lighting judgements.
2.4.10 Mood.
and is sensitive to changes in lighting conditions (Newsham & Veitch, 2001; Veitch & Newsham, 1998). A similar set of four questions, also scored from 0-4, assessed participants' satisfaction with their performance during the session (also modified from one previously used (Boyce et al., 2003)). It had very good internal consistency (Cronbach’s alpha = 0.89, 0.88, 0.88). One
question asked the participants’ opinion concerning the effects that the physical environment that session had on their self-assessed productivity (used in previous NRC research, e.g., Boyce et al. (2003)). This question was scored from -3 to +3.
As a standard practice, we asked participants to report on their
experiences during the session. In this case, this included ratings on 5-point Likert scales (0-4) of the difficulty level associated with the questionnaires, the conveyor-belt task, the word judgement task, the colour-sorting task, the briefing book task, and the tasks overall. We asked open-ended questions about their beliefs concerning the nature of the study and factors that might have affected them. These measures provide guidance concerning any expectancies that might have biased participants.
During data collection the lighting system recorded settings for each cubicle every minute. We replayed these settings at a later time to make detailed spectroradiometric measurements of the colour-tuning choices. These measurements were taken with a Photo Research PR 705 mounted on a tripod viewing a fixed location on a reflectance standard placed in front of the computer monitor.
From these data, we chose four metrics to characterize colour-tuning choices for analysis: CCT, as the most common descriptor of light source colour and Δuv to indicate the distance from the blackbody curve, and two indicators of colour rendering: the familiar CRI, and the newer Colour Quality Scale (CQS), which was developed to better capture the quality of light from LEDs (Davis & Ohno, 2009). For the Choice group, we calculated these metrics for all the lighting choices that had a duration longer than two minutes (below which we considered them transient conditions while controls were being explored). We report here the data for the first and last of these choices for this group. For the No Change group there is only one colour-tuning choice, the choice they made at the end of the workday, just prior to departure.
2.5 Procedure
The protocol was reviewed and approved by the NRC Research Ethics Board. Testing occurred between Nov. 30, 2010 and Mar. 31, 2011, on various days of the week according to the experimenters’ schedules (there was one principal experimenter to run the sessions, and one back-up person). Two participants of the same sex were scheduled for each testing day; they were tested either in pairs or singly, depending on attendance. Both participants on a given day experienced the same experimental conditions, being randomly assigned to one of the two initial lighting conditions (Initial Spectrum) and to having afternoon choice or no change (Colour-Tuning). The testing days alternated between male and female participants, although differential attendance patterns resulted in more women being tested earlier in the testing session than towards the end.
Participants arrived at the laboratory at 08:30. They read and signed a consent form and completed a vision screening before entering the cubicle space to which they had been
assigned. Table 2 outlines the schedule for the day. Custom software programmed in Visual Basic kept the participants on schedule, although the experimenter was present to address any questions and to administer the colour discrimination tasks. Coffee and lunch breaks were taken in a separate space. Participants were asked not to leave the cubicle space during the testing sessions, although they were permitted to do so if the need arose. Participants who smoked were required by federal law to do so outside the building, and were given leave to do so only during scheduled breaks.
2.4.12 Workday experiences questionnaire.
Table 2 Schedule for Testing Day
Approx. Time Task Approx. Duration (min)
8.30 AM Arrival, greeting, instructions, consent 15 Colour vision screening
8:45 Session 1 75
Instructions 2
Demographics, Early-Late questionnaire 5
Physical & visual comfort, mood & alertness questionnaires 3
Conveyor Belt training (5 min) + 15 20
Colour discrimination task 10
Word Judgement training (2)+ 6 blocks 35
10.00 Break 15
10.15 Session 2 90
Briefing book 15
Word Judgement, 8 blocks 30
Resume judgements (set 1) 10
Conveyor belt 15
Colour discrimination 10
Questionnaires: personal appearance, office conditions, room appearance, mood, alertness, physical & visual discomfort, satisfaction (environmental and performance)
5
11.45 Lunch 45
12.30 Explanation of Lighting Controls (Choice group) 15
12.45 Session 3 90
Briefing book 15
Word Judgement, 8 blocks * 30
Resume judgements (set 2) * 10
Conveyor belt * 15
Colour discrimination 10
Questionnaires: personal appearance, office conditions, room appearance, mood, alertness, physical & visual discomfort, satisfaction (environmental and performance)
5
14.15 Break 15
14.30 Session 4 90
Briefing book 15
Word Judgement 8 blocks * 30
Resume judgements (set 3) * 10
Conveyor belt * 15
Colour discrimination 10
Questionnaires: personal appearance, office conditions, room appearance, mood, alertness, physical & visual discomfort, satisfaction (environmental and performance)
5
16.00 Workday Experiences Questionnaire 5
Lighting Choice procedure (no-change group) 15
16.20 Debriefing and farewell 10
Note. Participants in the Choice group did not have access to lighting choice during the tasks marked with an
asterisk (*), but were able to alter the light spectrum during the pauses between different tasks.
3.0 Results
3.1 Data Analysis StrategyWe developed a series of planned comparisons to test specific effects with maximum statistical power. For each set of contrasts we used a series of multivariate analyses of variance (MANOVA) (or covariance, [MANCOVA] as appropriate; see below) to test effects of the independent variables (Initial Spectrum and Colour-Tuning) on conceptually-related groups of dependent variables. MANOVA is a technique for examining whether the mean scores on a group of dependent variables differ between groups formed by the levels of the independent variable(s). The
companion univariate analysis of variance (ANOVA) tests tell us whether the mean scores on a specific dependent variable differ between groups formed by the levels of the independent variable(s). We interpreted significant univariate tests only if the associated multivariate tests achieved statistical significance; in this manner we sought to reduce the risk of a Type I error,
which is when one (incorrectly, but unknowingly) concludes that means differ because of the independent variable when the difference is instead a chance occurrence.
This is a complex experimental design, for which we developed a set of planned
comparisons to test the hypotheses laid out above. Table 3 summarizes the data used for each planned comparison. We studied the main effects and two-way interactions to seek tests of the hypotheses set out in the Introduction. The link between the comparison and the hypotheses is set out in each section below.
Table 3. Summary of planned comparisons.
Cell highlights mark the data that were used for each planned comparison. Data not used in a given comparison has grey labels.
No Change N = 42 ChoiceN = 40 Effect 3000 K N = 20 6500 K N = 22 3000 K N = 20 6500 K N = 20 Initial spectrum x Time
Initial spectrum x Novelty (H1)
Colour-tuning choices Departure Departure All Afternoon All Afternoon Colour-Tuning x Time
(all day)
Lighting for Sessions 1-2 Assigned Assigned
(H2, H3, H4) Lighting @ Sessions 3-4 Assigned Self-Chosen
Spectrum x Time (all day) (H5)
Lighting for Sessions 1-2 Assigned Assigned Assigned Assigned Lighting @ Sessions 3-4 Assigned Assigned Self-Chosen Spectrum
(AM only) (H5)
Lighting for Sessions 1-2 Assigned Assigned Assigned Assigned
Lighting @ Sessions 3-4 Assigned Self-Chosen
We examined the colour-tuning choices in two ways: a comparison of the first choice made by the Choice and No Change groups, and as a comparison of the end-of-day choices of both groups. The first (and only) choice of the No Change group was the end-of-day choice. Because the No Change data appear in both comparisons, these are not independent
comparisons; we judged this to be acceptable because of the exploratory nature of the study, which so far as we know is the first of its kind with LED lighting. We also used multiple
regression analysis to test the effects of light spectrum preferences on the dependent variables. Data analysis began with extensive checking of the demographic characteristics to seek possible sources of bias. The categorical age distribution was bimodal, with 24 participants each in the 18-29 and 30-39 years categories. Forty-nine participants reported using corrective lenses, and 40 wore those lenses during testing. The mean time in the workforce was 17.8 years (SD = 10.8), and mean time working for a temp agency was 2.3 years (SD = 3.5). The mean score for morningness-eveningness was 21.6 (SD = 7.1) on a scale where 0 indicates extreme morning-orientation and 48 indicates extreme evening morning-orientation. The chronotype scale had very good internal consistency (Cronbach’s alpha = 0.85).
Data checking revealed that the demographic characteristics were mostly equally distributed across groups, with one exception: The 3000 K group was slightly older (modal age in the 30-39 band) than the 6500 K group (modal age in the 18-29 band) and better educated (more likely to hold a graduate or professional degree than an undergraduate degree). The age difference was also reflected in a longer period in the paid workforce among people in the 3000 K group (M = 22.0 years [SD = 10.3] versus M = 13.9 years [SD = 9.8]). Analyses for spectrum effects used years in the workforce as a covariate. This continuously reported variable was more precise and more normally distributed than the categorical age report.
3.2 Individual Colour-Tuning Choices
These data address Hypothesis 1.
H1: When given the opportunity, individuals will self-select different spectral power distributions as their preferred lighting.
The Choice group participants in this experiment used the colour-tuning controls frequently during the afternoon (see Figure 5). The mean of 5 uses is higher than is typical for the use of dimming controls (Boyce et al., 2006b), but probably reflects the novelty of the spectrum control. Note that one person used the lighting controls 17 times during the afternoon.
Figure 5. Histogram of frequency of use of light spectrum controls.
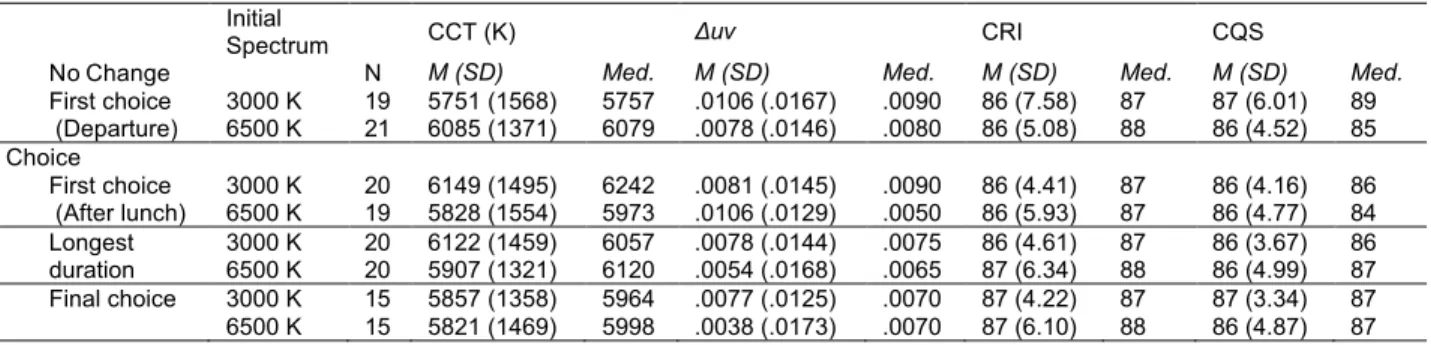
Table 4 shows the descriptive statistics for four colour metrics for four types of lighting choices. From the many colour metrics available, we selected CCT as a common way to describe the colour appearance of a light source; Δuv as an indicator of the distance from the blackbody curve; CRI as the standard indicator of colour rendering ability of the light source, and the Colour Quality Scale (CQS) (Davis & Ohno, 2009) as an alternative way to describe the colour rendering ability of a light source. In a scale model study that was a precursor to this work, CQS had emerged as a slightly better match to colour judgements than other recently-developed colour metrics (Dikel, Burns, Veitch, Mancini, & Newsham, 2014).
For the Choice group, we report their first choice, last choice, and the choice that had the longest duration in the afternoon. These we show broken down by the initial spectrum they experienced. For the No Change group there is only one colour-tuning choice to report, the choice they made at the end of the workday, immediately prior to departure. Sample sizes differ for the groups because we excluded from analysis those cases for which |Δuv| > 0.05. These few outlying cases fall outside the range in which CCT calculations are robust (Commission Internationale de l'Eclairage (CIE), 2004). For the Choice group’s final choice data, we excluded cases for individuals who had made fewer than three changes over the afternoon, as we wanted to compare these data with the No Change group to determine whether or not choices varied as a function of experience with the Colour Picker interface.
Table 4. Means, standard deviations, and medians for colour metrics characterizing lighting choices, by experimental group.
Initial
Spectrum CCT (K) Δuv CRI CQS
No Change N M (SD) Med. M (SD) Med. M (SD) Med. M (SD) Med.
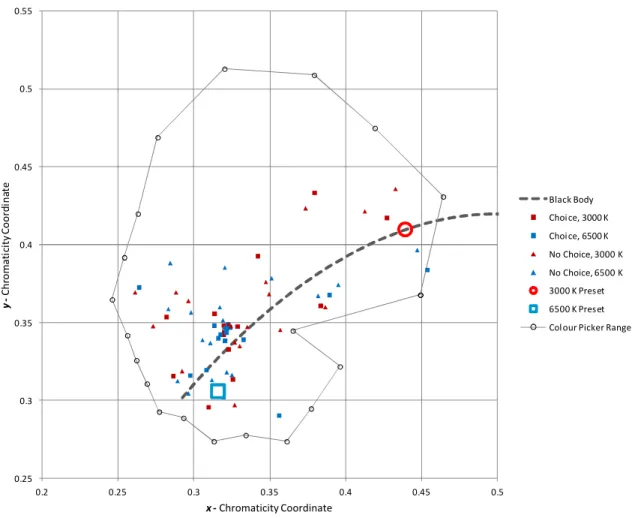
First choice 3000 K 19 5751 (1568) 5757 .0106 (.0167) .0090 86 (7.58) 87 87 (6.01) 89 (Departure) 6500 K 21 6085 (1371) 6079 .0078 (.0146) .0080 86 (5.08) 88 86 (4.52) 85 Choice First choice 3000 K 20 6149 (1495) 6242 .0081 (.0145) .0090 86 (4.41) 87 86 (4.16) 86 (After lunch) 6500 K 19 5828 (1554) 5973 .0106 (.0129) .0050 86 (5.93) 87 86 (4.77) 84 Longest 3000 K 20 6122 (1459) 6057 .0078 (.0144) .0075 86 (4.61) 87 86 (3.67) 86 duration 6500 K 20 5907 (1321) 6120 .0054 (.0168) .0065 87 (6.34) 88 86 (4.99) 87 Final choice 3000 K 15 5857 (1358) 5964 .0077 (.0125) .0070 87 (4.22) 87 87 (3.34) 87 6500 K 15 5821 (1469) 5998 .0038 (.0173) .0070 87 (6.10) 88 86 (4.87) 87 Another way to visualize the colour-tuning choices is to plot them in colour space. Figure 6 shows the end-of-day choices for the Choice and No Change groups by initial spectrum on the CIE 1931 x,y chromaticity diagram. Extreme outliers (|Δuv| < 0.05) have been removed. Colour coding shows which initial spectrum and lighting control group produced each point.
Figure 6. End-of-day colour-tuning choices, by initial spectrum and choice condition, plotted on the CIE x,y chromaticity diagram. Top panel: Full chart, showing the range of screen colours (grey triangle) and range of Colour Picker possible choices (grey oval).
Bottom panel: Detail around the blackbody curve, including the Colour Picker range.
0 0.1 0.2 0.3 0.4 0.5 0.6 0.7 0.8 0.9 0 0.1 0.2 0.3 0.4 0.5 0.6 0.7 0.8 0.9 y -Ch ro m at ic ity C oo rd in at e x - Chromaticity Coordinate Black Body Choice, 3000 K Choice, 6500 K No Choice, 3000 K No Choice, 6500 K 3000 K Preset 6500 K Preset Colour Picker Range Screen RGB Limits
Figure 6. End-of-day colour-tuning choices, by initial spectrum and choice condition, plotted on the CIE x,y chromaticity diagram. Top panel: Full chart, showing the range of screen colours (grey triangle) and range of Colour Picker possible choices (grey oval).
Bottom panel: Detail around the blackbody curve, including the Colour Picker range.
We contrasted the colour-tuning selections of the last choice of the Choice group (regardless of when it was set in the afternoon) against the only choice of the No Change group (at the end of the day). For the Choice group we assumed that the last choice is the one they preferred at the end of the day. As stated above, we excluded cases for which there were 2 or fewer uses of the controls; this reduced the Choice group to 30 cases. Initial spectrum was an additional independent variable and years working was a covariate in this 2 x 2 (Initial Spectrum x Control) MANCOVA. Differences between these Choice and No Change groups would reflect changes in colour-tuning selections caused by experience with the controls over the afternoon. There were no differences between these two groups. Further experience with the controls did not change the mean colour-tuning choices.
We also contrasted the colour-tuning selections of the No Change group (made in the late afternoon) against the first choice of the Choice group (made immediately after lunch), in a 2 x 2 (Initial Spectrum x Colour-Tuning) MANCOVA, with years worked as a covariate. Differences between the Choice and No Change groups would be expected to reflect differences in preferred spectrum related to the time of day when the choice was made.
There were no differences on any of the variables, nor on their interaction. We further probed these data by saving the residuals from this analysis and regressing the residuals on
0.25 0.3 0.35 0.4 0.45 0.5 0.55 0.2 0.25 0.3 0.35 0.4 0.45 0.5 y -Ch ro m at ic ity C oo rd in at e x - Chromaticity Coordinate Black Body Choice, 3000 K Choice, 6500 K No Choice, 3000 K No Choice, 6500 K 3000 K Preset 6500 K Preset Colour Picker Range
3.2.2 Effects of experience.
chronotype, to test whether morning and evening people made different colour-tuning choices. Our expectation was that evening types would tend to prefer a higher CCT late in the day than morning types, but that the other metrics would not change. The later exposure to the higher CCT would be expected to promote alertness into the evening, and would delay sleep. There were no significant effects in these analyses. We probed further by creating a categorical variable for Morning-Evening people, with two categories formed by a median split on the continuous chronotype scores. We used this new variable as an independent variable in a 2 x 2 (Morning-Evening x Colour-Tuning) MANOVA (spectrum was not in the analysis, so there was no need for a covariate). There were no statistically significant effects. Time-of-day did not influence colour-tuning choices, nor did chronotype.
3.3 Colour-Tuning Effects on Performance, Mood, and Perceptions
Analyses in this section were focused primarily on Hypotheses 2 and 3:
H2: Being given control will stop or reverse the daily, fatigue-driven trend in reduced performance and mood (trends that have been observed previously).
H3: Those whose preference in the afternoon is most different from what they previously experienced (in the morning) will show the largest (favourable) changes in mood,
satisfaction, and performance.
We collapsed the groups across spectrum conditions to examine the effects of having tunable colour on the behavioural outcomes across the workday. We predicted that there would be a significant interaction of Colour-Tuning x Time, in which differences between the groups would exist in the afternoon (favouring the Choice group) as a result of individuals obtaining preferred lighting conditions. We did not predict simple main effects of colour-tuning (i.e., in data collapsed over the whole day) because all participants had the same conditions all morning.
The results showed one statistically significant multivariate interaction of colour-tuning by time, on the set of mood measures (pleasure, arousal, and alertness). This was accompanied by a significant univariate effect on pleasure, which has a small effect size. Table 5 provides the statistics for this effect, and Figure 7 illustrates it. Post-hoc tests revealed that the pleasure scores for the two groups were equal in session 2; for the Choice group, pleasure increased in session 3 (when given the colour-tuning controls) and stabilized for session 4. For the No Change group, pleasure scores were stable across the day.
Table 5. Effect of Colour-Tuning x Time on mood measures: test statistics and descriptive statistics (estimated marginal means and standard errors) for pleasure.
Multivariate Test Wilks’ Δ = 0.842, F(6,75) = 2.34, p < .05, η2
partial= 0.16
Univariate Test Pleasure
Linear F(1, 80) = 4.67, p < .05, η2 partial= 0.06 Quadratic F(1, 80) = 4.0, p < .05, η2 partial= 0.05 No Change Session 2 4.91 (0.39) Session 3 4.43 (0.37) Session 4 4.74 (0.40) Choice Session 2 4.53 (0.40) Session 3 5.60 (0.38) Session 4 5.53 (0.41)
Figure 7. Colour-tuning x time effect on pleasure.
There were no other interaction effects of colour-tuning by time. There were, however, statistically significant effects of time on measures of satisfaction, office environment
assessments, comfort, and cognitive performance. Table 6 displays the performance measures as a group. Overall, the trends suggest the action of parallel processes: learning and fatigue. Reaction time on the conveyor belt task dropped from session 1 to session 2 (suggesting learning), then dropped only a little more for sessions 3 and 4 (suggesting learning modified by fatigue).
The task-switching results are somewhat more puzzling. The univariate tests were statistically significant only for the easy switches; the mean task-switching cost for the hard switches remained stable at ~ 375 ms across all four sessions. For the easy switches, the task-switching cost increased from session 1 to session 2 (possibly through fatigue, as predicted by the task-asymmetry theory) but dropped substantially in sessions 3 and 4. In fact, after the lunch break the response times for switching trials (hard-easy) were faster than for trials in which both questions were easy (this is indicated by the negative values). For the easy switches there is no evidence of fatigue, but a strong learning effect. Perhaps for the hard switches the stable means reflect a balance between learning and fatigue that cancelled out.
Further evidence of fatigue in session 2 comes from the time effect on envelope
reaction times, which were very long in session 2, dropping back in sessions 3 and 4 at varying rates. An alternative perspective on this pattern would be to say that something in the
experimental context in the afternoon halted the expected development of fatigue as the day carried on.
Table 6. Effects of time on measures of cognitive performance in the full data set test statistics and estimated marginal means with standard errors in parentheses.
Conveyor Belt Task-Switching Envelope Reaction Time
Multivariate Test Wilks’ Δ = 0.380, F(9, 65) = 11.79, p < .000, η2 partial= 0.62 Wilks’ Δ = 0.681, F(6,66) = 5.14 p < .000, η2 partial= 0.32 NA
Univariate Test Reaction Time Hit Rate Easy
Linear F(1, 73) = 6.77, p < .01, η2 partial= 0.09 F(1, 71) = 14.95, p < .000, η2 partial= 0.17 Quadratic F(1, 73) = 11.32, p < .001, η2 partial= 0.13 F(1, 71) = 10.11, p < .01, η2 partial= 0.13 F(1, 53) = 16.53, p < .000, η2 partial= 0.24 Cubic F(1, 73) = 8.04, p < .01, η2 partial= 0.10 F(1, 73) = 6.61, p < .02, η2 partial= 0.09 F(1, 53) = 6.77, p < .000, η2 partial= 0.22 Session 1 126.40 (3.32) 0.51 (0.04) 6.697 (34.34) 2302.91 (113.37) Session 2 119.40 (2.91) 0.60 (0.04) 68.00 (23.46) 8034.83 (1349.07) Session 3 118.83 (2.55) 0.50 (0.07) -40.12 (19.80) 3162.99 (309.38) Session 4 118.66 (2.39) 0.58 (0.05) -136.87 (33.54) 3051.36 (332.15)
Results for satisfaction and for lighting judgements are grouped in Table 7. In both cases the statistically significant multivariate tests were accompanied by significant linear trends
1 2 3 4 5 6 7 8 9 2 3 4 Pl ea su re Session Choice No Change
across time for two of three dependent variables. The environmental satisfaction scale from the satisfaction group, and the flicker question from the lighting judgements group, did not change over time.
For satisfaction, the two dependent variables that had significant univariate tests both showed improvements from session 2 (after the morning coffee break) to session 4 (after the afternoon coffee break). Participants (regardless of their experimental condition) judged that the work environment enabled them to work better as the day went on (a small-medium effect), and they felt more satisfied with their own performance (a small effect).
Their ratings of the overall lighting quality also improved slightly as the day went on, even though they began well above the scale midpoint (2). Judgements of light level on a scale of 0 (too dim) to 4 (too bright) dropped, coming closer to the scale midpoint.
Table 7. Effects of time on measures of work environment in the full data set: test statistics and estimated marginal means with standard errors in parentheses.
Satisfaction Lighting Judgements
Multivariate Test Wilks’ Δ = 0.748, F(6,73) = 4.10, p < .001, η2
partial= 0.25
Wilks’ Δ = 0.728, F(6,65) = 4.04, p < .01, η2
partial= 0.26
Univariate Test Self-rated Productivity Performance Satisfaction Lighting Quality Light Level
Linear F(1, 78) = 18.71, p < .000, η2 partial= 0.19 F(1, 78) = 4.34, p < .05, η2 partial= 0.05 F(1, 70) = 5.68, p < .02, η2 partial= 0.08 F(1, 38) = 16.52, p < .000, η2 partial= 0.19 Session 2 -0.10 (0.20) 2.41 (0.09) 2.76 (0.12) 2.60 (0.11) Session 3 0.41 (0.17) 2.51 (0.08) 2.94 (0.08) 2.33 (0.10) Session 4 0.74 (0.17) 2.63 (0.08) 2.97 (0.09) 2.24 (0.09)
The MANOVA analyses for the discomfort and thermal comfort groups also showed main effects of time (Table 8). Both visual and physical discomfort showed increases in the morning, then reductions at slower rates in the afternoon. The effect sizes were larger for visual discomfort than physical discomfort, and all of the mean values were very low on the scales (maximum 32 for visual discomfort, 36 for physical discomfort). For thermal comfort, there was a trend to feel warmer as the day progressed (linear effect on the ASHRAE scale), but the
difference was smaller from session 3 to session 4 than from session 2 to session 3 (quadratic effect on the ASHRAE scale). The linear effect on the McIntyre scale indicates that participants wanted to feel slightly cooler later in the day than they had wanted in session 2. In both cases the trend is towards the neutral point on the scales, and the effect sizes are small. The
measured air temperature in the room was generally stable across the day within the range of 22-23 °C, with a small tendency to rise around the lunch hour.
Table 8. Effects of time on measures of comfort in the full data set: test statistics and estimated marginal means with standard errors in parentheses.
Discomfort Thermal Comfort
Multivariate Test Wilks’ Δ = 0.637, F(6, 68) = 6.46, p < .000, η2
partial= 0.36
Wilks’ Δ = 0.784, F(4,74) = 5.10, p < .001, η2
partial= 0.22
Univariate Test Visual Discomfort Physical Discomfort ASHRAE McIntyre
Linear F(1, 73) = 18.59, p < .000, η2 partial= 0.20 F(1, 73) =5.04, p < .03 η2 partial= 0.07 F(1, 77) = 18.24, p < .000, η2 partial= 0.19 F(1, 77) = 9.38, p < .01, η2 partial= 0.11 Quadratic F(1, 73) = `8.98, p < .000, η2 partial= 0.21 F(1, 73) = 13.37, p < .000 η2 partial= 0.16 F(1, 77) = 6.26, p < .02, η2 partial= 0.08 Cubic F(1, 73) = 11.35, p < .001, η2 partial= 0.14 F(1, 73) = 7.26, p < .01, η2 partial= 0.09 NA NA Session 1 1.56 (0.21) 2.27 (0.33) Session 2 3.27 (0.38) 3.84 (0.42) 37.65 (1.58) 0.47 (0.07) Session 3 2.92 (0.34) 3.46 (0.36) 44.46 (1.32) 0.29 (0.07) Session 4 3.09 (0.37) 3.38 (0.41) 44.61 (1.34) 0.27 (0.07)
Contrary to all our prior experience with the measures of mood used in this experiment, there was no evidence that pleasure or arousal dropped over time, nor did we see any change in alertness over the day. Given the consistent evidence of such a change in prior work (Boyce
et al., 2006a; Veitch & Newsham, 1998, 2000), this is most unexpected. The absence of this effect on mood reports mirrors the unexpected patterns for the task-switching and envelope reaction time measures.
3.4 Lighting Preference Effects on Performance, Mood, and Perceptions
This section tests Hypothesis 3:
H3: Those whose preference in the afternoon is most different from what they previously experienced (in the morning) will show the largest (favourable) changes in mood,
satisfaction, and performance.
For the participants who had access to colour-tuning, we addressed this question with the multiple regression approach developed by Newsham et al. (2004). Newsham et al. were concerned with light level choices, for which the single chosen parameter was desktop illuminance. Colour choices are more complex, and this is the first instance of examining them. Therefore we looked at the difference between the individual’s pre-set spectrum and their chosen spectrum on four parameters: CCT, CRI, CQS, and Δuv. There is some redundancy, but we felt this was justified for exploratory purposes. Because individuals used the controls many times in the afternoon, we took the specific setting that was in place during a given task to create the preferred - preset lighting discrepancy score applicable to the dependent variable for that task. Following Newsham et al., the independent variable for these analyses was the absolute value of the difference between the chosen setting and the pre-set condition. Larger values on this variable would mean that the pre-set was farther from the preference.
The dependent variables in these analyses were the differences in questionnaire and performance data between session 3, when control was first given, and session 2. The
hypothesis is that when the value of the predictor (|preferred – preset lighting|) was larger, the value of the dependent variable (session 3 – session 2 score) will be larger in the more favourable direction.
Only a few outcome measures showed statistically significant effects, but those that did were primarily in the predicted directions and all are medium-sized (Cohen, 1988). Table 9 summarises these. A larger change in CQS predicted a larger positive change in pleasure and a larger drop in arousal. A larger change in CCT predicted a larger drop in TES scores (i.e., better colour discrimination performance). The appearance of the room as colourful increased with a larger change in CRI. For these tasks, participants’ colour-tuning choices appear to have delivered conditions that reflected a more relaxed, more pleasant mood and better colour appearance, at least on two of the colour-related dependent variables.
Unexpectedly, a larger change in CRI and Δuv were both associated with a drop in the ratings of the room illumination, meaning that the room appeared less bright, distinct, and radiant the larger the change in these lighting parameters. However, the explanation becomes evident when one looks at the absolute difference in the changes. The regressions used the absolute value, but it must be noted that the direction of the change could have been in a direction that lighting professionals would consider undesirable (i.e., towards more + Δuv or lower CRI). Examination of the raw difference scores for the changes that were in effect while the room appearance scale was completed support this: the median Δuv difference score was 0.0165, meaning that more than half of the scores were larger than this; there were only four people for whom Δuv was lower during this questionnaire than it had been for the pre-set condition. Similarly, for CRI the median change during this questionnaire was towards a lower value.
Table 9. Statistically significant regression equations for the effect of having one’s preferred lighting condition in session 3.
Lighting Parameter Dependent Variable β p R2
|CQS discrepancy| Pleasure 0.36 .03 .13
|CQS discrepancy| Arousal -0.42 .01 .17
|CCT discrepancy| FM100-TES -0.36 .04 .13
|CRI discrepancy| Room – Colourful 0.34 .04 .12
|CRI discrepancy| Room – Illuminated -0.36 .03 .13
|Δuv discrepancy| Room – Illuminated -0.42 .01 .18
These analyses were a conceptual replication of the approach taken by Newsham and Veitch (2001). The no change participants had made one colour-tuning choice, at the end of the day. We calculated the difference in CCT between this choice and the pre-set spectrum to which they had been exposed and took its absolute value (CCT_DIFF_AB). Newsham and Veitch had used a median-split to create a categorical variable for the illuminance difference between desired and experienced conditions; in this case, we judged the variability in CCT_DIFF_AB to be too large for this approach to be effective. Instead, we used CCT_DIFF_AB as the independent variable in a series of multiple regression analyses of questionnaire and performance data from session 4, immediately prior to the colour-picking selection. There were no statistically significant results from this data set. We cannot rule out a lack of statistical power as the limiting factor; the sample size for these regressions was 41.
3.5 Chosen Colour Quality Effects on Colour Discrimination
This section tests Hypothesis 4:
H4: Overall, colour discrimination performance will be better for conditions with higher colour quality. (This hypothesis will be tested with the participants’ selected light source spectra.)
We tested this hypothesis using the data from the Choice group in multiple regression analyses of the FM-100 total error scores in sessions 3 and 4. The independent variables were the CRI, and CQS, and |Δuv| (because we expected that spectra lying closer to the blackbody curve should deliver better colour discrimination) of the chosen lighting conditions during the FM-100 test. Participants were permitted to change the spectrum during this task (a
methodological decision we regret in hindsight), so we took the value that had persisted the longest during the task as the value to stand for the entire test. Cases were lost from the analysis when we could not confidently identify the colour-tuning choice that had been in place during the majority of the task; this weakened the power of the tests.
Because these three parameters are highly intercorrelated, we ran separate multiple regression analyses for each as a predictor variable. For all of these analyses there were two covariates: years working as a proxy for age, to control for age-related changes in colour vision; and the performance on the FM-100 test in session 1, to control for individual differences in colour discrimination ability.
The results showed very limited support for the hypothesis but nicely demonstrate the problem of restricted range in the predictor variable. For the six regressions, one returned statistically significant results (Table 10). In session 3, the CQS value predicted FM-100 total error scores (TES), with higher CQS resulting in better performance (colour discrimination is better when TES is lower). This is a small effect, explaining slightly less than 4% of the
variance; note that the range of CQS variation is also small, from range 74 to 95 with a mean of 85 (SD = 5.1). The variability of CQS for this task in session 4 is smaller and the mean is higher (M = 87, SD = 4.7). The fact that most of the colour-tuning choices have high values for colour rendering scales probably explains the absence of statistically significant tests in this set.
Table 10. Hierarchical multiple regression results for the analysis of CQS effects on FM100 total error scores in session 3. β β β YRS_WORKING 0.059 0.004 -0.015 FM100-TES_S1 0.851 0.824 CQS_FM_S3 -0.196 R2change .003 .721*** .037* Total R2 .003 .725*** .762*** Adjusted R2 -0.028 .707 .738 Note. N = 34. * p<=.05. **p<=.01. ***p<=.001.
3.6 Assigned Spectrum Effects on Performance, Mood, and Perceptions
These analyses addressed the recurrent question of immediate effects of different light source spectrum on behaviour, and specifically they were designed to address Hypothesis 5:
H5: Overall, performance and alertness will be higher for the 6500 K group than the 3000 K group, and this will be particularly evident immediately after lunch with the absence of a post-prandial dip.
The full day’s data from the No Change group allowed us to examine the effects of the two fixed spectra (nominal 3000 K vs. nominal 6500 K) over the workday, in particular to see whether (as predicted) the cooler colour temperature had an alerting effect after the lunch period. Data from the Choice group was not included in these MANCOVA
analyses, in which years in the workforce was a covariate. Support for H5 would be evident from interactions of spectrum by time in which the various measures of reaction time and alertness would favour people in the 6500 K group in the afternoon, but not in the morning. Alternatively, it was also possible that the effects of a cooler colour temperature would be evident throughout the day in the form of a main effect of spectrum.
The results provided some support for the hypothesis in the form of main effects of spectrum on two psychomotor reaction time tasks: the conveyor belt task and the speed of responding to the envelope prompt. In both cases, participants in the 6500 K group were faster than those in the 3000 K group to respond to the stimulus provided by the task. Table 11 summarizes these findings. These effects occurred throughout the day. Although we had predicted an interaction effect of light source spectrum on afternoon alertness, we observed none.
Table 11. Estimated marginal means (and standard errors in parentheses) for reaction time measures with statistically significant effects of spectrum.
Conveyor Belt Reaction Time (ms)
Envelope Reaction Time (ms)
Multivariate Test Wilks’ Δ = 0.763, F(3,32) = 3.31, p < .05, η2 partial= 0.24 (Not applicable) Univariate Test F(1, 34) = 4.96, p < .05, η2 partial= 0.13. F(1, 23) = 4.29, p < .05, η2 partial= 0.16 3000 K 125.69 (4.23) 4960.84 (740.36) 6500 K 112.53 (3.63) 2706.92 (676.09)
There were spectrum by time interactions on two dependent measures. They were notable in that they occurred in different variable groups but followed the same pattern. There was a significant multivariate effect on lighting quality judgements (a group including
assessments of overall lighting quality, bothersome glare, flicker and overall brightness), which was associated with a statistically significant interaction of spectrum by time-linear (see Table 12). Examination of the estimated marginal means (correcting for the covariate, years working) showed that lighting quality judgements tended to increase over the day for the 3000 K group, but decreased for the 6500 K group. Similarly, for the social behaviour group there was a
statistically significant multivariate test and a significant spectrum by time-linear interaction for the salary assigned to the fictional job candidate. Expressed as standardized scores, the salary assignments increased over the day for the participants in the 3000 K group but decreased for the 6500 K group.
Table 12. Estimated marginal means (and standard errors in parentheses) for dependent variables with statistically significant interaction effects of spectrum by time
Lighting Quality – Spectrum by Time (Linear) Salary – Spectrum by Time (Linear)
Multivariate Test Wilks’ Δ = 0.373, F(8,16) = 3.37, p < .02, η2 partial= 0.63 Wilks’ Δ = 0.71, F(4,31) = 3.17, p < .05, η2 partial= 0.29 Univariate Test F(1, 23) = 7.34, p < .02, η2 partial= 0.24. F(1, 34) = 2.34, p < .01 η2 partial= 0.18 3000 K Session 1 Session 2 2.51 (0.30) -0.12 (0.20 Session 3 2.79 (0.21) -0.46 (0.13) Session 4 2.79 (0.26) 0.32 (0.20) 6500 K Session 1 Session 2 3.18 (0.30) 0.31 (0.210 Session 3 2.94 (0.21) -0.02 (0.14) Session 4 2.92 (0.26) -0.17 (0.20)
As in the analysis of the full data set for effects of colour tuning, the analysis of the No Choice group data showed main effects of time on several outcome measures, some expected and some unexpected. For cognitive performance measures (see Table 13), the results again suggest that two parallel processes occur: learning (shown in the progression to faster reaction times on the conveyor belt and lower task-switching costs for the easy switches), and fatigue (shown in the quadratic and cubic shapes for the changes in hit rate and the task-switching costs). There was no effect of time on the envelope reaction time in this subset, but this is explainable in the lower power of the smaller sample size.
Table 13. Main effects of time on measures of cognitive performance in the No Choice group. Conveyor Belt Task-Switching
Multivariate Test Wilks’ Δ = 0.283, F(9, 26) = 7.30, p < .000, η2
partial= 0.72
Wilks’ Δ = 0.527, F(6, 30) = 4.48, p < .01, η2
partial= 0.47
Univariate Test Reaction Time Hit Rate Easy
Linear F(1, 34) = 5.85, p < .03, η2 partial= 0.15 F(1, 35) = 10.35, p < .01, η2 partial= 0.23 Quadratic F(1, 34) = 7.81, p < .01 η2 partial= 0.19 F(1, 35) = 6.56, p < .02, η2 partial= 0.16 Cubic F(1, 34) = 4.57, p < .05, η2 partial= 0.12 F(1, 35) = 5.90, p < .02, η2 partial= 0.14 Session 1 124.77 (3.82) 0.57 (0.04) 1.89 (37.45) Session 2 118.63 (2.99) 0.69 (0.03) 87.98 (26.28) Session 3 116.22 (2.89) 0.64 (0.03) -38.83 (27.00) Session 4 116.80 (2.58) 0.65 (0.04) -128.61 (37.16)
The results for the measures of comfort are seen in Table 14. Over the course of the day, visual discomfort increased (linear effect), but it did so with the largest increase between session 1 and 2; the quadratic and cubic effects describe the small changes seen for sessions 3 and 4. For physical discomfort, there is no overall linear effect (i.e., the session 4 value is not significantly different from the Session 1 value), but there was an increase from session 1 to session 2 followed by reductions in sessions 3 and 4. The thermal comfort measures (which were not recorded in session 1) show that participants felt progressively warmer over the day (the ASHRAE scale, scored here 0-100) and wanted to feel cooler (the McIntyre scale).