Assessing United States Hurricane Damage under Different Environmental Conditions by
Anastasia Francis Maheras
S.B. Earth, Atmospheric, and Planetary Sciences Massachusetts Institute of Technology, 2011
Submitted to the
Department of Earth, Atmospheric and Planetary Sciences in Partial Fulfillment of the Requirements for the Degree of
Master of Science in Atmospheric Science at the
Massachusetts Institute of Technology
September 2012
0 2012 Massachusetts Institute of Technology. All rights reserved.
Author Certified by Accepted by
ARCOHNES
;"-IUTE-0 52312
Department of Earth, Atmospheric, and Planetary Sciences August 10, 2012
Kerry A. Emanuel Cecil & Ida Green Professor of Atmospheric Science Thesis Supervisor
Robert D. van der Hilst Schlumberger Professor of Earth Sciences Head, Department of Earth, Atmospheric, and Planetary Sciences
Assessing United States Hurricane Damage under Different Environmental Conditions by
Anastasia Francis Maheras
Submitted to the Department of Earth, Atmospheric and Planetary Sciences on August 10, 2012 in Partial Fulfillment of the Requirements for the
Degree of Master of Science in Atmospheric Science
ABSTRACT
Hurricane activity between 1979 and 2011 was studied to determine damage statistics under different environmental conditions. Hurricanes cause billions of dollars of damage every year in the United States, but damage locations and magnitudes vary from year to year. Seasonal
hurricane forecasts predicting the strength of the upcoming hurricane season have the potential to be used by many industries and sectors to reduce and mitigate the effects of hurricanes.
However, damage itself is not predicted by these forecasts. This work analyzed trends in
hurricane damage due to atmospheric and oceanic conditions, and the results could be applied to and included in seasonal hurricane forecasts, thus increasing forecast applicability and value. This work used synthetic hurricane tracks generated from background climate conditions, a U.S. property portfolio, and a damage function based on wind speed to determine 1979-2011
hurricane damage. Damage was split into La Nifia/El Niho and pre-/post- 1995 year sets to determine spatial and temporal trends in U.S. hurricane damage. This work concluded that different regions of the country experienced more or less hurricane damage under different environmental conditions. Knowledge of these trends can be applied to seasonal hurricane forecasts and can influence property owner, regulator, and insurer behavior across the nation.
Thesis Supervisor: Kerry A. Emanuel
ACKNOWLEDGMENTS
I would like to thank the following people for their help throughout the thesis process:
Kerry Emanuel for his help, commitment, guidance, and the time he gave me during the research, modeling, and writing process.
My committee members Sai Ravela, Michael Greenstone, and Muhamet Yildiz for their
assistance in narrowing my topic, commitment, and providing feedback.
Lixin Zeng and Jeffrey Gall of Validus Re for providing the property portfolio data.
Lastly, my friends and family for giving me moral support during the year and my parents for inspiring me to pursue science.
TABLE OF CONTENTS A BSTRA CT...3 A CKN O W LEDGEM EN TS ... 4 CON TEN TS ... 5 LIST OF FIGURES ... 7 LIST OF TABLES ... 8 Section 1. IN TROD UCTION ... 10
2. LITERA TURE REVIEW ... 12
2.1 Hurricanes ... 12
2.2 United States Hurricane Dam age... 17
2.3 Seasonal Hurricane Trends and Predictions ... 18
2.4 Property Insurance ... 22
2.5 Reinsurance... 24
2.6 Insurance Regulation ... 26
2.7 Applying Seasonal Hurricane Forecasts ... 27
3. M ETH OD S ... 29
3.1 Synthetic Hurricane G eneration... 29
3.2 ZIP Code Property Portfolios... 29
3.3 D am age Calculation . ... 33
3.4 D am age Analysis... 33
4. RESU LTS...35
5.1 Overall D am age ... 37 5.2 EN SO D am age... 38 5.3 1979-1994/19952011 D am age ... 41 5.4 Set Convolutions... 43 6. CONC LUSION ... 45 BIB LIOGRAPH Y ... 47
LIST OF FIGURES
Figure 1. Hurricane Irene, August 26, 2011... 12
Figure 2. Worldwide Tropical Cyclone Distribution ... 16
Figure 3. Climatological Hurricane Origin Area and Typical Tracks for the Month of S eptem b er ... . 16
Figure 4. Example of Wind Strength for Hurricane Andrew ... 17
Figure 5. NOAA Seasonal Hurricane Forecast from 2011 ... 19
Figure 6. The Approximate Location of the Sahel Region of Sub-Saharan Africa ... 20
Figure 7. Equatorial Pacific Conditions ... 21
Figure 8. U.S. Daily Dry-Gas Production the Impacts of Hurricanes... 27
Figure 9. ZIP Code Locations for the First Portfolio ... 30
Figure 10. Florida ZIP Code Locations... 31
Figure 11. Total Insured Property Value by ZIP Code ... 32
Figure 12. Total Insured Property Value by ZIP Code for the State of Florida... 32
Figure 13. Average Annual Hurricane Damage 1979-2011... 37
Figure 14. Florida Average Annual Hurricane Damage 1979-2011 ... 38
Figure 15. ENSO Hurricane Damage Comparison 1979-2011... 39
Figure 16. Florida ENSO Hurricane Damage Comparison 1979-2011 ... 40
Figure 17. 1979-1994/1995-2011 Hurricane Damage Comparison... 42
LIST OF TABLES
Table 1. The Saffir-Sim pson Scale ... 14
Table 2. The Six Most Devastating U.S. Storms through 2005... 15
Table 3. Hurricane Damage Year Sets... 34
1 INTRODUCTION
Hurricanes are a powerful force of nature that affect the United States in many different ways, including deaths from massive flooding in coastal cities, billions of dollars of damage due to infrastructure destruction, and a loss in total national economic productivity. Many sectors of the
U.S. economy are affected by hurricanes, from oil extraction in the Gulf of Mexico to
agricultural production elsewhere in the nation, and the direct effects of hurricanes-especially property damage-are felt across the southeastern and eastern regions of the country nearly every hurricane season. The insurance industry covers much of the property destruction by issuing property insurance and paying out property insurance claims. Local building codes and government programs also protect against and mitigate hurricane damage. However, the large variability in hurricane damage from year to year due to differences in hurricane frequency, intensity, and landfall location makes it difficult for all relevant actors to determine how much damage to be prepared to address in a given year. If damage is extreme over a short period of time or very concentrated in one region, losses can be even more severe due to the inability of insurance firms, government programs, and local communities to adapt and respond to such damage; rebuilding from extreme disasters can take decades. Long gaps in hurricane activity in a particular region can cause communities and legislators to be unprepared for large-scale disasters when they do occur.
Variability in hurricane activity results from large-scale atmospheric and oceanic patterns, and understanding these patterns provides a great benefit to the country by allowing for the
prediction of upcoming hurricane activity and greater storm preparation where it is needed. Seasonal hurricane forecasts are made every year, and applying our increasing understanding of the effects of atmospheric conditions on hurricane activity and damage can enhance and improve such forecasts. For example, property owners could take steps to ensure that their homes were properly equipped to sustain high winds when the risks of hurricane damage were high. They could also be reminded or prompted to purchase additional property insurance during high risk seasons. In the wake of large disasters, government assistance programs could be mobilized faster and more prepared to address the hurricane risks of a particular season. Construction firms and developers could focus on designing and building homes that were built to higher standards if they were more aware of the types and levels of hurricane damage in certain regions.
Previous work by Emanuel et al. (2012 ) examining the economic value of seasonal hurricane forecasts to the insurance industry has shown that, even with imperfect forecasting, insurance firms can accumulate revenue in the order of decades by applying seasonal hurricane forecasts to purchase the optimal amount of reinsurance regardless of how many storms actually make landfall. Increasing our understanding of hurricane damage variability and timing would further enhance the usefulness of seasonal hurricane forecasts to many other sectors in the U.S. economy as well, such as banks and other financial institutions, regulators, reinsurers, capital markets, and rating agencies (Kunreuther et al., 2009). Actors on all levels-from local construction firms to state-level regulators and national emergency response organizations-would be able to apply to seasonal hurricane forecasts due to the far-reaching impacts of hurricanes. Due to the
international nature of reinsurance and capital markets, the international community would also derive benefit from improving hurricane forecasts.
This work seeks to analyze hurricane damage under different environmental conditions, mainly the different modes of the El Nifio/Southern Oscillation (El Nifto and La Nifua) and hurricane activity pre-1995 and post-1995 in order to eventually improve the applicability and value of seasonal hurricane forecasts. First, background environmental conditions from 1979 to 2011 were used to generate a set of 9900 synthetic hurricane tracks representative of storms that would occur during those years. These hurricanes interacted with a property portfolio of insured
properties in over 13,000 ZIP codes along the U.S. East and Gulf coasts. Property damage was calculated by analyzing the maximum wind speed of each storm at each ZIP code location. Finally, the damage was divided into sets of interest (such damage from storms occurring during La Nifla conditions) and was compared in order to determine trends in hurricane damage during different environmental conditions and climate states. By doing so, this work adds to the knowledge necessary to make seasonal hurricane forecasts that are accurate, easy to interpret, and applicable to those using them. Additionally, it will draw attention to the ways seasonal hurricane forecasts could be applied. Also, since this work relies on a larger dataset of damage
compared to historical damage records, trends in hurricane damage can be more fully understood.
Section 2 of this paper will review important scientific and economic concepts relating to hurricane damage and hurricane forecasting. Section 3 will review the methods used to generate the synthetic hurricane tracks and estimate damage. Section 4 will portray the results of this
calculation. Section 5 will analyze and discuss spatial and temporal damage trends, and Section 6 will offer final conclusions and suggestions for additional research.
2 LITERATURE REVIEW
In order to analyze trends in hurricane damage over time and under different environmental conditions and climate states, several concepts and topics are important to review. First, the science of hurricanes and the mechanisms by which hurricanes cause damage must be understood. Both of these topics lead to a discussion of seasonal hurricane trends, how the strength of an upcoming hurricane season can be predicted, and how global climate change may alter season strength and current seasonal trends. Property insurance and reinsurance in the United States must be discussed in order to gain an accurate understanding of how insurance firms manage the risk of hurricane damage. The regulatory framework of insurance will also be examined. Finally, hurricane damage mitigation through the use of seasonal hurricane forecasts and hurricane prediction will be discussed. After these key areas are understood, the damage caused under different climate conditions and the implications of these damage trends can start to be assessed and discussed.
2.1 Hurricanes
Tropical cyclones-known as hurricanes in the Atlantic Ocean basin-are large, strongly rotating organized storms with intense rainfall and high wind speeds. They are about 400 km across and reach from the ocean surface to the tropopause, which is about 12 to 16 km above sea level, although they can be quite small (around 75 km in diameter) as well (see Figure 1). The eye of a hurricane comprises about 40-100 km of the diameter of a hurricane. Hurricanes generally have a circular shape, but are often horizontally asymmetric.
Figure 1. Hurricane Irene, August 26, 2011. An example of a hurricane as viewed from space. Note the spiraling bands, asymmetric shape, and scale relative to the United States. From NASA Earth Observatory.
At the surface, very high wind speeds are directed from the outside of the hurricane in toward the center of the storm in a spiraling pattern. The spiraling pattern is the result of frictional forces at the surface of the ocean; without these friction forces, the winds would circulate around the low-pressure center without spiraling inward, which is observed at upper levels in a hurricane due to the lack of friction. Wind speeds increase going toward the eyewall of a hurricane at a rate of about r-v. Wind speeds decrease with height, and the strongest winds are found at the surface near the eyewall.
In the Northern Hemisphere, hurricanes have a counterclockwise circulation at the surface of the ocean due to the sign of the Coriolis parameter. The circulation is centered on the eye of the hurricane, where there is little circulation or convection and low wind speeds; due to the minimal convection in the eye of a hurricane, there is very little rainfall there as well. Surrounding the eye is a region known as the eyewall. The eyewall is the location of the most intense rainfall of a hurricane. The eyewall is not vertical, but has a slope of roughly 450 out from the eye. At the top of a hurricane (normally at the tropopause), the winds rotate in the opposite direction (clockwise in the Northern Hemisphere). It is important to note that Southern Hemisphere tropical cyclones rotate clockwise at the surface due to the different sign of the Coriolis parameter in that
hemisphere.
Hurricanes are powered by heat flow that arises because the warm tropical ocean and the
atmosphere above it are not in thermodynamic equilibrium. It is the process of heat transfer from the ocean to the atmosphere that causes the complex structure and motions of a hurricane. Most of the heat transfer is in the form of evaporation, and the entire hurricane acts as a Carnot engine. In the first step of this process, dry air flows from the outside of a hurricane in toward the low pressure eye near the surface. The wind direction is determined by the frictional forces at the surface and the Coriolis parameter, which cause the air to spiral inward. As the air travels along the ocean, evaporation transfers heat from the sea to the air and the entropy of the air increases. During this part of its trajectory, the air undergoes nearly isothermal expansion. Wind speeds increase due to the conservation of angular momentum, and the frictional force of the air
interacting with the ocean surface adds additional heat to the air. At the eyewall of the hurricane, wind speeds are the highest, and the air travels adiabatically upward along the eyewall. Due to the high water content of the air at this point, rainfall is intense as the air rises and condensation occurs. At the top of the storm, the air spirals out toward the edges of the hurricane in the opposite direction as the rotation at the surface. At the top of the storm, temperatures are much lower compared to the surface, and entropy is lost as infrared radiation is exported to space. The compression at these heights is nearly isothermal. The air then begins to fall adiabatically toward the surface, where it enters the cycle again (Emanuel, 2006). Hurricanes begin to dissipate when they are no longer fueled by the warm, moist ocean, which is why their intensity normally lessens over land.
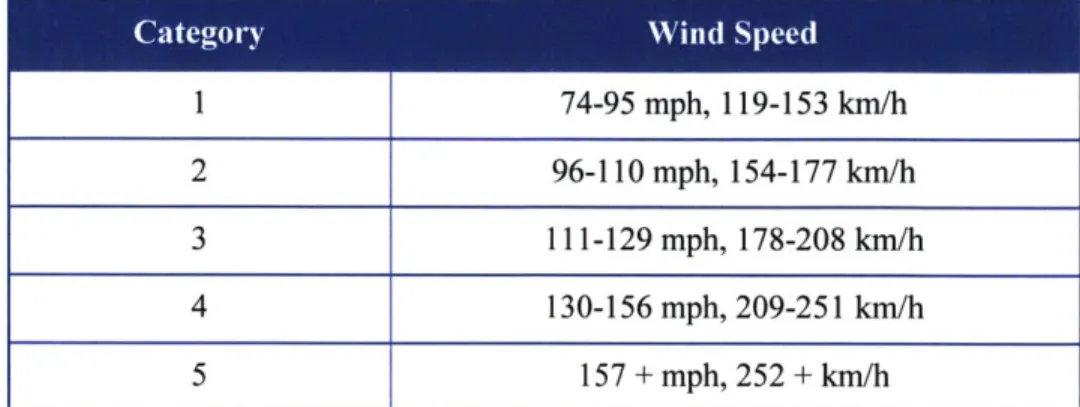
To be classified as a hurricane, a storm must have a maximum 1-minute average wind speed at an altitude of 10 meters above the surface of at least 74 mph; less intense storms are classified as tropical depressions (maximum sustained wind speeds of 38 mph) or tropical storms (wind speeds of 39-73 mph). Hurricanes are divided into categories of the Saffir-Simpson scale depending on their wind speed, shown in Table 1.
Table 1. The Saffir-Simpson Scale. Note that this table reflects the changes made to the Saffir-Simpson scale in 2012. 1 74-95 mph, 119-153 km/h 2 96-110 mph, 154-177 km/h 3 111-129 mph, 178-208 km/h 4 130-156 mph, 209-251 km/h 5 157 + mph, 252 + km/h
Since hurricanes rotate counterclockwise in the Northern Hemisphere while embedded in the background flow of the tropics, actual wind speeds of the hurricane differ on different sides of the hurricane; a southerly background flow makes wind speeds on the east side of a hurricane higher than on the west side. Hurricanes move at different speeds depending on the background
flow, and the average hurricane translation speed is between 15 and 20 mph (NOAA-Hurricane Basics, 1999). Hurricanes have been known to travel as fast as 60 mph (NOAA-Hurricane Basics, 1999).
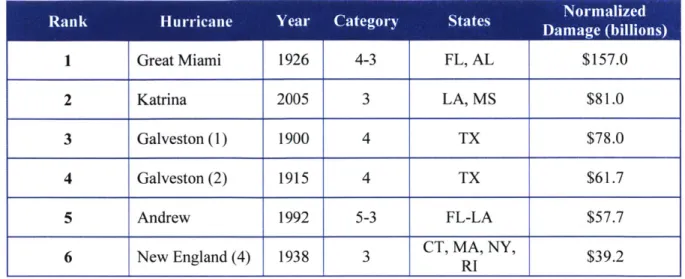
Since hurricanes are such large phenomena and move so slowly, they are easily tracked with modern technology such as satellites, ships and buoys, aircraft, and radar, which allows for the forecasting of individual hurricane tracks (NOAA-Hurricane Basics, 1999). Such forecasting is essential for evacuation notification and other emergency preparation efforts. A summary of some of the most devastating U.S. storms and their Saffir-Simpson categories is presented in Table 2. It is important to note that major hurricanes (categories 3-5) account for only 24% of landfall events but 84% of normalized damage (Pielke et al., 2008). Also, it is important to note that the ranking of storms in Table 2 is based on the amount of damage that would have occurred if the hurricanes had affected today's infrastructure rather actual damage incurred, which
Table 2. The Six Most Devastating U.S. Storms through 2005. Note that this table is based on normalized damage data, which takes into account inflation, reported damage, real wealth per capita, and the coastal county population. Data from Pielke et al. (2008).
1 Great Miami 1926 4-3 FL, AL $157.0
2 Katrina 2005 3 LA, MS $81.0
3 Galveston (1) 1900 4 TX $78.0
4 Galveston (2) 1915 4 TX $61.7
5 Andrew 1992 5-3 FL-LA $57.7
6 New England (4) 1938 3 CT, MA, NY, $39.2
The exact mechanism behind hurricane formation is not known (see Ramage, 1959; Sadler, 1979; Shapiro, 1977; Bosart and Bartlo, 1991; Montgomery and Farrell, 1993; Sobel and Bretherton, 1999; and Moller and Montgomery, 1999). It is understood that hurricanes require some sort of independent external disturbance to form, meaning that spontaneous storm genesis does not occur given normal background conditions (Riehl, 1948). Typically, hurricanes form over warm oceans (Palmen, 1948; Shapiro and Goldenberg, 1998). Genesis can only occur when there is small vertical shear in the horizontal wind, which helps dictate the temporal and spatial tropical cyclone distribution across the world, as is shown in Figure 2 (Gray, 1968; Gray, 1984; Shapiro and Goldenberg, 1998). Hurricane genesis is normally clustered in the main
development region (MDR), which extends from 5'N to 20'N and from Central America to the coast of Africa (Goldenberg and Shapiro, 1996; Mo, 2000), and the initial disturbance is often provided by African easterly waves or by baroclinic disturbances from higher latitudes.
Hurricanes are spawned from cloud clusters associated with such systems. Eventually, if conditions are satisfactory, hurricanes mature and their wind speeds intensify as the Carnot engine processes are intensified. After the storm matures, it eventually dissipates, which
generally occurs when it makes landfall because the heat engine can no longer be maintained due to the fact that there is no longer warm, moist air supplying the hurricane with energy.
Dissipation also occurs when tropical cyclones move over colder water. However, storms can take several days to dissipate as they move inland. Therefore, weakened hurricanes (normally classified as tropical depressions or storms at that point in time) can continue to cause damage due to heavy rainfall and higher than normal wind speeds as they move inland.
Tropical cyclones form in several regions that have high sea surface temperatures as well as thunderstorm clusters, as is shown in Figure 2.
Figure 2. Worldwide Tropical Cyclone Distribution. Note the direction of tropical cyclone movement. From NWS JetStream Online School, 2011.
These regions include the western Pacific near Australia and China, the Indian Ocean, the eastern Pacific near the coast of Mexico, and the eastern Atlantic Ocean near the coast of Africa. Many of the hurricanes that affect the eastern seaboard of the United States form off the coast of Africa in the MDR and travel westward toward the Caribbean. After formation, hurricanes move in the direction of the background wind and are influenced by other weather systems, but also move because of their own induced flow caused by the rotation of the earth. Although hurricanes are tropical storms, they do not form over the equator because the Coriolis parameter is zero there.
There are many possible tracks a hurricane can take depending on the exact structure of the hurricane itself and the background flow. For example, hurricanes formed off the coast of Africa
can move west and make landfall over islands in the Caribbean. They can have slightly different tracks and can make landfall in the Gulf of Mexico or the coast of Florida. Hurricanes can also travel northward and up the coast of the United States and can reach as far as the North Atlantic,
as is shown in Figure 3.
Ej Likely Mo KIre Likel-y
SEPTEMBEFR NOAA
Figure 3. Climatological Hurricane Origin Area and Typical Tracks for the Month of September. From NWS National Hurricane Center, 2012.
Although hurricanes can make landfall all over the eastern coast of the United States and can even travel to Europe, they generally become less intense by the time they reach those distances from the MDR. Therefore, regions in the southeast United States suffer much more hurricane damage because more intense storms make landfall in that region; this area is simply closer to the region of hurricane formation and in the path of the majority of hurricanes compared to other parts of the country. However, as shown in Table 2, devastating hurricanes affect New England as well. The damage caused by storms outside of typical landfall regions is in part due to the lack of storm readiness in these regions.
2.2 United States Hurricane Damage
Hurricanes cause damage in three main ways: intense winds, storm surges caused by winds, and flooding from heavy rainfall.
Depending on the exact wind speed, hurricanes cause different amounts of damage, and the Saffir-Simpson categories listed in Table 1 are also associated with expected damage levels. The high winds of hurricanes can destroy buildings and mobile homes. These winds can also destroy nature as well; trees can be ripped out of the ground and ecosystems can be extremely disrupted. Hurricane winds cause debris to fly through the air, which can add to destruction, as seen in Figure 4. Generally, the level of damage caused by high winds is also dependent on the type of infrastructure and building codes in place at a particular location
Figure 4. Example of Wind Strength from Hurricane Andrew. Note that a board has been driven through the trunk of a palm tree, demonstrating the missile nature of flying objects during a hurricane (NCEP National Hurricane Center Hurricane Andrew Report, 2005).
Hurricanes cause storm surges, which are domes of water that make landfall and proceed inland. Storm surges form because the winds of the hurricane push a wave of water ahead of the storm as it travels. They can be particularly devastating, and the storm surge from the 1900 Galveston,
Texas, hurricane swept away at least 6000 people (International Hurricane Research Center Hurricane Hazards Pamphlet).
Finally, hurricanes cause damage by flooding. Around the eyewall of a hurricane, the rain can be intense enough to cause floods; flooding can occur fairly far inland even after the winds of the hurricane have dissipated. Since the rainfall is so intense, floods can arise quickly and can take a community off guard. With the increase in human infrastructure and the reduction of natural drainage systems, flooding is an increasing hazard. It is important to distinguish between flooding from hurricanes due to rainfall and flooding due to storm surges because storm surges can cause more damage as the wave of water progresses inland at high speeds. Also, these types of damage may be treated differently by insurers.
High winds speeds, storm surges, and flooding can cause the subsidence, inundation, and erosion of the coast as sand is removed by the storm, which can be especially dangerous to coastal infrastructure and natural ecosystems (IHRC Hurricane Hazards Pamphlet). The destruction of barrier islands and wetlands near the coast is dangerous as well because these natural structures protect coastal cities from direct hurricane landfalls; if these natural defenses are destroyed, hurricanes could become even more damaging.
Through the damage-producing mechanisms listed earlier, hurricanes cause billions of dollars of damage to property and can be quite deadly. All hurricanes cause damage because of their high winds; even high winds not associated with hurricanes can cause damage to buildings and trees, such as during thunderstorms. Generally, hurricanes of a higher category cause more damage, as can be seen in Table 2. The highest death toll associated with a U.S. hurricane was about 8000 and occurred in 1900 in Galveston, Texas (Blake et al., 2011). Globally, the deadliest tropical cyclone occurred in 1970 and killed hundreds of thousands of people as it made landfall in Bangladesh (Frank and Husain, 1971).
Hurricanes have caused an increasing amount of damage over time because the population and infrastructure near the coast have increased (Emanuel, 2005; Pielke et al., 2008; Blake et al.,
2011). However, after normalizing for damage over time, this trend becomes much less clear, as
is seen in Table 2, which shows that only two of the six most potentially devastating storms (in terms of damage) have occurred since 1940 (Pielke et al., 2008). Development has been
increasing in high-risk areas; coastal counties only comprise 17% of total continental land area but are home to 53% of the nation's population (153 million people) (Crowell et al., 2007). That number is expected to grow by more than 12% by 2015 and implies that more of the country's population, infrastructure, and economy will be at risk (Crossett et al., 2007). As infrastructure demands increase and more businesses, industries, and individuals are put at risk, the potential for hurricane-related national and global economic damage increases as industries and financial systems become more interdependent and exposed to the effects of U.S. hurricane activity. 2.3 Seasonal Hurricane Trends and Predictions
Hurricane season strength varies from year to year, and predicting the strength of an upcoming hurricane season can be done several months in advance of the hurricane season itself by examining the conditions of the background climate state. Generally, revised forecasts are
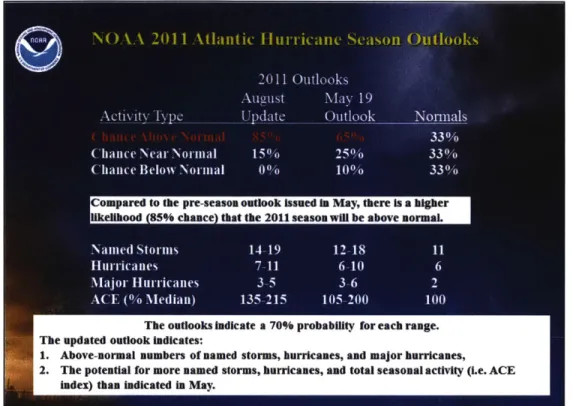
released closer to the start of the hurricane season. The Atlantic hurricane season lasts form about June until late November and peaks during September. Many groups release independent seasonal hurricane forecasts, including universities, the National Oceanic and Atmospheric Administration's Climate Prediction Center, and weather groups such as The Weather Channel and AccuWeather. An example forecast from the Climate Prediction Center can be seen in Figure 5.
Figure 5. NOAA Seasonal Hurricane Forecast from 2011. Note the detailed statistics and change in forecast as the season progressed. From the NOAA CPC.
When seasonal hurricane forecasts are released, they may relate whether an upcoming hurricane season will be more active or less active than the current year or trend, that is, whether the number of storms during the upcoming hurricane season will be higher or lower than in previous years. Some forecasts go as far as listing predictions for the number of hurricane days, the number of named storms, and the probability of landfall in particular regions of the country
(Klotzbach and Gray, 2012).
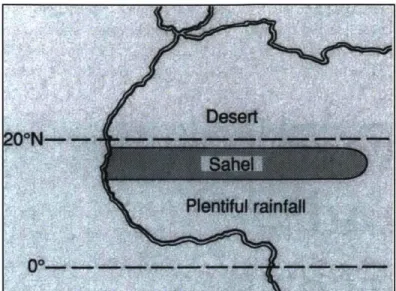
Seasonal hurricane forecasts can be made because of the influence of background climate trends on hurricane genesis and track location. There are many theories as to what kinds of climate phenomena may affect the strength of a hurricane season, including the El Niflo/Southem Oscillation (ENSO), the Atlantic multidecadal oscillation (AMO), and West African Sahel (shown in Figure 6) rainfall (Gray, 1984; Gray, 1990; Landsea and Gray, 1992; Landsea et al.,
1999; Goldenberg et al., 2001). The exact relationship of all these phenomena to the activity of a hurricane season is not yet understood as these events combine in synergistic ways (Bell and
Chelliah, 2005). However, the general consensus is that the El Niuo/Southern Oscillation plays a
Figure 6. The Approximate Location of the Sahel Region of Sub-Saharan Africa. From Gray (1990).
The El Niio/Southern Oscillation is a phenomenon that results from the perturbation of the Walker Circulation away from its basic state. The Walker Circulation describes the relationship between the atmosphere and ocean motions in the equatorial Pacific. Easterly trade winds blowing at the equator cause divergent ocean flow toward the poles and away from the equator, which results in an ocean upwelling. Due to the geometry of the ocean basin, this upwelling is enhanced at the eastern side of the basin near South America. The cold water upwelling at the eastern edge causes a zonal sea surface temperature gradient, which generates an instability in the atmosphere-ocean system. This instability induces atmospheric convection over the area where surface waters are the warmest (in the western Pacific), which results in a region of enhanced precipitation. Once the air has risen vertically, it follows the general westerly atmospheric flow and returns to the eastern Pacific, where the dry air descends and begins the cycle again.
When the east-west sea surface temperature gradient is enhanced due to increases in surface winds and upwelling water, the condition is known as La Nifia. In this scenario, convection and rainfall extend farther west than under normal Walker Circulation conditions and the eastern Pacific is colder than normal. Conversely, if the sea surface temperature gradient is reduced due to decreased winds and ocean upwelling, the condition is known as El Niu'o. The converging cell is pushed eastward and the eastern Pacific is warmer than average. All three conditions can be seen in Figure 7.
Normal Conditions
Figure 7. Equatorial Pacific Conditions. These three illustrations show the Walker Circulation (top), La Nifia (1), and El Nifto (r). The contours indicate sea surface temperatures. Note the shift in the thermocline position and angle, sea surface temperatures, and the location of convection for the different conditions.
NOAA/PMEL/TAO Project Office.
The El Niuo/Southern Oscillation has a period of about 3-5 years while the conditions themselves last on the order of one year and are at their most intense between December and
April (National Weather Service Climate Prediction Center).
ENSO is a large-scale phenomenon that itself alters the background climate state of the earth
beyond the Pacific Ocean region. One of the main effects of ENSO is to change the winds of the Caribbean and western equatorial Atlantic region (Gray, 1984). As described earlier, hurricane genesis and development is promoted when there is reduced vertical shear in the horizontal wind over the Atlantic, which corresponds to La Nifia conditions (Gray, 1968; Gray, 1984; Shapiro
and Goldenberg, 1998). According to theory, during El Nifno conditions, there would reduced
hurricane activity in the Atlantic Ocean basin while during La Ni'a years there would be increased hurricane activity, which is a trend supported in observed hurricane statistics (Gray,
1984; Goldenberg and Shapiro, 1996; Bove et al., 1998; Pielke and Landsea, 1999; Bell and Chelliah, 2005). It is the peak in ENSO activity between December and April and observations
of other oscillation activity that allow for seasonal hurricane forecasts to be made several months
tamsoW
I
El Niito Condtlons
Like any other atmospheric and ocean process, ENSO is affected by the background climate state, which means that events like El Nif5o and La Nifia would change in duration and period under different climate regimes. The effect of global climate change on hurricanes and hurricane damage has been researched intensely over the past few decades (see Emanuel, 1987; Yoshimura
et al., 2006; Emanuel, 2008; Emanuel et al., 2008; Bender et al., 2010; Knutson et al., 2010; Emanuel, 2011; and Mendelsohn et al., 2012), resulting in a general consensus that overall
hurricane frequency will decrease, but that the frequency of high intensity storms will increase. The increase in intensity will in turn cause a rise in hurricane damage and economic costs regardless of the ENSO state, although these effects are influenced by infrastructure, population, and development changes (mentioned in Section 2.2) and may not vary uniformly as hurricane intensity increases (Pielke et al., 2008; Mendelsohn et al., 2012). Extending global climate change concepts to seasonal hurricane forecasts would improve their accuracy over time. Another observable trend in hurricane statistics is that Atlantic basin hurricane activity has increased since 1995, with an average of 3.9 major storms (categories 3-5 on the Saffir-Simpson scale) per year occurring since 1995 compared to 2.7 large storms per year occurring between
1950 and 2006 (Landsea et al., 1998; Lonfat et al., 2007). The exact cause behind this trend is
not well understood, although most scientists believe that the root cause of such an increase is related to increased sea surface temperatures, which may or may not be a result of long-term climate oscillations or global warming (Landsea et al., 1998; Goldenberg et al., 2001; Trenberth
and Shea, 2006; Webster et al., 2005; Lonfat et al., 2007). Overall, there is still much debate on
the cause of this increase in hurricane activity.
2.4 Property Insurance
Property insurance provides a way to reduce the risks associated with hurricane damage; having property insurance will not reduce the risk of hurricane damage occurring, but will reduce the financial risk to a homeowner in the case that hurricane damage does occur. The way insurance works is that a risk-averse person-in this case a homeowner-purchases a policy from an insurance firm for which they pay a premium. If damage to the property occurs, the homeowner files a claim with the insurance firm and is (potentially) given money by the firm to repair the damage or reimbursed for repair costs over the policy deductible. Insurance firms are able to function because not every policyholder will file a claim regularly; every policyholder's premium is combined to be used for paying out claims.
For a basic example, if 5000 policyholder each paid a premium of $100, the insurance firm would be able to pay out $500,000 worth of claims, provided there were no overhead costs or dividends. If one policyholder's home was destroyed by a fire, then the money he/she would receive will come out of the pool of money contributed to by all policyholders. Whether people purchase insurance depends on their risk aversion, which is a measure of how much a person will pay to avoid a risk. In the case of insurance, people continue to pay premiums even if they do not have damage to their property in case damage does occur later. People with different degrees of risk aversion will purchase different amounts of insurance; they are balancing their short-term financial loss (the premium) with "peace of mind" and the risk of much more substantial financial loss should damage occur. Since damage may not occur regularly, some homeowners
may be inclined to not carry insurance. This act could either represent a risk preferring individual or an overconfident individual who does not understand the nature of probability and disaster return periods (Sandroni and Squintani, 2007); not suffering hurricane damage for several years does not mean there will not be another hurricane.
In reality, property insurance is much more complex than the example shown above. Property insurance policies do not cover certain types of damage, including, in the United States, damage
from flooding. However, most policies do cover damage from wind, rain, hail, wind-driven rain, and lightning (FEMA, 2005). Policyholders may be limited to a certain number of claims per year and are rarely ever fully insured from damage, meaning that the homeowner pays for damage up to a certain level (the deductible), after which insurance coverage kicks in. Potential claims are often capped by insurance firms; this cap may be premium-dependent. Homeowners that live in risky locations-such as coastal areas with a history of hurricane damage-may not be able to procure private insurance at all. Private insurance is heavily regulated by state governments, which place caps on insurance premiums to improve affordability and equity
(Kunreuther et al., 2009). In high-risk areas, insurance firms may simply not be able to charge
the premiums required for continued firm operation due to the large amount of capital required, risks present, and government regulations capping premiums.
In some cases, the government has stepped in to provide insurance or insurance assistance programs to people deemed not insurable by private firms, as is the case with the National Flood
Insurance Program (NFIP). The National Flood Insurance Program provides flood insurance through partnerships with private insurers and local communities and mandates that a community must adopt and enforce sound floodplain management regulations and ordinances (NFIP
Partnership, 2012). Congress has introduced dozens of bills over the past 30 years regulating the
insurance industry and providing more financial support during catastrophic natural disasters
(King, 2005). There can be confusion in the public because of the complicated nature of damage
coverage between insurance types and plans, and information dissemination and government regulation have helped address this confusion.
As mentioned earlier, hurricanes cause damage through flooding (either storm surge flooding or rainfall flooding) and high wind speeds. In the United States, property insurance only covers damage from wind, meaning that damage caused by flooding is not covered. For example, it is estimated that after Hurricane Katrina in 2005, the NFIP covered $25.8 billion of damage, while insurance firms covered $41.1 billion of damage (Knabb et al., 2011). However, not all property was insured, and the entire hurricane is thought to have caused about $108 billion of damage
(Blake et al., 2011; Knabb et al., 2011). Note that this estimate is significantly higher than the
estimate by Pielke et al. (2008) in Table 2. While Hurricane Katrina was one of the most
expensive storms in United States history (depending on the normalization technique used), these values indicate the large economic activity generated by the insurance and construction
industries in the United States due to hurricane damage alone (Pielke et al., 2008). Even Hurricane Irene in 2012, which was a category 1 hurricane when it made landfall in the United States, cause $15.8 billion of damage in the United States and killed 41 people (Avila and
Due to the financial risk hurricanes present to the insurance industry, property insurance firms have worked to reduce their own financial risk by limiting the number of policies they offer in particular regions; since the theory behind insurance only works when a small number of people file claims compared to the number of policies issued, catastrophic localized events like
hurricanes can bankrupt insurance firms that are not sufficiently diversified. Referring back to the previous example of 5000 policyholders each paying a $100 premium, two homes being destroyed completely by a fire will be coverable, while a hurricane that decimated the entire community would not. In order to become diversified, firms may offer different types of policies, such as property insurance as well as life insurance, and may operate in different states, regions, or countries. They may also purchase reinsurance, which will be reviewed in the following section. As mentioned earlier, insurance firms are somewhat restricted in setting insurance premiums at levels necessary to be able to cover high-risk areas. Even with regulation, insurers work to set premiums at levels necessary to ensure their economic viability in the long and short term (Grace and Klein, 2009). For example, as a whole, the insurance industry had negative profits from 1985 until at least 2006 in the state of Florida, which illustrates the importance of long-term insurance planning (Grace and Klein, 2009).
Insurance firms face a challenge due to information asymmetries between the policyholder and the firm. Policyholders have more information about their risk level than insurance firms, which can lead to the problem of adverse selection (Rothschild and Stiglitz, 1976; Stiglitz, 1977;
Wilson, 1977; Arnott and Stigliz, 1988; Chiappori et al., 2006); the riskiest part of the population
will want the most insurance, meaning that the insurance firm will have to assume that everyone seeking to purchase insurance is high risk and thus a costly investment (Akerlof 1970; Dahlby,
1983). Adverse selection may be solved by working to reduce information asymmetries between
insurance firms and policyholders, which is normally done at the point of sale (Villenueve, 2000; Chiappori et al., 2006). The issue of adverse selection is especially a concern in the health
insurance and life insurance sectors, makes it difficult to obtain a policy, and increases premium levels. Moral hazard is an additional concern because if a homeowner has property insurance, they may be lax in protecting their property from damage, thus increasing the number of claims
(Arnott and Stiglitz, 1988; Chiappori et al., 2006; Jullien et al., 2007). For example, if a
homeowner is insured against fire damage, they may not feel inclined to purchase a fire extinguisher or install smoke detectors. One of the principle causes of moral hazard is that the behavior of a policyholder is not continually observed by the insurance firm. Strict insurance
contracts and government regulations, like building codes, can help reduce the risks of moral hazard for hurricane-related damage.
2.5 Reinsurance
Insurance firms reduce their risk by purchasing reinsurance, which is simply insurance for insurance firms. Reinsurance firms may be other primary insurance firms or separate firms specializing in the sale of reinsurance. There are many types of reinsurance contracts; the two main types of reinsurance are facultative and treaty reinsurance. Facultative reinsurance is reinsurance that is only applicable to one risk or exposure, therefore making it similar to primary insurance (Patrik, 2001). Treaty reinsurance is reinsurance that assumes a specified amount of overall risk from a primary insurer (Patrik, 2001). Reinsurance may also have other
percentage of losses, meaning that if a primary insurer has a contract that cedes 25% of their risk to a reinsurer, damage of $1 million would be covered by $750,000 from the primary insurer and
$250,000 from the reinsurer. In some cases, the reinsurer also receives the set percentage of the
premium paid by homeowners as well as the premium paid by the primary insurer (Patrik, 2001). Excess-of-loss reinsurance covers all damage done beyond a retention level. For example, a reinsurance policy may cover any damage that occurs over $1 million, while the insurer would be responsible for damage under $1 million. There can be different layers of excess-of-loss reinsurance, meaning that one reinsurance firm may cover $1 million of damage over (in excess of) the $1 million retained by the insurance firm, while a different reinsurer may cover an additional $1 million over the $2 million covered by the first reinsurer and insurer together. Another type of insurance is catastrophic insurance, which is normally excess-of-loss treaty
coverage on a per-occurrence basis targeted toward insuring against very costly events. Due to the extremely damaging nature of some storms (see Table 2) and the market failures associated with catastrophic risk, other options for managing catastrophic events may be necessary,
including government intervention in the insurance and reinsurance markets, contingent refinancing, debt forgiveness, reformulating federal post-disaster assistance schemes, and
changing state assistance/insurance programs (Lewis and Murdock, 1996; Doherty, 1997; Lewis
and Murdock, 1999; King, 2005; Froot, 2001; Froot and O'Connell, 2008; Jaffee, 2008). With
the potential change in meaning of "Act of God" in the regulatory arena due to global climate change, the nature catastrophic insurance and regulations aimed at damage from catastrophic events may change as well (Eagle, 2007; Kristl, 2010)
Reinsurance has several functions, including increasing primary insurer capacity, reducing the risks from catastrophic events, stabilizing volatility from year to year, and helping the financial prospects of an insurance firm (Phifer, 1996). Given the ability of reinsurance to stabilize an
insurance firm over the long-run, purchasing reinsurance can allow an insurance firm to offer policies in higher-risk areas; the insurance firm has more access to capital to pay out claims from
hurricane damage.
The reinsurer-insurer relationship is different than the relationship between an insurer and a homeowner; reinsurers and insurers are more like equals. They share knowledge on the riskiness of certain claims and generally communicate openly about risks. Issues of moral hazard and adverse selection are still possible, but not to the extent present between insurance firms and property owners. The relationship between reinsurance and insurance firms is further
complicated because of competition in the market. Whether the reinsurance market is competitive and who better understands the nature of the risk are strongly debated in the literature (see Borch, 1962; Ang and Lai, 1987; Jean-Baptiste and Santomero, 2000; and
Villeneuve, 2000). Overall, reinsurance contracts are generally seen as fairer than property
insurance contracts, even though are several market failures that can lead to under-purchasing reinsurance (Froot, 2001; Thomann, 2008; Froot, 2009).
In order to achieve the desired level of risk, a reinsurance firm may change the pricing structure of its premiums to be nonlinear, meaning that the marginal rate of reinsurance coverage increases as the reinsurance firm takes on more risk. The reinsurer may also choose to not issue contracts
Given that reinsurance firms are not regulated in the same manner as insurance firms due to their global presence and operating structure, premiums are not as controlled.
2.6 Insurance Regulation
The United States insurance industry is regulated primarily by the states, and regulation varies incredibly across state lines due to the response of legislatures, the public, and insurance firms as they face different hurricane risks in different states. For example, Florida has some of the country's most extensive insurance regulation in the form of legislation and regulations that increase the subsidization of hurricane risk, expansion of government underwriting, and rate constraints (Grace and Klein, 2009a). Although regulation occurs mainly on the state level (as is delegated under the McCarran-Ferguson Act), the National Association of Insurance
Commissioners (NAIC) allows state regulators to coordinate their regulatory policies and
procedures (Kunreuther et al., 2009). Federal regulation does exist in some cases, primarily as a result of U.S. v. Southeastern Underwriters Association in 1944, the McCarran-Ferguson Act in
1945, and the Gramm-Leach-Bliley Act of 1999, which together subject the industry to federal
antitrust laws, allow for federal regulation of the insurance industry to supersede state regulations in some cases, and allow for several types of financial intermediaries to be owned by the same holding company (322 US 533; 15 USC 1101-1105; Grace and Klein, 2009b). The Dodd-Frank Wall Street Reform and Consumer Protection Act of 2010 will also serve to alter the structure of the U.S. insurance industry as it continues to be implemented in the coming years (124 Stat.
1376).
Overall, there are two main types of insurance regulation: financial regulation and market regulation (Grace and Klein, 2009a; Klein, 2009; Kunreuther et al., 2009). Financial regulation focuses on protecting policyholders from the risk that insurers will not be able to pay out claims or meet other financial obligations (Kunreuther et al., 2009). Its main purpose is to protect against insurance firm insolvency due to catastrophic risk exposure (Grace and Klein, 2009a;
Klein, 2009; Kunreuther et al., 2009). Financial regulation acts to require insurance firms to meet
certain financial requirements and to limit risk, which can include areas such as insurance firm investments, capital requirements, reinsurance contracts, and management (Klein, 2009). However, it should be noted that there is no nationally uniform policy regulating how insurers manage their catastrophic risk (Grace and Klein, 2009a). Larger insurance firms that operate across state boundaries-which can help diversify risk and keep insurance firms solvent-are subject to different requirements in different states, which has led to insurance firms and some economists promoting the idea of national regulation (Grace and Klein, 2009a; Grace and Klein,
2009b).
Market regulation controls other aspects of an insurance firm's operation, including rates, policy terms, underwriting, marketing, and claims adjustment (Kunreuther et al., 2009). In these cases, insurance regulation may not be correcting for market failures; having high insurance premiums when the risk is high can be an equilibrium state for the insurance industry, and regulation in such cases is correcting for an undesirable equilibrium point rather than an outright market failure (Klein, 2009). This type of regulation is intended to result in more affordable and stable insurance being offered in high risk areas, but can result in insurance firms pulling out of high risk areas in response to unsustainable business structures (Klein, 2009).
Market regulation is extremely reactionary; rate increases in the years following a particularly devastating hurricane are not tolerated well by consumers or legislators, especially when legislators are wary of public opinion (Kunreuther et al., 2009). The high damage years in the 1990s/early 2000s led to insurance firms attempting to raise rates precisely as consumers
suffered from hurricane damage as well. As such, most of the rate increases proposed in the state of Florida over the past decade have been denied by state regulators (Klein, 2009). Given
disputes in future hurricane activity and damage due to differing scientific opinions regarding global climate change and post-1995 damage, changing rates and providing an agreed upon justification for rate increases proves to be troublesome for regulators. It should be noted that the
most extreme market regulation occurs in the state of Florida; other states have much more relaxed regulatory schemes and practices (Kunreuther et al., 2009).
Part of the challenge of crafting state regulations stems from the variability of hurricane damage from year to year. As discussed earlier, hurricane activity and damage will not remain constant as global climate change continues, and the differing scientific opinion of the type of changes that may occur can make it difficult to determine how to change insurance rates, contracts, and regulations in order to incorporate the possible uncertainty. Improving seasonal hurricane
forecasts and our understanding of how global climate change may alter hurricane activity and damage may help regulators, insurance firms, and consumers agree upon future rates, contracts, and other regulations.
2.7 Applying Seasonal Hurricane Forecasts
Seasonal hurricane forecasts can be applied in many ways due to the varied impacts (both direct and indirect) of hurricanes on the United States. For example, the energy sector is highly
interested in seasonal hurricane forecasts because of the hurricane impact on offshore crude oil and natural gas production in the Gulf of Mexico, as can be seen in Figure 8 (U.S. Energy
While some industries are focused on short-term hurricane forecasting compared to seasonal hurricane forecasting, improving the skill of both would impact the U.S. economy.
In regards to the insurance industry, work by Emanuel et al. (2012) has begun to look at the application of seasonal hurricane forecasts to the purchase of reinsurance by insurance firms. This work used a synthetic hurricane generator from Emanuel et al. (2008) to simulate 1000 100-year time series of hurricane activity. The hurricane events then interacted with a property
portfolio of the eastern United States in order to determine the damage that would occur. The amount of insurer retention was altered depending on the forecast of the upcoming hurricane season, and the financial benefit of such purchases was assessed. Emanuel et al. (2012) showed that by using seasonal hurricane forecasts to modify their purchase of reinsurance, insurance firms could accumulate revenue in the order of decades. Applications could also be made to any other sector potentially affected by heavy rainfall, infrastructure destruction, or a disruption of local ecosystems. Overall, the understanding of the applications of seasonal hurricane forecasts is its infancy due to the far-reaching influence of hurricanes on economic activity and the limitation of the forecasting process.
As seen in Figure 5, current seasonal hurricane forecasts contain a lot of information and may be overwhelming. Updating forecasts in August also leaves little time for regulators and other parties to act to address the hurricane risk before the season peak in September. The complicated nature of these forecasts and narrow conditions under which they will be deemed correct leaves a large window for error. Additionally, these seasonal forecasts do not address potential damage that could be caused by upcoming hurricanes, which is ultimately the statistic of critical
importance for consumers, property owners, insurers, and regulators. This work seeks to fill that gap by analyzing hurricane damage trends rather than overall trends in hurricane activity, which will ultimately increase the applicability of seasonal hurricane forecasts. This work does not rely on statistics of past hurricane damage and can help discover trends in damage due to
environmental conditions that have not previously been detectable due to the small sample size of actual damage.
3 METHODS
The methods used in this work are an extension of the synthetic hurricane methods described in Emanuel et al. (2008), Emanuel et al. (2012), and Emanuel (2011) in which synthetic hurricanes
interact with a property portfolio and cause property damage due to their wind speed. 3.1 Synthetic Hurricane Generation
The synthetic hurricane downscaling technique of Emanuel et al. (2008) uses a global data set of meteorological variables including wind speeds at two altitudes, sea surface temperatures, and
atmospheric temperatures and humidity profiles through the troposphere and lower stratosphere to create a background climate state. The data set used here is the original NCAR/NCEP
reanalysis data (Kalnay et al., 1996), for the time period between 1979 and 2011. First, the climate state extracted from the data set is randomly seeded spatially and temporally with proto-hurricanes that are weak, warm-core vortices (Emanuel, 2011). These proto-proto-hurricanes move with the large-scale background flow provided by the climate state, including a correction for the
earth's rotation (Emanuel et al, 2006). Next, their intensity (as it varies in space and time) is predicted using a detailed, coupled ocean-atmosphere hurricane model that incorporates variables from the background climate state of the data set as the proto-hurricanes evolve and
interact with climate and synoptic conditions (Emanuel et al., 2006; Emanuel et al., 2008). For this analysis, there are 300 storms per year for a total of 9900 storms over the entire 33-year time period. The date, longitude, latitude, and wind speed of each storm is recorded every two hours.
3.2 ZIP Code Property Portfolios
The synthetic hurricanes interacted with a property portfolio along the U.S. East and Gulf coasts in order to determine the hurricane damage. Damage was modeled using the wind speed of the hurricane and did not include any damage that might have been caused by other aspects of the
storm. As mentioned earlier, most insured damage is wind damage, so this simplification is appropriate for the private insurance industry; however, given the magnitude of water-caused damage, this approach may be overly restrictive. The damage function will be described in further detail in the following section.
Two property portfolios were used. The property portfolio data are proprietary and were provided courtesy of Validus Reinsurance Inc. The first property portfolio was a database of
insured property values for one insurance firm sorted by ZIP code in the eastern United States. The second data set containing total insured property values from two different insurers was used for properties in the state of Florida; the insurance firm with ZIP code information for the rest of the eastern United States did not issue policies in Florida, as can be seen in Figure 9.
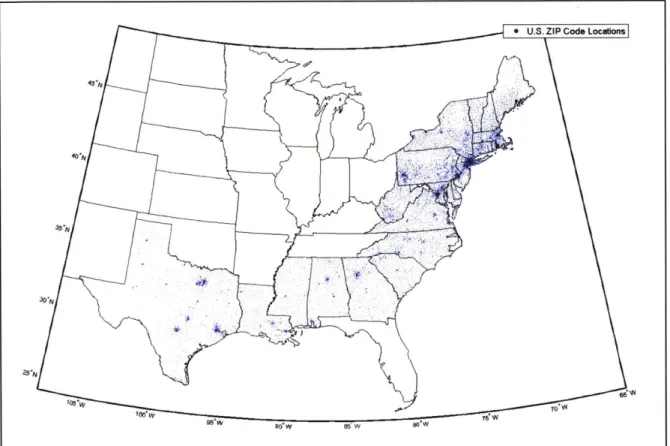
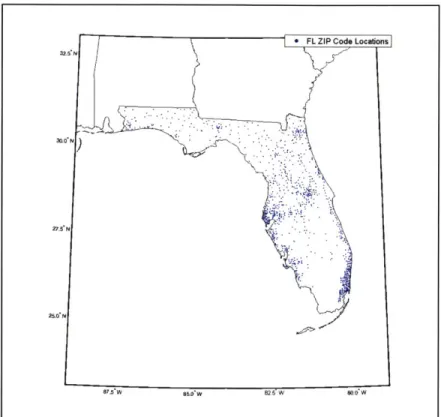
The ZIP code locations for the first portfolio are shown in Figure 9, while the ZIP code locations of Florida are shown in Figure 10. Note that the ZIP code locations in Figure 9 show the
approximate geometric center of each ZIP code, while the ZIP code locations in Figure 10 show the geometric center of individual insured properties. Originally, the data provided for the state
summed across ZIP codes to provide a similar analysis structure compared to ZIP code values for the rest of the country.
For the larger first property portfolio, there were 12043 unique ZIP codes. Eighty-three of these ZIP codes were located in Hawaii and therefore suffered no hurricane damage from the Atlantic basin synthetic hurricane set generated for this analysis. There were 1042 unique ZIP codes for Florida. Overall, there are over 42,000 ZIP codes in the United States (USPS ZIP Code
Frequently Asked Questions).
Figure 9. ZIP Code Locations for the First Portfolio. Note that the state of Florida is not included. There are 12043 ZIP codes in total. Note the concentration in urban areas.
Figure 10. Florida ZIP Code Locations. There are 1042 ZIP codes in total. Note that large blank areas are indicative of ZIP code geography and national parks rather than missing ZIP codes.
For simplicity, damage in a given ZIP code was modeled according to the wind experienced at the position of the ZIP code center, which may be only a rough estimate for the large ZIP codes given the potential variance in spatial wind speeds over short distances. However, given that in urban centers ZIP codes represent only a small geographic area and most ZIP codes are rather
small in general, this simplification is appropriate.
The total insured value of each ZIP code is shown in Figures 11 and 12. The United States property set has a total insured property value of $1.99 trillion, while the Florida property set has a total insured value of $50.4 billion. Note that in each property set, the insured value is
concentrated in urban centers. Also note that the insured value is concentrated in the northeast for the larger, United States property set. It is important to acknowledge that these values are representative of only three insurance firms and not the entire insured property values of the U.S. East and Gulf coasts.
Figure 11. Total Insured Property Value by ZIP Code. Note that the red, black, and magenta lines indicate the scale of the lines for each ZIP Code. Note that there is no data for the state of Florida.
Figure 12. Total Insured Property Value in USD by ZIP Code for the State of Florida. Note that the red, black, and magenta lines indicated the scale of the lines for each ZIP code.
-- Insured Property Value
- $3.5 Trillion Scale
- $350 Billion Scale $35 Billion Scale
JI
3.3 Damage Calculation
Damage was calculated by using a wind damage function to estimate the fractional loss of value in each ZIP code, which was then multiplied by the total insured value of property in that ZIP code and the probability that a given hurricane occurred. This process gives an estimate of the total damage caused by each hurricane in each ZIP code, which can then be summed across ZIP codes to yield the total insured damage from a particular hurricane. Each year of the series
(1979-2011) has a corresponding storm probability, meaning that the damage from each storm is
multiplied by storm probability for a given year. These probabilities ranged from about 0.6% in
1983 to about 1.7% in 2005.
Wind damage increases as wind speed increases. Empirical studies have shown that there is a very high power-law dependence of damage on wind speeds, up to the ninth power (Pielke, 2007; Nordhaus, 2010). However, the low-speed end of this spectrum would not be accurate considering that under a certain threshold, no wind damage occurs to most insured structures in the United States. Emanuel (2011) estimated that damage should vary as the cube of wind speed over a set threshold value, which is the approach used here. It is also important to consider that a building cannot be more than completely destroyed; once wind speeds are high enough to cause a complete loss in property value, higher wind speeds cannot cause more damage. A function that meets these requirements is
f
= n33 (1)1+ vn3
'
wheref is the fraction of the property value lost and
MAX [(V - 50 kts),0] (2)
60 kts
where V is the wind speed in knots. These equations imply that half the property value is lost by
110 knots. The overall sensitivity of the damage function to the speed at which half the property
value is lost is low, and a value of 110 knots is appropriate (Emanuel, 2011). This equation is a simplification because damage depends also on wind direction, gustiness, the duration of wind, and building sturdiness.
3.4 Damage Analysis
In order to help rule out the possibility that specific storms were dominating damage variability and improve the viability of the results, the hurricane damage dataset was manipulated using bootstrapping techniques. For each year (1979-2011), 90 out of the 300 hurricanes generated were randomly selected. Damage across the 90 storms (representing one complete hurricane
season) was summed for every ZIP code to yield yearly total damage. This process was repeated
10 times (with replacement during the storm selection process) and resulted in a set of 10 total