Publisher’s version / Version de l'éditeur:
Vous avez des questions? Nous pouvons vous aider. Pour communiquer directement avec un auteur, consultez la
première page de la revue dans laquelle son article a été publié afin de trouver ses coordonnées. Si vous n’arrivez pas à les repérer, communiquez avec nous à [email protected].
Questions? Contact the NRC Publications Archive team at
[email protected]. If you wish to email the authors directly, please see the first page of the publication for their contact information.
https://publications-cnrc.canada.ca/fra/droits
L’accès à ce site Web et l’utilisation de son contenu sont assujettis aux conditions présentées dans le site LISEZ CES CONDITIONS ATTENTIVEMENT AVANT D’UTILISER CE SITE WEB.
Canadian Artificial Intelligence Conference (AI 2008) [Proceedings], 2008
READ THESE TERMS AND CONDITIONS CAREFULLY BEFORE USING THIS WEBSITE.
https://nrc-publications.canada.ca/eng/copyright
NRC Publications Archive Record / Notice des Archives des publications du CNRC :
https://nrc-publications.canada.ca/eng/view/object/?id=acf0d9e0-0d11-4734-9b23-2c158831a61c
https://publications-cnrc.canada.ca/fra/voir/objet/?id=acf0d9e0-0d11-4734-9b23-2c158831a61c
NRC Publications Archive
Archives des publications du CNRC
This publication could be one of several versions: author’s original, accepted manuscript or the publisher’s version. / La version de cette publication peut être l’une des suivantes : la version prépublication de l’auteur, la version acceptée du manuscrit ou la version de l’éditeur.
Access and use of this website and the material on it are subject to the Terms and Conditions set forth at
Predicting User Preferences via Similarity-Based Clustering
Qin, M.; Buffett, Scott; Fleming, Michael
Council Canada Institute for Information Technology de recherches Canada Institut de technologie de l'information
Predicting User Preferences via
Similarity-Based Clustering *
Qin, M., Buffett, S., Fleming, M.W.
May 2008
* published at the Canadian Artificial Intelligence Conference (AI 2008). Windsor, Ontario, Canada. May 27-30, 2008. NRC 50333.
Copyright 2008 by
National Research Council of Canada
Permission is granted to quote short excerpts and to reproduce figures and tables from this report, provided that the source of such material is fully acknowledged.
Predicting User Preferences via Similarity-Based
Clustering
Mian Qin1, Scott Buffett2, and Michael W. Fleming1
1
University of New Brunswick, Fredericton, NB, E3B 5A3 {l0i5r,mwf}@unb.ca
2
National Research Council Canada, Fredericton, NB, E3B 9W4 [email protected]
Abstract. This paper explores the idea of clustering partial preference relations as a means for agent prediction of users’ preferences. Due to the high number of possible outcomes in a typical scenario, such as an automated negotiation session, elicitation techniques can provide only a sparse specification of a user’s preferences. By clustering similar users together, we exploit the notion that people with common preferences over a given set of outcomes will likely have common interests over other outcomes. New preferences for a user can thus be predicted with a high degree of confidence by examining preferences of other users in the same cluster. Experiments on the MovieLens dataset show that preferences can be predicted independently with 70-80% accuracy. We also show how an error-correcting procedure can boost accuracy to as high as 98%.
1
Introduction
Before an agent can autonomously perform a task on behalf of a user, such as locating potential trading partners, searching for potential purchases, or negoti-ating the terms of a deal, a sufficient model of the user’s preferences is needed. Since preference models for individual users are not usually available, preference elicitation techniques are used to extract information from the user. Typically this is done by querying the user about preferences for various possible outcomes, different attribute values, utilities or risk attitudes. While it would be ideal to query the user repeatedly until all preference information is known, this is typ-ically infeasible or, at the very least, bothersome to the user, since the number of possible outcomes in most typical scenarios is too high. It is thus desirable to obtain sufficient information through a small number of queries, and to infer or predict new information based on this small amount of elicited information.
It has been shown by existing electronic commerce websites, such as ama-zon.com for example, that tracking and analyzing actions and choices of previous customers can be extremely effective in determining what may appeal to new customers, allowing a business to target consumers with particular items or products that have a high chance of piquing their interest. Similarly, we attempt to predict new preferences for a specific user by considering the preferences of previous users with similar preference models.
Technologies for doing this analysis and prediction are often based on collab-orative filtering. Each time a new visitor is encountered, ratings for each product are predicted based on ratings given by previous visitors. Visitors with ratings similar to the new visitor are given more weight. Rather than only allowing rat-ings, we consider a richer model where users can specify binary preferences over the set of outcomes. This is useful for a number of reasons. First, ratings offer a limited amount of preference information. Typically a scale including only the integers from 1 to 5 is used, leaving just five levels of preference. As a result there will be “ties” for several pairs of outcomes, for which the user may often actually have a preference. Second, it can be very difficult for a user to rate objects when the domain of objects is constantly changing. For example, a user might rate a product as a “5” only to discover later that a more desirable product exists. Allowing users to specify that “item X is preferred over item Y” solves the issue of scale, and allows the user to always specify a preference where one exists, rather than requiring the user to give both the same rating when the utility for each is close. People also just find it more natural to choose which of two items is preferred, rather than attempt to place an item somewhere on a scale.
Consequently, if preferences rather than ratings are gathered, an approach other than collaborative filtering is required. We construct partial preference re-lations for each user in the database, and explore the notion of clustering such partial preference relations as a means to identify groups of people with simi-lar tastes. When a new user is encountered, he or she is classified into one of these clusters and new preferences are predicted based on preferences of those in the same cluster. We use conditional outcome preference networks (COP-networks) [6] as the representation for users’ partial preference relations. These networks allow for a number of different preference specifications over varying types of domains, including single- or multi-attribute outcomes, and can be speci-fied over single attribute values, sets of attribute values, complete objects or even sets of objects.
Clustering is done dynamically, to provide optimal information at any given time regarding the currently desired preference information. That is, if the agent needs to know which of A and B is most likely preferred by the user, it would be most useful to construct clusters in such a way that users within each cluster have a strong agreement on A and B. Finding that the new user belongs to one of these clusters will help give the agent a high degree of confidence in its prediction. To do this clustering quickly, a fast method of computing the distance between two partial preference relations is developed. Three different techniques for doing this dynamic clustering and preference prediction are developed and tested. Once the clustering techniques are used to generate a number of independent preference predictions, an error correction procedure is used to identify and eliminate cycles in the preference network.
The paper is organized as follows. Section 2 discusses the preference elicita-tion relaelicita-tion model that we consider, and formalizes the current problem being solved. The crux of the paper lies in Section 3 where we present our method for distance calculation, and outline the three techniques for clustering and
prefer-3
ence prediction. Our procedure for considering all predicted preferences together to correct prediction errors is then outlined in Section 4. Section 5 gives details on experiments and results, while Section 6 discusses conclusions and related work and Section 7 outlines plans for future work.
2
Preference Elicitation and Prediction
Preference elicitation involves the process of extracting and determining pref-erences of a human user over a set of possible outcomes in a decision problem. Such processes are commonly executed by an autonomous agent with the inten-tion of performing one or more tasks on behalf of the user, such as negotiainten-tion of purchases or service usage. Preference elicitation involves any or all of direct querying, observing activity/choices and inferring or predicting preferential in-formation based on evidence obtained. The goal of preference elicitation is to determine a user’s preference information in such a way as to optimize utility of the optimal strategy for solving the decision problem.
Such utility can be optimized if the agent can define the user’s complete utility function over the domain of outcomes. This is typically not possible due to two major reasons: 1) people have difficulty specifying utilities for outcomes, even when queries are posed as standard gamble questions, and 2) a user can only be queried a small number of times before becoming overwhelmed and frustrated with the querying process. Therefore, only a small number of cognitively simple queries can typically be posed. The problem then is to determine a high number of preferences from the limited information obtained from the small number of queries. In this paper, we consider simple queries q = (o1, o2), where (o1, o2) is a
pair of outcomes, over which the user responds with the more preferred (or that neither is preferred). If the response is o1, the fact that o1 is preferred over o2is
added to the preference set. Over time, this process will reveal a partial prefer-ence relation over the set of outcomes. A utility function can then be estimated to fit this partial relation. Once this utility function is deemed sufficient, the elic-itation process can be terminated. Since it is difficult to determine a sufficient utility function based on a partial relation constructed solely from information directly gained from querying, it can be quite useful to attempt to predict other user preferences and add to the partial relation when there is sufficient evidence to do so. This is where our clustering technology comes in.
We consider the problem as follows. Let O be a set of outcomes, over which a number of users each have preferences and utility functions. In particular, user i has utility function ui : O → ℜ, which induces a preference relation ºi
such that ui(o) ≥ ui(o′) ⇔ o ºi o′. Each user reveals a subset ºri of their
preference relation, perhaps via utility elicitation or other means. Given a user i and outcomes o and o′, where i has a preference over o and o′ that has not
been revealed, the goal is to determine whether o ºio′ or o′ºioby examining
other users j with preferences ºr
jsimilar to ºri, and observing which of these two
possibilities is typically the case. Such users are determined via the clustering and prediction methods presented in this paper.
3
Clustering of Partial Preferences
3.1 Utility Estimation
In order to model a user’s preferences during the elicitation stage, we utilize a structure referred to as a Conditional Outcome Preference Network (COP-network). The structure is a directed graph that represents preferences over the set of outcomes, where every outcome is represented by a vertex. For vertices v and v′in the graph representing outcomes o and o′, respectively, if v is a proper
ancestor of v′ then o is preferred over o′. See Chen [5] for more details.
An example COP-network is shown in Figure 1. Each possible outcome oiin
the decision problem is represented by the vertex vi in the graph. It is evident
from this graph that outcome o0 is preferred over outcome o1 since v0 is the
parent of v1. Outcome o1 is preferred over outcome o7 since v1 is a proper
ancestor of v7. Neither of outcomes o3 and o6 is known to be preferred over the
other since v3 is neither an ancestor nor a descendant of v6.
v0 v1 v2 v4 v5
v3
v6
v7
Fig. 1.An example COP-network.
In addition to modeling the user’s network of preferences, the COP-network can also be used to estimate a utility function over the set of outcomes. Given an initial partial utility assignment, including at least the most preferred outcome (utility 1) and the least preferred (utility 0), and the preferences defined in the COP-network, a utility function ˆuover the entire set of outcomes is produced. This is done in such a way as to preserve the preference ordering specified by the COP-network. Specifically, let v and v′ represent outcomes o and o′. If v is
a proper ancestor of v′, then ˆu(o) > ˆu(o′).
The method iteratively selects paths in the graphs containing outcomes for which a utility has not yet been assigned. Formally, let p be a path in the network with endpoints representing outcomes o1 and on. This path is a candidate for
selection if it is a longest path such that 1) ˆu is known for o1 and on, 2) ˆu
is unknown for all other outcomes represented by vertices on p, and 3) the assignment of utilities to such outcomes will not cause an inconsistency in the graph3. Once a suitable path p has been selected, the utility ˆu is assigned for
each outcome o1, o2, . . . on represented on p, decreasing from o1to on, by
ˆ
u(oi) = ˆu(on) +
(n − i)(ˆu(o1) − ˆu(on))
n− 1 (1)
3
5
For example if p represented four outcomes with ˆu(o1) = 0.8 and ˆu(o4) = 0.2,
then ˆu(o2) and ˆu(o3) would be assigned utilities of 0.6 and 0.4, respectively. The
process of selecting paths and assigning utilities in this way continues until all outcomes are considered.
As the number of outcomes in a decision problem grows exponentially with the number of outcome attributes, COP-networks that consider all outcomes can become unmanageably large in practice. We therefore propose a factored utility approach. Here the set of attributes are partitioned in such a way that dependent attributes are considered together and independent attributes are considered sep-arately. Several considerably smaller COP-networks can then be built, one for each dependent attribute group, giving the partial preference structure over at-tribute values, rather than over entire outcomes. If ever one wanted to determine which of two outcomes is preferred, then the approach for determining utility functions can applied to the COP-networks, giving utilities for attribute values. Weights for attribute utilities could then be determined by eliciting utilities for a small number of outcomes, yielding a utility function for complete outcomes.
3.2 Distance Computation
Since the clustering described in this paper is performed dynamically, a fast technique is needed for calculating the distance between two partial preference relations. For each preference relation, we use the COP-network-based utility estimation to produce a vector of estimated utilities over the set of outcomes. These vectors will be used to denote the co-ordinates of the preference relations in n-dimensional space, allowing for the Euclidean distance between any two to be computed. For a set of n items, this can be done using O(n) computations, which is significantly faster than the O(n3) computations required by the probabilistic
distance method [7] from the literature.
3.3 Clustering Techniques
Given partial preference relations for a set of users, distances between any two partial preference relations can be calculated as described above. Once distances between all pairs of relations are computed, Y-means clustering is performed. Y-means clustering is similar to the K-means algorithm, with a major difference. One drawback of the K-means algorithm is that the number k of clusters must be specified in advance, and the performance of the K-means algorithm greatly depends on the choice of the value of k. However, it is hard to find an optimal value for k. If the distribution of the data set is unknown, the best k is espe-cially hard to obtain. The Y-means clustering method overcomes the problem by allowing the number of clusters to be adjusted during the clustering.
Clustering is used in this paper to help in the elicitation of users’ preferences. Initially, all previously encountered users’ preference relations are partitioned into clusters. When a new user is encountered, she will be classified into one of these existing clusters. Based on investigating the users’ preferences in this particular cluster, general conclusions can be drawn. For example, consider a
user for whom it is not known whether red or blue is preferred. Assume that she is assigned to cluster C1, and in cluster C1, 80% of users prefer red over
blue. Thus, since the user agrees on many preferences shared by members of this group, the conclusion that she has a much higher probability of preferring red over blue can be drawn. This is only a simple example, but it gives a basic idea of how users’ preferences can be estimated by performing clustering.
Different clustering methods can cause different results over the same data points. Various strategies for clustering partial preference relations and for in-ferring new preferences based on the set of clusters obtained have been tested. This section describes three different applications of the Y-means algorithm for clustering partial preference relations, and demonstrates the technique used for estimating preferences for each application.
Direct Prediction The Direct Prediction method is the simplest of the three described in this paper. It consists of only one clustering process, where all partial preference relations are partitioned by the Y-means clustering method. Assume that the partial relations are grouped into n clusters. In order to determine which of outcomes oi and oj is preferred by a user u, the first step is to determine
to which cluster u belongs. Based on u’s known partial preferences, a COP-network can be constructed. As mentioned in Section 3.1, u’s utility estimates for all outcomes are calculated by the COP-network, and these utilities compose a vector. In order to classify u into one of the clusters, the distances between u and the centroids of the n clusters are computed as the Euclidean distance. The user u belongs to the cluster for which the distance between u and the cluster’s centroid is the smallest.
The second step is to predict preferences. Assume u is assigned to the mth
cluster. For outcomes oi and oj, the average utility estimates are computed, by
considering the estimates from all partial preference relations in this cluster. The confidence interval4 for the average utility of outcome o
i (denoted by ciu(oi))
is compared with the confidence interval for the average utility of outcome oj
(denoted by ciu(oj)). If there is no overlap between ciu(oi) and ciu(oj), then
the outcome with the higher average utility estimate is predicted to be preferred (oi ≻ oj or oj ≻ oi). Otherwise, if there is an overlap between the confidence
intervals, the preference between oi and oj is deemed to be unknown.
Pre-processing Prediction The Pre-processing Prediction method is more complicated than the Direct Prediction method, and is composed of two clus-tering phases: cursory clusclus-tering and the Y-means clusclus-tering. At first, all partial preference relations are cursorily grouped into three large clusters according to whether (1) oi ≻ oj, (2) oj ≻ oi, or (3) neither oi ≻ oj nor oj≻ oi in that
par-ticular relation. Each of these three clusters is then partitioned by the Y-means
4
Confidence interval gives an estimated range of values which is likely to include an unknown population parameter, the estimated range being calculated from a given set of sample data.
7
clustering method into sub-clusters. Once the sub-clusters are formed, the user uis classified in one of the sub-clusters. If she is classified in a sub-cluster that belongs to the first or second super-cluster, the relation between oi and oj is
predicted to be oi ≻ oj or oj ≻ oi, respectively. However, if she is classified
in a sub-cluster that belongs to the third super-cluster, we concede that the preference between oi and oj cannot be determined.
Post-processing Prediction The Post-processing Prediction method is simi-lar to the Pre-processing Prediction method; however, it works in a reverse fash-ion. It includes three clustering phases: the Y-means clustering method, cursory clustering, and the Y-means clustering method again. In the first step, all prefer-ence relations are partitioned into n clusters by the Y-means clustering method. A new user u is encountered, and, as before, we assume that u’s unknown rela-tion between two outcomes oiand oj is needed by an agent. The user is classified
in one of the clusters formed in the previous stage by comparing the distances between u and each cluster’s centroid. Assume that the user u belongs to the mth cluster. At the second step, partial preference relations in the mth cluster
are cursorily clustered into three sub-clusters based on whether (1) oi≻ oj, (2)
oj ≻ oi, or (3) neither oi≻ oj nor oj ≻ oi. Once the three sub-clusters are built,
each sub-cluster is partitioned again by the Y-means clustering method into k small sub-clusters, and u is classified again. Depending on the results of clus-tering, a conclusion on the relation between oi and oj is made. If u is classified
in a small cluster that belongs to the first or second sub-cluster, the relation between oiand oj is predicted to be oi ≻ oj or oj≻ oi, respectively. However, if
uis classified in a small cluster that belongs to the third sub-cluster, we concede that the preference between oi and oj cannot be determined.
4
Error Correction
When performing this type of clustering and preference prediction, there is bound to be a high number of errors. First of all, the clustering procedures may not work perfectly, due to the sparseness in known preferences. There is no guarantee that we will group a particular user with the n most similar users if we actually know very little about these users. Secondly, even when people are quite similar, they will not necessarily agree on everything, and may even deviate from the entire group on one item while agreeing on most others.
By considering all predicted preferences together, it is possible to correct many of these errors if a sufficient level of accuracy has been achieved. This is done by analyzing the preference network built based on these predicted prefer-ences and identifying cycles in the graph. For every cycle found, there must be at least one error in the direction of the arcs that make up the cycle, as preferences are assumed to be transitive and thus acyclic. Consider the partial preference network in Figure 2. There are two cycles: ABCA and ADCA. At least one arc in each of these cycles (and thus the corresponding preference) runs in the incorrect direction. If we have confidence that a reasonably high number of preferences
are correct, then it may be more likely that the one arc that the two cycles have in common, CA, is the culprit, than it would be for two distinct arcs (one from each cycle) to be the cause. If there are several other vertices v such that AvCA is a cycle, then it becomes less and less likely that every one of these arc pairs (Av, vC) contain an error, when the alternative is that CA is solely responsible. So the correction here would be to reverse CA.
B
C D
A
Fig. 2.A partial preference network with two cycles
The problem of identifying whether a graph has a cycle of a particular size is NP-complete, so identifying all cycles in a graph in general is computationally intractable. This is not the case, however, for what is needed in this particular graph. Consider the following theorem:
Theorem 1 Let G be a directed graph where there exists one arc between every pair of vertices. For every cycle C in G greater than size 3, there exists a cycle C′ such that the vertices in C′ are a proper subset of the vertices in C.
Proof: Let u and v be any non-adjacent vertices in C. Let puv be the arcs on the
path from u to v in C, and let pvu be the arcs on the path from v to u in C. If
(u, v) is an arc in G, then pvu∪{(u, v)} makes up a cycle, otherwise puv∪{(v, u)}
makes up a cycle.
Thus to eliminate all cycles in a network where the preference has been predicted for any pair of outcomes, only the 3-cycles need to be analyzed and corrected. Once these are gone, no cycles can exist. Identifying 3-cycles is much more reasonable, and can be done easily in O(mn) time, where m is the number of arcs and n is the number of vertices in the graph. Note that errors can still exist when the graph is acyclic. However, by cleverly choosing arcs to reverse and eliminate cycles, we can correct a great deal of these errors.
Once the cycles are identified, candidates for correction are chosen as follows. For every 3-cycle, either 1 or 2 of the 3 arcs must be incorrect. If a majority of the arcs is correct, then it is more likely that only 1 of the 3 should be corrected. To determine which one, recall the discussion above regarding the increased likelihood that arcs that are part of many cycles are more likely to be incorrect. In each iteration then of the correction process, the number of 3-cycles to which each arc belongs is computed. The arc belonging to the most cycles is reversed, and the next iteration commences. The procedure continues until either 1) there are no cycles left, or 2) no arc can be reversed without creating a new cycle.
9
5
Results
5.1 Independent Preference Prediction
Several experiments were run to determine how accurately each of the three techniques could predict which of two outcomes is preferred for a particular test user. Since our technology relies on the fact that users with similar tastes for particular outcomes should often have similar tastes for other outcomes, testing on computer-generated data would be problematic, due to the difficulty in fairly simulating this dependency in the preferences. Simulating too little dependency would detract from our performance, while simulating too much would unduly stack the deck in our favour. We chose then to instead utilize the MovieLens dataset, which is commonly used to test collaborative filtering technology. While this dataset does not explicitly provide preferences over outcomes for the indi-vidual subjects, but rather ratings for particular outcomes (i.e. movies) in the form of integers between 1 and 5, a small number of preferences can be extracted by considering outcomes that are rated differently. That is, if movie A is rated a 4 and movie B is rated a 2, then A is preferred over B.
To test our techniques, a set of users in the database were randomly chosen to be the cluster users, leaving the remainder as the test users. To prevent the preference data from being too sparse, two pre-processing actions were carried out on the cluster data: 1) only the 512 most frequently rated movies were con-sidered, and 2) collaborative filtering was used to predict ratings for unrated data. This meant we had a rating for every outcome. The point was not to have complete preference information for the cluster users; this would be an unreal-istic assumption that would unfairly improve our results. Rather, it allowed us to control how many preferences were actually revealed, allowing us to assess performance for preference specifications with various degrees of completeness
For each user, a predetermined number of preferences were chosen to be revealed, simulating the effect of the system learning a small number of these. COP-networks were built to cluster the partial preference relations, and a test user was classified among them according to the above-described techniques. For each trial, two outcomes were chosen randomly such that 1) the test user had a specified preference over the two outcomes in the original database (to allow us to assess performance), and 2) this preference was not one of those revealed in the initial stage. The goal of the experiments was then to determine how accurately each method could predict the preference over these two outcomes.
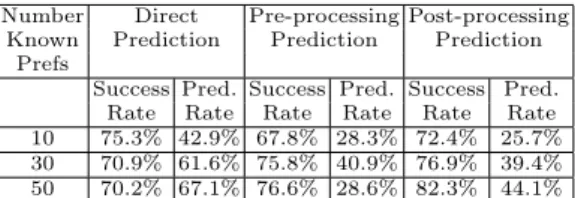
For each technique, 1000 trials were performed on the set of 200 test users in each of the cases where 10, 30 and 50 preferences were known for each user. Results are shown in Table 1. From these data one can see that, when the number of known preferences is very small, the Direct Prediction method is the best method among the three techniques. When the number of known preferences is relatively high, the Post-processing Prediction method is the best method among three techniques, with its accuracy increasing with the number of known preferences. The Post-processing Prediction method is always better than the Pre-processing Prediction method in the cases tested.
Number Direct Pre-processing Post-processing Known Prediction Prediction Prediction
Prefs
Success Pred. Success Pred. Success Pred. Rate Rate Rate Rate Rate Rate 10 75.3% 42.9% 67.8% 28.3% 72.4% 25.7% 30 70.9% 61.6% 75.8% 40.9% 76.9% 39.4% 50 70.2% 67.1% 76.6% 28.6% 82.3% 44.1%
Table 1.Performance of each of the three techniques. Percentage of preferences for which a predic-tion is made (pred. rate) and accuracy of those predicpredic-tions (success rate) are indicated.
5.2 Error Correction
To give an indication of the performance of the error correction technique, tests were run on simulated data generated from a particular scenario. Simulated data were used here for two reasons. First of all, it would not be possible to test using the data obtained (i.e. the MovieLens dataset), since only sparse information on preferences is actually known. So there would be no way to verify the correctness of our technique for most cases. Second, “real” data that capture preference interdependence among similar users are not needed anyway, since we only focus on a preference network for one particular user. Based on three parameters, the number of outcomes, the percentage of preferences that were predicted, and the accuracy of those predictions, a preference network can be generated accordingly to allow us to determine how many errors would be corrected, on average, for any given scenario.
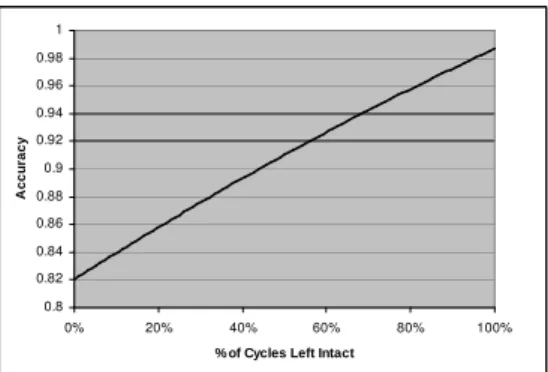
Data were simulated for the case of the Post-processing technique with 50 known preferences, which had the highest accuracy of all tests discussed in the previous section. For all pairs of outcomes a preference was chosen as the user’s true preference (i.e. the 512 outcomes were ordered), and a COP-network was artificially generated such that preferences were predicted for 44.1% of the pairs with 82.3% accuracy. Preferences were chosen in such a way as to reflect the fact that there may often be fewer cycles in a COP-network built based on clustering than there would be if preferences were selected randomly with equal probability. This is because a user may typically be clustered with the same general group of people each time a preference needs to be learned. Since these people will not have cycles in their own preferences, it will be less likely that we would have cycles in preferences that are predicted based on these people. To reflect this possibilty, results are shown for cases with different percentages of cycles removed. Results show that, depending on the likelihood of obtaining cycles in predicted preferences, the error-correcting technique can increase accuracy from 82.3% to as high as 98%.
6
Conclusions and Related Work
This paper examines the idea of clustering partial preference relations for a group of users. In order to negotiate autonomously on behalf of a user, an intelligent agent must obtain as much information as possible about the user’s preferences
11 0.8 0.82 0.84 0.86 0.88 0.9 0.92 0.94 0.96 0.98 1 0% 20% 40% 60% 80% 100%
% of Cycles Left Intact
A c c u ra c y
Fig. 3.Prediction accuracy after applying the error correction technique, for a COP-network with varying numbers of cycles.
over possible outcomes, but without asking the user an unreasonable number of questions. By clustering similar users together, we can predict new preferences for a user with a high degree of confidence by examining preferences of other users in the same cluster. Three techniques for clustering, and predicting prefer-ences based on these clusters, are developed and evaluated experimentally. We also propose an error-correction procedure, which analyzes the set of predicted preferences as a whole, and determines which of these predictions do not likely fit with the rest of the set. Preliminary results show that this procedure can be considerably effective, boosting accuracy of the best technique to as much as 98% for a particular simulated scenario.
There is a great body of work on preference elicitation in general, and specif-ically on predicting preferences or estimating utilities. Preference elicitation is becoming an increasingly popular topic in the areas of agents and electronic commerce, and the problem of predicting or estimating preferences and utility functions based on a small sample of directly elicited information is viewed with great importance. Boutilier et al. [1] propose a minimax regret-based approach to preference elicitation. Given a decision problem and a small set of elicited preferences, a total ordering of the user’s preferences is chosen so as to minimize potential regret should an adversary choose a utility function for the user con-sistent with the elicited preferences. Several elicitation strategies for reducing this regret are proposed. Chajewska et al. [4], on the other hand, take a more direct approach by computing the expected utility of the decision strategy based on probability distributions for outcome utilities. Here, the user’s utility for an outcome is estimated by a prior probability distribution over the user’s utility function, computed based on utilities learned from other people. Questions are then posed about the user’s utilities using a standard gamble approach [8], and the distributions are narrowed or modified accordingly. Several works examine techniques for predicting preferences in more specific domains, including pref-erences of opponents in automated negotiation [2, 3, 9]. Our work differs from
these in that we attempt to identify other users with preferences similar to those directly elicited from the current user. We then predict new preferences for this user using techniques for building and analyzing clusters and correcting errors.
7
Future Work
One direction for future work is to address the fact that we are only attempt-ing to predict preferences for which we have a certain level of confidence. Two items need to be investigated further. First of all, the error correction technique must be studied further to determine where the balance lies in the quality-versus-quantity trade-off. While accuracy would likely decrease if more predictions were attempted, the error correction technique may remedy this, possibly providing even better results due to more predictions being made. Second, it may be pos-sible to infer a large number of preferences for which no prediction is made by considering other known preferences. By computing the transitive closure of the preference network, one should be able to infer several new preferences. We did not investigate this, as the error correcting procedure is currently incomplete, and cycles will often remain in the network. Thus the transitive closure will re-sult in pairs of vertices with arcs between them in each direction. Work needs to be done on selecting good candidate edges to remove from these remaining cycles. Since locating all cycles in a graph is intractable, this is non-trivial.
References
1. C. Boutilier, R. Patrascu, P. Poupart, and D. Schuurmans. Regret-based utility elicitation in constraint-based decision problems. In Proceedings of IJCAI-05, pages 929–934, Edinburgh, Scotland, 2005.
2. S. Buffett, Luc Comeau, B. Spencer, and M. W. Fleming. Detecting opponent concessions in multi-issue automated negotiation. In Proc. of ICEC2006, pages 11–18, Fredericton, Canada, 2006.
3. S. Buffett and B. Spencer. A bayesian classifier for learning opponents preferences in multi-object automated negotiation. Electronic Commerce Research and Appli-cations, 2007.
4. U. Chajewska, D. Koller, and R. Parr. Making rational decisions using adaptive utility elicitation. In AAAI-00, pages 363–369, Austin, Texas, USA, 2000.
5. S. Chen. Reasoning with conditional preferences across attributes. Master’s thesis, University of New Brunswick, 2006.
6. S. Chen, S. Buffett, and M. W. Fleming. Reasoning with conditional preferences across attributes. In Proc. of AI2007, pages 369–380, Montreal, Canada, 2007. 7. V. Ha and P. Haddawy. Similarity of personal preferences: Theoretical foundations
and empirical analysis. Artificial Intelligence, 146(2):149–173, 2003.
8. R. L. Keeney and H. Raiffa. Decisions with Multiple Objectives: Preferences and Value Tradeoffs. John Wiley and Sons, Inc., 1976.
9. A. Restificar and P. Haddawy. Inferring implicit preferences from negotiation ac-tions. In Proc. Int’l Symposium on Artificial Intelligence and Mathematics, Fort Lauderdale, USA, 2004.