Publisher’s version / Version de l'éditeur: Student Report, 2010-12-01
READ THESE TERMS AND CONDITIONS CAREFULLY BEFORE USING THIS WEBSITE.
https://nrc-publications.canada.ca/eng/copyright
Vous avez des questions? Nous pouvons vous aider. Pour communiquer directement avec un auteur, consultez la
première page de la revue dans laquelle son article a été publié afin de trouver ses coordonnées. Si vous n’arrivez pas à les repérer, communiquez avec nous à PublicationsArchive-ArchivesPublications@nrc-cnrc.gc.ca.
Questions? Contact the NRC Publications Archive team at
PublicationsArchive-ArchivesPublications@nrc-cnrc.gc.ca. If you wish to email the authors directly, please see the first page of the publication for their contact information.
NRC Publications Archive
Archives des publications du CNRC
For the publisher’s version, please access the DOI link below./ Pour consulter la version de l’éditeur, utilisez le lien DOI ci-dessous.
https://doi.org/10.4224/17712946
Access and use of this website and the material on it are subject to the Terms and Conditions set forth at
Evaluating the performance of the Korean research icebreaking vessel “Araon” in ice
Hogan, Dayna; Lau, Michael
https://publications-cnrc.canada.ca/fra/droits
L’accès à ce site Web et l’utilisation de son contenu sont assujettis aux conditions présentées dans le site LISEZ CES CONDITIONS ATTENTIVEMENT AVANT D’UTILISER CE SITE WEB.
NRC Publications Record / Notice d'Archives des publications de CNRC: https://nrc-publications.canada.ca/eng/view/object/?id=61f563b2-3954-460f-977e-2a12469bd359 https://publications-cnrc.canada.ca/fra/voir/objet/?id=61f563b2-3954-460f-977e-2a12469bd359
DOCUMENTATION PAGE REPORT NUMBER
SR-2010-22
NRC REPORT NUMBER DATE
December 2010
REPORT SECURITY CLASSIFICATION
UNCLASSIFIED
DISTRIBUTION
UNLIMITED
TITLE
EVALUATING THE PERFORMANCE OF THE KOREAN RESEARCH ICEBREAKING VESSEL “ARAON” IN ICE
AUTHOR (S)
Dayna Hogan and Michael Lau
CORPORATE AUTHOR (S)/PERFORMING AGENCY (S)
NRC Institute for Ocean Technology
PUBLICATION
SPONSORING AGENCY (S)
Transport Canada and Marine and Ocean Engineering Research Institute
IMD PROJECT NUMBER
PJ2409/PJ2427
NRC FILE NUMBER
KEY WORDS
Araon, icebreaker, model test, PMM, ice
PAGES v, 17, App. A FIGS. 14 TABLES 8 SUMMARY
The Institute for Ocean Technology of the National Research Council of Canada has conducted a series of resistance, propulsion and manoeuvring tests on a scale model of the Korean icebreaker Araon attached to a Planar Motion Mechanism (PMM) and in a self-propelled test configuration. Investigation of the Araon’s podded propulsors and their influence on ice-hull load distribution were conducted in open water and level ice, pack ice, ridges and rubble. The tests included straight, zigzagging, and circular runs with control over propeller shaft speed and pod angle in both configurations.
Ice loads, model position, pod performance characteristics and ice-hull pressures were monitored during these tests. From these measurements the full-scale icebreaking, manoeuvring, and propulsive
capabilities can be predicted and compared with the ship’s actual performance. The tests were used as a study of the hull form’s clearing ability as well as the loading it experiences from encountering ice during different manoeuvres.
ADDRESS
TEL.
National Research Council Institute for Ocean Technology P. O. Box 12093, Station 'A' St. John’s, Newfoundland, Canada A1B 3T5
National Research Council Conseil national de recherches Canada Canada Institute for Ocean Institut des technologies Technology océaniques
EVALUATING THE PERFORMANCE OF THE KOREAN RESEARCH
ICEBREAKING VESSEL “ARAON” IN ICE
SR-2010-22
Dayna Hogan and Michael Lau December 2010
i
EXECUTIVE SUMMARY
The Institute for Ocean Technology of the National Research Council of Canada has conducted a series of resistance, propulsion and manoeuvring tests on a scale model of the Korean icebreaker
Araon attached to a Planar Motion Mechanism (PMM) and in a self-propelled test configuration.
Investigation of the Araon’s podded propulsors and their influence on ice-hull load distribution were conducted in open water and level ice, pack ice, ridges and rubble. The tests included straight, zigzagging, and circular runs with control over propeller shaft speed and pod angle in both configurations.
Ice loads, model position, pod performance characteristics and ice-hull pressures were monitored during these tests. From these measurements the full-scale icebreaking, manoeuvring, and
propulsive capabilities can be predicted and compared with the ship’s actual performance. The tests were used as a study of the hull form’s clearing ability as well as the loading it experiences from encountering ice during different manoeuvres.
ii
ACKNOWLEDGEMENTS
The first author would like to acknowledge her supervisor, Michael Lau, who conducted the test program. Thanks are also due to Dr. Akinturk and the tank and facility personnel for their contribution throughout the test series. Research Council Officer Renee Boileau provided valuable comments and editing of this report. Financial support for the Araon model test
program was partially provided by the Transport Canada and the Marine and Ocean Engineering Research Institute. Their contributions are gratefully acknowledged.
iii TABLE OF CONTENTS 1 Introduction... 1 2 Araon model ... 1 3 Test set-up... 3 3.1 Test facilities... 3
3.2 Model ice production and properties ... 3
3.3 Towed configuration... 5
3.4 Free-running configuration ... 6
3.5 Instrumentation ... 6
3.5.1 Video cameras ... 6
3.5.2 Pressure sensors... 6
3.5.3 Inertial motion sensors... 9
3.5.4 Pod sensors ... 9
3.5.5 Data acquisition system ... 10
3.5.6 Motion capture system (free-running)... 10
3.6 Calibrations ... 11
4 Test Plan ... 13
4.1 Towed test series... 14
4.2 Free-running test series ... 16
5 Conclusions... 16
6 References... 16 Appendix A: Data acquisition system channel assignments...A-1
iv
LIST OF FIGURES
Figure 1: Araon, Korea's first research icebreaker ... 1
Figure 2: Model azimuthing podded propulsion system ... 2
Figure 3: NRC Institute for Ocean Technology Ice Tank Facility ... 3
Figure 4: 1-m and 2-m ice ridges (left) and close-up of a 2-m ice ridge (right) ... 4
Figure 5: Rubble creation (left) and completed rubble (right)... 5
Figure 6: Planar Motion Mechanism (PMM) ... 5
Figure 7: The festoon running from the model to the carriage ... 6
Figure 8: I-Scan® pressure sensing panel applied to model hull ... 7
Figure 9: Sample image from an I-Scan® movie showing pressure distribution... 8
Figure 10: Pressure panelarrangement (except October 7, 2010) ... 8
Figure 11: Pressure panel arrangement (October 7, 2010 only) ... 9
Figure 12: Qualisys™ tracking balls (red circles) ... 11
Figure 13: Pod calibrations for torque and thrust ... 12
v
LIST OF TABLES
Table 1: Particulars for full scale Araon and model ... 2
Table 2: Locations of MotionPak® and ADIS ... 9
Table 3: Global load coefficients of Pod A ... 12
Table 4: Global load coefficients of Pod B... 13
Table 5: Towed test series summary... 14
Table 6: Open water test details for towed series ... 15
Table 7: Ice test details for towed series... 15
SR-2010-22 1
EVALUATING THE PERFORMANCE OF THE KOREAN
RESEARCH ICEBREAKING VESSEL “ARAON” IN ICE
1 INTRODUCTION
The first Korean research icebreaker, Araon, completed its sea trials in January 2010 (Korean Herald, 2010). The vessel, driven by azimuthing podded propulsors, can be seen in Figure 1. A model of the Araon was fabricated at the NRC Institute for Ocean
Technology (IOT) for predicting the performance of the ship in ice. . Two test series conducted on the model are discussed in this report: the evaluation of the Araon’s manoeuvring ability in ice environments using a model mounted on a Planar Motion Mechanism (PMM)and with a free-running model in the second phase of a three-year project. Both the PMM and free-running model tests were conducted at IOT in various ice conditions including level and pack ice. Limited tests were also performed in ridges and rubble ice.
Figure 1: Araon, Korea's first research icebreaker
The overall objective of these tests was to obtain data to assist in the development of podded propulsion and pressure simulation models to be implemented in the IOT OSIS (Ocean Structure Interaction Simulation) software for manoeuvring simulation of ships with podded propulsion. The model is equipped with pressure measuring sensors to monitor the pressure distribution along ship hull during manoeuvres. In both series of model tests, the performance of the azimuthing podded propulsion system on the model was examined while manoeuvring in a variety of ice environments. Section 2 of this report will look at the specifics of the model. Section 3 describes the facilities and procedures, the test series configurations, and the instrumentation. Section 4 describes the test plan. The conclusions are given in Section 5, followed by a references section. 2 ARAON MODEL
The model Araon is a 1:20 scale model of the icebreaking vessel. The model particulars along with that of the full-scale vessel are shown in Table 1 below.
SR-2010-22 2
Table 1: Particulars for full scale Araon and model
Particular Units Full Scale Model Scale
Ship Overall Length m 107.2 5.360 Breadth m 19 0.950 Draft m 6.8 0.340 Displacement kg 409.6 Propeller Diameter m 0.200 Number of Blades - 4
Expanded Area Ratio (EAR) - 0.6
Pitch Distribution (P/D) - 1
The ballast added to the model was 517.4 kg, giving it a total displacement of 927 kg and a metastatic height (GM) of 9.54 cm.
The model is equipped with an azimuthing podded propulsion system. Azimuthing pods are appendages that drive a vessel, usually attached beneath the stern. The pods are able to rotate a full 360 degrees, thus providing propulsive power and manoeuvrability
without a rudder. Figure 2 shows the two pod units on the Araon model in the IOT Model Prep Shop.
SR-2010-22 3
3 TEST SET-UP
The test plan included two test series, one with the model towed under the control of a Planar Motion Mechanism and the other with the model running free. The facilities and ice conditions were common to both test series and are described in this section, followed by the configurations for the test series and the instrumentation used in the tests.
3.1 Test facilities
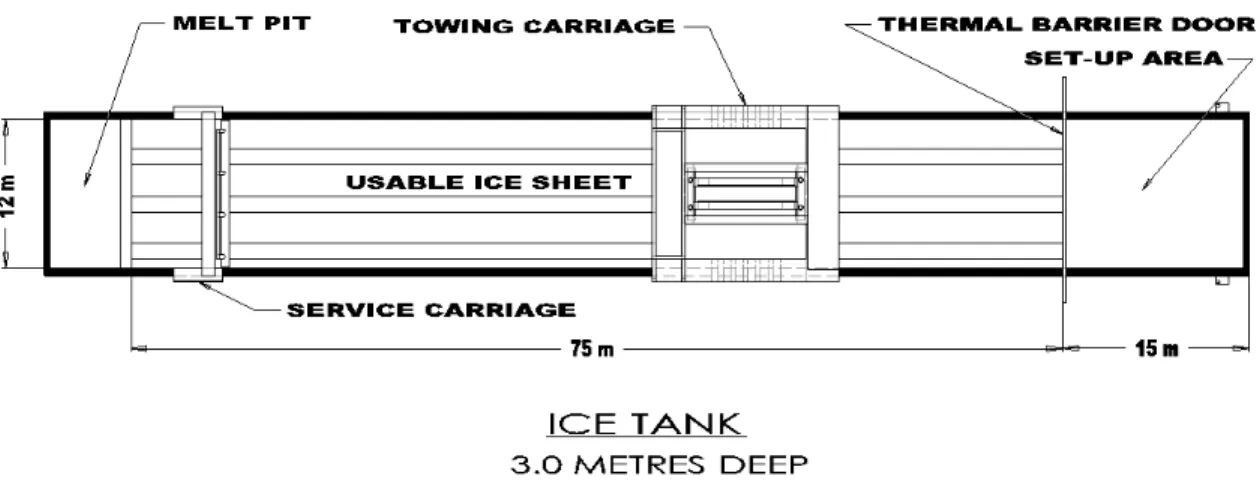
The IOT Ice Tank Facility (Figure 3) has two carriages that run along rails down the tank: the towing carriage and the service carriage. The model is connected to the towing
carriage, which houses the data acquisition system. Tests can be observed from above directly or underwater via video camera attached to an underwater carriage. The towing carriage can reach a speed of 1 m/s with the underwater carriage attached and 3 m/s without it. The service carriage is used as a work platform from which technicians measure ice properties for all areas of the ice sheet.
Figure 3: NRC Institute for Ocean Technology Ice Tank Facility 3.2 Model ice production and properties
IOT has the capability to grow ice sheets with a wide range of thicknesses and strengths. The experiments were carried out in EG/AD/S ice (Spencer and Timco, 1990). The inclusion of air bubbles into the growing ice sheet significantly improves the scaling of model ice density and elastic property.
To prepare the ice tank and seed and grow the ice sheet, IOT work procedures TNK 22, TNK 23, and TNK 37, respectively, were followed. Depending on the thickness, each ice sheet was grown over 24 to 48 hours. The thicknesses used during this test series were 20 mm, 40 mm and 60 mm. The target strength was 35 kPa.
At the beginning of each ice tank testing day, the initial ice properties were measured following IOT standards. The following mechanical properties of the ice were measured
SR-2010-22 4
according to the relevant procedures: flexural strength (TNK 26), elastic modulus (TNK 27), compressive strength (TNK 28) and ice density (TNK 30). Ice thickness
measurements were performed according to procedure TNK 25. Frictions tests were also performed.. All tests (excluding elastic modulus and frictions tests, due to time
limitations) were done at various locations and periodically throughout level ice tests. Each ice sheet was first used to do level ice tests and, when all the available ice was used, the level ice was broken up to form pack ice. In level ice tests, channel width and
thickness measurements were taken after each run. Pack ice was formed at three
progressively scarcer concentrations: nine-tenths, eight-tenths and six-tenths. To achieve each concentration, some of the ice was moved out of the tank into the melt pit and the remaining ice pieces were distributed equally across the tank. Each time the ice was rearranged, photos were taken of the concentration with a 1-m by 1-m grid so that the concentrations could be determined later.
Ridges were created with a 20 mm ice sheet. Thirty-two metres of the ice sheet were used to build two ridges (a 1-m ridge and a 2-m ridge) shown in Figure 4.
Figure 4: 1-m and 2-m ice ridges (left) and close-up of a 2-m ice ridge (right)
Rubble was created with the ice after the ridge runs were completed. Remaining level ice was broken into small pieces and compressed to twice the nominal thickness and then triple the nominal thickness, shown in Figure 5.
For the runs with ice ridges or rubble, a DART computer system acoustically analyzes the profile of the ice. The system uses six acoustic sensors to detect the thickness of the ice as the carriage moves through it.
SR-2010-22 5
Figure 5: Rubble creation (left) and completed rubble (right) 3.3 Towed configuration
During towed tests, the model is attached to a Planar Motion Mechanism (PMM), a frame equipped with sensors and a feedback system to control the motion of the model. Load cells in the PMM measure the forces exerted on the model during testing. The PMM used in this test series controls the sway, surge and yaw motions. The remaining three degrees of motion (heave, roll and pitch) are free, but these are measured in addition to the
controlled motions for inclusion in the analysis. Prior to tests, the PMM is programmed to guide the model in a particular path through the medium (water or ice), without the aid of the model’s propulsion system. The propulsion units remain oriented with zero azimuth angles during turning manoeuvres. Figure 6 shows the model mounted on the PMM below the towing carriage.
SR-2010-22 6
3.4 Free-running configuration
During free-running tests, the model is only connected loosely to the towing carriage via instrumentation cables. During these tests, a festoon of cables is strung from the model up to the carriage, as seen in Figure 7. The festoon includes two power cables, an emergency stop cable for the pod motors, a “sync” cable for ensuring all data channels are
synchronized and a network cable. The model motion is tracked using a camera motioin capture system.
Figure 7: The festoon running from the model to the carriage 3.5 Instrumentation
The sensors used to measure and record the motion of and loads on the model are described here.
3.5.1 Video cameras
The towing carriage was equipped with two cameras above the water. An underwater tow carriage could also be attached to this carriage to follow the runs down the tank with two underwater video cameras. The two underwater cameras were used to follow the bow and the stern of the model during runs. A handheld video camera was also used to capture the run from above. Videos are used to analyze the vessel’s ice clearing ability and the interaction between ice and the propellers.
3.5.2 Pressure sensors
Pressure on the hull was measured using Tekscan® I-Scan® tactile pressure sensor panels. They were applied to the outside of the model hull, as shown in Figure 8.
SR-2010-22 7
Figure 8: I-Scan® pressure sensing panel applied to model hull
Each panel has a layer of electrically conductive electrodes in rows and a second layer in columns, both contained between two thin sheets of polyester resin. The electrical resistance at the intersection of the rows and columns, called a ‘sensel,’ changes as the pressure or applied force changes. Each panel contains approximately 2,000 sensels. The measured resistance is converted into a meaningful digital output by calibrating the panels. The pressure data recorded by the panels is represented by a color-sensitive map, shown in Figure 9.
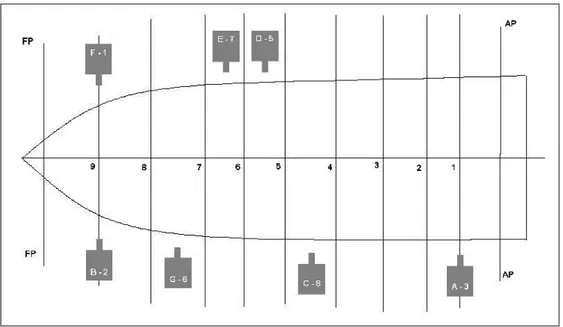
There were eight pressure-sensing panels along with four spares located on the hull of the model. The arrangement for this test series can be seen in Figure 10.
SR-2010-22 8
Figure 9: Sample image from an I-Scan® movie showing pressure distribution.
Figure 10: Pressure panelarrangement (except October 7, 2010)
Near the beginning of the test series, the bow of the model was swamped. One of the pressure panel handles failed, so the panel arrangement was modified (Figure 11) for that day until the handle had dried.
SR-2010-22 9
Figure 11: Pressure panel arrangement (October 7, 2010 only) 3.5.3 Inertial motion sensors
The motion of the model during both of the test series was measured using two six degree-of-freedom inertial sensing systems: an Analog Devices ADIS and a Systron Donner MotionPak®. The ADIS uses a tri-axis gyroscope and a tri-axis accelerometer to measure the accelerations along and about the three orthogonal axes. The MotionPak has three angular rate sensors and three linear accelerometers. The locations of the two systems in the model are given in Table 2 below.
Table 2: Locations of MotionPak® and ADIS
Location
x y z
Component from aft perp. from centreline from baseline
MotionPak® (rel. to
component centre) 2.330 m 0.000 m 0.096 m
from aft perp. from aft perp. from aft perp. ADIS (rel. to port,
aft corner) 2.534 m 0.000 m 5 + 0.5*z-dim
3.5.4 Pod sensors
The pod and instrumentation system shown in Figure 12 is a schematic of the Araon pod units used in these model tests. The system includes an instrumented propeller hub, a custom mitred gearbox, an azimuth drive system, a propeller drive system, a hull
SR-2010-22 10
mounting and seal assembly, and a six-component balance for measuring global loads on the pod.
Figure 12: Fully instrumented IOT podded propulsor model
This system has the ability to measure forces and moments acting on the propeller and pod. It measures unit thrust (Tunit), propeller thrust at the propeller hub (Tprop), propeller
torque (Q) and forces along the three coordinate axes.
The unit thrust is the net thrust available for propelling the ship. It includes not only the thrust from the prpeller but also the drag and other hydrodynamic forces acting on the pod-strut body. The unit thrust is of particular interest, as it is used to power predictions for podded propellers.
3.5.5 Data acquisition system
Four computers were used for data acquisition during the tests. The channel assignments for these computers for both series are provided in the appendix.
3.5.6 Motion capture system (free-running)
The Qualisys™ motion capture system uses video cameras and strategic lights for measuring position and motion. This system is used during free-running tests to measure motion along the x-, y- and z-axes and to record the position of the model relative to the reference point on the carriage. The system uses two infrared cameras in calibrated positions above the model to track lighted balls (LED*) on the model. The cameras record the change in position of the LEDs in the x-, y- and z- directions digitally. The Qualisys™ component layout is shown in Figure 13.
SR-2010-22 11
Figure 13: Qualisys™ tracking balls (red circles) 3.6 Calibrations
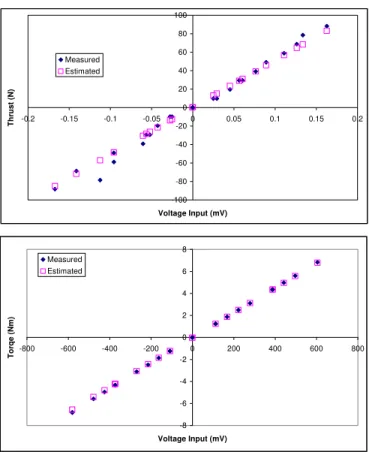
Each of the sensor systems was calibrated prior to model tests. The pressure sensing panels were calibrated by applying a force of the same nominal magnitude to each panel and analyzing the video and comma-separated-values file that were produced. The inertial motion sensors were also calibrated using known loads. The pod sensors were also calibrated – sample calibrations for pod thrust and torque are plotted in Figure 14.
SR-2010-22 12 -8 -6 -4 -2 0 2 4 6 8 -800 -600 -400 -200 0 200 400 600 800 Voltage Input (mV) Torqe (Nm) Measured Estimated -100 -80 -60 -40 -20 0 20 40 60 80 100 -0.2 -0.15 -0.1 -0.05 0 0.05 0.1 0.15 0.2 Voltage Input (mV) Thrust (N) Measured Estimated
Figure 14: Pod calibrations for torque and thrust
As shown in the graphs, the data passes through the origin and the calibration is accurate. Table 3 and Table 4 give the coefficients found appropriate through calibration checks for linking measured voltage to applied global loads during model testing.
Table 3: Global load coefficients of Pod A
Matrix of coefficients: POD A
-35.5129 -0.1642 0.154791 -0.75698 -0.04769 1.17232 -0.01792 35.28118 -0.59839 0.389975 -0.62439 0.32297 -0.24004 -0.46427 36.47618 0.390983 -0.73618 0.377865 0.118173 -0.44722 0.401507 35.11293 0.439239 -0.89178 -0.09245 -0.19738 0.295241 0.081224 35.30244 0.04001 -0.0024 -0.34217 0.398308 -0.59341 0.348486 37.4199
SR-2010-22 13
Table 4: Global load coefficients of Pod B
Matrix of coefficients: POD B
-36.6161 0.044111 -0.18384 -1.58415 -0.21798 1.403171 0.245885 -36.8381 0.919211 -0.52589 0.398401 -0.48928 0.031673 0.54396 -35.3088 -0.19191 0.269059 -0.40929 -0.16336 0.019749 -0.15834 38.18493 1.293027 -1.72161 -0.12762 -0.34566 0.061799 0.14406 36.16419 -0.62109 -0.20719 -0.18249 0.054154 -0.76376 1.087998 35.27994
The alignment of the PMM was calibrated by completing a yaw sweep. A sample graph from a yaw sweep is in Figure 15. If the yaw angle offset measured by the PMM
exceeded 0.2 degree, then the PMM alignment would be adjusted.
y = 1.5393x + 0.1214 R2 = 0.9993 -10 -8 -6 -4 -2 0 2 4 6 8 10 -6 -4 -2 0 2 4 6
PMM Yaw Zero Setting (deg)
T o ta l S w a y F o rc e (F y ,to t; N ) .
Figure 15: Yaw sweep to calibrate the PMM
The video motion capture system was calibrated by positioning a frame with LED lights on it where the model would be located and positioning the cameras about it. The cameras have a 3-m x 3-m range. (This calibration was repeated after a sudden stop caused one camera to move.)
4 TEST PLAN
The test plan includes various manoeuvres with the model either attached to the PMM or in free-running configuration. In both cases, tests were performed in ice and in open water.
SR-2010-22 14
4.1 Towed test series
The PMM tests included resistance and propulsion and manoeuvring runs. The
manoeuvring runs included turning circle and pure yaw. In this series, the motion of the model during each test was controlled by the PMM, which is pre-programmed to follow a set course for each run. These tests are summarized in Table 5. The target ice sheet thicknesses were 20, 40 and 60 mm, with a standard target flexural strength of 35 kPa. Table 6 describes the tests performed in clear water and Table 7 describes the set of tests performed consistently for each ice sheet. Each ice sheet was prepared for level ice tests followed by pre-sawn tests and finally three pack ice concentrations (nine-, eight- and six-tenths).
Table 5: Towed test series summary
Day Description
Days 1, 2 & 3 Set-up: PMM, model, DAS
Days 4 & 5 Open Water: Resistance, Propulsion, PMM Manoeuvring Day 6 Grow Sheet 1 (40mm)
Day 7 Resistance and Propulsion (40mm) Day 7 Grow sheet 2 (20 mm)
Day 8 Resistance and Propulsion (20 mm) Day 8 Grow sheet 3 (60 mm)
Day 10 Resistance and Propulsion (60 mm) Day 11 Grow sheet 4 (40 mm)
Day 12 PMM Manoeuvring Turning Circle (40 mm) Day 12 Grow Sheet 5 (20 mm)
Day 13 PMM Manoeuvring Turning Circle (20 mm) Day 13 Grow Sheet 6 (60 mm)
Day 15 PMM Manoeuvring Turning Circle (60 mm) Day 16 Clearwater: Manoeuvring and Propulsion Day 16 Grow sheet 7 (20 mm)
Day 17 Sheet 7 + ridges: Ridge Penetration, ahead Day 17 Grow sheet 8 (20 mm)
Day 18 Sheet 8 + ridges: Ridge Penetration, astern Day 18 Grow sheet 9 (20 mm)
Day 19 PMM Manoeuvring Pure Yaw (20 mm) Day 20 Decommission
SR-2010-22 15
Table 6: Open water test details for towed series
SR-2010-22 16
4.2 Free-running test series
The free-running test series included straight runs and manoeuvring in open water and various ice conditions. The manoeuvring runs included turning circles and zigzags. Straight runs and turning circles were done at shaft speeds of 2.8, 8.1, 10.7, and
13.3 rps. Both straight and turning runs were done in open water, level ice, nine-tenths pack ice, eight-tenths pack ice, and six-tenths pack ice and in ice thicknesses of 20 mm, 40 mm, and 60 mm. Straight runs were also completed in ridges and rubble. A summary of the test plan is given in Table 8.
Zigzag runs were completed in open water, level ice, and pack ice. During zigzag runs, the pods are set to a fixed azimuth angle. When the model reaches the same heading as the initial azimuth angle, the pods turn to the opposite angle. This is repeated as the model continues in a zigzag path down the tank.
Table 8: Free-running test series summary
5 CONCLUSIONS
The test series discussed in this report were successful in evaluating the performance of the Korean icebreaker Araon. Between the towed and free-running configurations, a wide range of test runs was completed. This greatly broadens the scope of knowledge on the vessel’s manoeuvring abilities in open water and in a variety of ice conditions. The azimuthing propulsion system was also evaluated in ice and open water.
6 REFERENCES
[1] Korean Herald (2010). Korean Icebreaker Ready to Explore Antarctic Station Candidate Site. Accessed November 1, 2010. Available at:
http://www.koreaherald.co.kr/national/Detail.jsp?newsMLId=20100201000085 [2] Lau, Michael (2006). Preliminary Modeling of Ship Maneuvering in Ice using a
PMM. National Research Council, Institute for Ocean Technology, 2006. St. John’s, NL, TR-2006-02
SR-2010-22 17
[3] Spencer, D.S. and Timco, G.W. (1993).CD Model Ice - A Process to Produce Correct Density (CD) Model Ice. Proceedings of the 10th International IAHR Symposium on Ice, Vol. 2, Espoo, Finland, pp. 745-755.
APPENDIX A
SR-2010-22 A-1
APPENDIX A: DATA ACQUISITION SYSTEM CHANNEL ASSIGNMENTS
Configuration 1, Group 1 (ICEDAS, 50Hz)
Channel No. Sensor Name Sensor Model Serial No. Data Description
1 Inline Load S-Type A10643 Force (N)
12 Surge Qualisys™ Displacement (m)
14 Sway Qualisys™ Displacement (m)
15 Heave Qualisys™ Displacement (m)
16 Yaw Qualisys™ Angle (deg)
17 Pitch Qualisys™ Angle (deg)
18 Roll Qualisys™ Angle (deg)
19 RMS Qualisys™ Voltage (V)
20 sync pulse Voltage (V)
31 Carriage_Pos Displacement (m)
32 Carriage_Vel Velocity (m/s)
SR-2010-22 A-2
Configuration 1, Group 2 (DASPC21, 50Hz)
Channel No. Sensor Name Sensor Model Serial No. Data Description
1 x accel MotionPak® 0683/018698 Acceleration (gee) 2 y accel MotionPak® 0683/018698 Acceleration (gee) 3 z accel MotionPak® 0683/018698 Acceleration (gee) 4 x rate MotionPak® 0683/018698 Angular Velocity
(deg/s)
5 y rate MotionPak® 0683/018698 Angular Velocity (deg/s)
6 z rate MotionPak® 0683/018698 Angular Velocity (deg/s)
7 DAS sync signal Angle (deg)
8 Model Roll 169549 Angle (deg)
9 Model Pitch 169550 Angle (deg)
10 FWD Heave 200282 Displacement (m)
SR-2010-22 A-3
Configuration 1, Group 3 (DASPC23, 100Hz)
Channel No. Sensor Name Sensor Model Serial No. Data Description
1 Pod 1, Azimuth Angle Angle (deg)
2 Pod 2, Azimuth Angle Angle (deg)
5 POD A rps Angular Velocity (rps)
6 POD B rps Angular Velocity (rps)
7 Sync Signal Voltage (V)
8 ADIS Supply Voltage (V)
9 ADIS X Rate Angular Velocity
(deg/s)
10 ADIS Y Rate Angular Velocity
(deg/s)
11 ADIS Z Rate Angular Velocity
(deg/s)
12 ADIS X Accel Acceleration (gee)
13 ADIS Y Accel Acceleration (gee)
14 ADIS Z Accel Acceleration (gee)
15 ADIS X Temp Temperature (°C)
16 ADIS Y Temp Temperature (°C)
SR-2010-22 A-4
Configuration 1, Group 4 (DASPC27, 5000Hz)
Channel No. Sensor Name Sensor Model Serial No. Data Description
1 Pod S, Fxa E50407 Voltage (V)
2 Pod S, Fy1a E50185 Voltage (V)
3 Pod S, Fy2a E50406 Voltage (V)
4 Pod S, Fz1a E50400 Voltage (V)
5 Pod S, Fz2a E50204 Voltage (V)
6 Pod S, Fz3a E50184 Voltage (V)
9 Pod P, Fxb E50413 Voltage (V)
10 Pod P, Fy1b E50384 Voltage (V)
11 Pod P, Fy2b E50170 Voltage (V)
12 Pod P, Fz1b E50417 Voltage (V)
13 Pod P, Fz2b E50403 Voltage (V)
14 Pod P, Fz3b E50194 Voltage (V)
17 Pod S, Thrust Ta 14381 Voltage (V)
18 Pod S, Torque Qa A Voltage (V)