Received 10 October 2013; revised 11 November 2013; accepted 11 November 2013; published 11 December 2013.
[1] Sulfur concentrations have been measured in 28 melt
inclusions (MIs) in plagioclase, clinopyroxene, and olivine crystals extracted from tephra produced during the explosive eruption of Grímsvötn in May 2011. The results are compared to sulfur concentrations in the groundmass glass in order to estimate the mass of sulfur brought to surface during the eruption. Satellite measurements yield order of magnitude lower sulfur (~ 0.2 Tg) in the eruption plume than estimated from the difference between MI and the groundmass glass. This sulfur “deficit” is readily explained by sulfur adhering to tephra grains but principally by sulfide globules caused by basalt-sulfide melt exsolution before degassing. A mass balance calculation reveals that approximately ~ 0.8 Tg of SO2 is present as globules, representing ~50% of the total sulfur budget. Most of the sulfide globules likely reside at depth due to their elevated density, for potential later remobilization by new magma or hydrothermal circulation.
Citation: Sigmarsson, O., B. Haddadi, S. Carn, S. Moune, J. Gudnason, K. Yang, and L. Clarisse (2013), The sulfur budget of the 2011 Grímsvötn eruption, Iceland, Geophys. Res. Lett.,
40, 6095–6100, doi:10.1002/2013GL057760.
1. Introduction
[2] Sulfur degassing from hot spot-related volcanoes is an
important contribution to the total mass loading of the atmo-sphere [e.g., Wallace, 2001]. The mass loading of sulfur can be estimated directly from satellite measurements of sulfur di-oxide in the eruptive plume or indirectly from the difference in sulfur concentrations in pristine melt inclusions (MIs) and outgassed groundmass glass (the so-called petrologic method) [Devine et al., 1984]. The sulfur budget at volcanoes from sub-duction zone settings is often underestimated by the petrologic method but at hot spot-related volcanoes, a relatively good agreement has been found from both methods [e.g., Sharma et al., 2004; Moune et al., 2007]. An excellent opportunity to
test the consistency between these two methods came during the 2011 eruption of Grímsvötn volcano, Iceland.
2. The 2011 Grímsvötn Eruption
[3] Grímsvötn is the most active volcano in Iceland,
located beneath the Vatnajökull ice sheet. A subglacial cal-dera lake is maintained by extensive geothermal activity leading to periodic water outburstfloods or jökulhlaups that may empty the lake. The resulting pressure release is often followed by a small eruption such as the November 2004 eruption, which produced 0.02 km3DRE (dense rock equiv-alent) volume of basaltic tephra [e.g., Thorarinsson, 1974; Albino et al., 2010; Jude-Eton et al., 2012]. The 2011 erup-tion began at 19 UTC on 21 May. The plume quickly rose to 20–25 km [Petersen et al., 2012] impacting aviation in Northern Europe. The eruption ended on 28 May having produced an order of magnitude larger volume of magma than in 2004, or approximately 0.2– 0.3 km3 DRE, with tephra fallout detected outside Iceland in Jan Mayen, the British Isles, and Scandinavia [Gudmundsson et al., 2012]. Most of the magma was erupted during thefirst 2 days, and its composition was uniform, namely a quartz normative tho-leiitic basalt typical of the last 7000 years of activity at Grímsvötn [Óladóttir et al., 2011a]. It has sparse phenocrysts of plagioclase (plag), clinopyroxene (cpx), and olivine (ol) in decreasing order of abundance. The ubiquitous presence of magnetite and rare occurrence of sulfide globules in the 2011 tephra are observed here for thefirst time in Grímsvötn deposits (Figure 1).
[4] Fourfine-grained tephra samples were collected during
the eruption on the lowland 45–75 km south of the volcano (three samples collected at different localities on a transect through the tephra fall sector (Gv1–3) during the first erup-tion night and a bulk sample representing thefirst 4 days of the eruption (Gv4)). In addition, near-vent lapilli-sized tephra from thefirst eruption day was later sampled on the caldera rim 1 km south of the eruption site (sample Gv2011-D). The 2011 tephra is composed of glass (95–99%) with only 1–5% of visible crystals.
3. Analytical Methods and Results 3.1. Petrologic Estimate of S Degassing
[5] Olivine, cpx, and plag crystals were handpicked under
a binocular microscope from the 100–250 and 250–600 μm grain size fractions of crushed tephra. Crystals with MI were washed with acetone, embedded in epoxy and polished indi-vidually to generate adequate exposure of the MI for in situ electron probe microanalysis. The MIs are spherical to oblate in shape and range in size from 5 to 190μm. Most MIs contain shrinkage bubbles but all are totally deprived of daughter minerals. In total, 19 crystals containing 28 MIs were
Additional supporting information may be found in the online version of this article.
1
LMV, CNRS-UBP-IRD, Clermont-Ferrand, France.
2ISE, University of Iceland, Reykjavik, Iceland. 3
Department Geological Mining Engineering and Sciences, Michigan Technological University, Houghton, Michigan, USA.
4
Atmospheric Chemistry and Dynamics Laboratory, NASA Goddard Space Flight Center, Greenbelt, Maryland, USA.
5
Department of Atmospheric and Oceanic Science, University of Maryland, College Park, Maryland, USA.
6
Spectroscopie de l’Atmosphère, Service de Chimie Quantique et Photophysique, Université Libre de Bruxelles, Brussels, Belgium.
Corresponding author: O. Sigmarsson, LMV, CNRS-UBP-IRD, 5 rue Kessler, 63038 Clermont-Ferrand, France. (olgeir@opgc.univ-bpclermont.fr) ©2013. American Geophysical Union. All Rights Reserved.
selected and prepared for analysis. The number of host crystals with MI reflects the relative abundance in the phenocryst assemblage; 21 MIs in 13 plag, 6 in 5 cpx, and a single 1 in an ol. The groundmass is composed of glass patches with var-iable microlite contents ranging from those that are completely free of microlites to heavily crystallized groundmass.
[6] Major element and sulfur concentrations were measured
on a Cameca SX-100 microprobe at Laboratoire Magmas et Volcans in Clermont-Ferrand, France. The results are given in Table S1 in the supporting information, and analytical details and uncertainties are listed in Óladóttir et al. [2011b] and Moune et al. [2012]. The largest MIs were analyzed with a spot diameter of 20μm and sample current of 8 nA, whereas the three smallest MIs were analyzed with a beam of only 1 μm and a current as low as 2 nA. Most MIs are of basaltic composition, but three basaltic icelandite compositions are observed as well. The groundmass glass composition is com-parable to that of other Grímsvötn tephra.
[7] Sulfur concentrations in the MI vary from 1311 to 1982
ppm (Table S1), whereas lower values are measured in the groundmass glass (449 to 895 ppm; mean = 651 ± 52 (2 SE) ppm; 26 glass grains; Table S2). The microlite-free glass has higher S concentrations than those that are rich in microlites, suggesting degassing induced crystallization. The S concentra-tions in the MI exceed the sulfide saturation curve of submarine mid-ocean ridge basalt glasses [e.g., Wallace and Edmonds, 2011] in accordance with the presence of sulfide globules in Grímsvötn 2011 tephra (Figure 1c). Sulfide saturation and known sulfur content at sulfide saturation (SCSS) level in basalts [Jugo, 2012] suggest that the Grímsvötn magma has oxygen fugacity close to fayalite-magnetite-quartz.
3.2. Satellite-Based SO2and H2S Measurements [8] We use ultraviolet (UV) measurements from the Ozone
Monitoring Instrument (OMI) aboard NASA’s polar-orbiting Aura satellite to quantify SO2 emissions during the 2011 Grímsvötn eruption. Although OMI data are currently im-pacted by a sensor anomaly that reduces the spatial cover-age of the sensor [Carn et al., 2013], the high latitude of Grímsvötn mitigated this by providing numerous overlapping OMI orbits that covered the SO2cloud. The eruption began late in the afternoon of 21 May, and thefirst complete cover-age of the eruption cloud by OMI (daytime only) occurred on 22 May at ~11:50 UTC. A notable feature of the eruption was a distinct separation of the SO2 and ash-rich portions of the volcanic cloud (Figure 2), with the ash cloud advected south and then east of Grímsvötn at lower altitudes, while the stratospheric SO2drifted north.
[9] Operational OMI SO2retrievals using the linearfit (LF) algorithm [Yang et al., 2007], assuming a lower stratospheric altitude (note that the precise SO2altitude has little impact on SO2 loading above ~10 km), detected ~ 0.2 Tg of SO2in the eruption cloud on 22 May. Errors on SO2retrievals are estimated to be ~20%. A peak SO2loading of ~ 0.3 Tg was measured by OMI on 23 May when the volcanic cloud had spread over eastern Greenland and the Greenland Sea. In order to exclude the potential underestimation of large SO2 column amounts by the LF algorithm, we also analyzed extended iterative spectralfit (EISF) retrievals [Yang et al., 2010] for the Grímsvötn plume. The EISF measurements were commensurate with the LF results, providing confidence in the calculated SO2 loadings. The SO2 loading gradually decayed after 23 May, with remnants of the stratospheric
a b
c d
50 µm BSE 15 kV 50 µm BSE 15 kV
20 µm BSE 15 kV 100 µm BSE 15 kV
Figure 1. Backscattered electron images of (a) phenocryst-poor but microlite-rich glass, (b) phenocryst-rich tephra grain with euhedral plagioclase, clinopyroxene, and titanomagnetite in a microlite-free glass, and (c) sulfide globule in tephra Gv2011-D. (d) Melt inclusion in clinopyroxene.
SO2 cloud detected by OMI until early June. We estimate an e-folding time of ~10–15 days for the stratospheric SO2, and extrapolation of the daily SO2loadings back to the erup-tion time yields an initial SO2 mass within the 20% error on the peak measured value of 0.3 Tg. The SO2emissions dur-ing the 2011 eruption of Grímsvötn were around an order of magnitude higher than those measured by OMI during its November 2004 eruption, which concurs with the different magma volumes erupted.
[10] Other potentially significant sulfur species in
diver-gent plate volcanic gases are H2S and S2 [Symonds et al., 1994]. The latter is not measurable using remote sensing techniques but to assess H2S emissions from Grímsvötn, we use satellite data from the Infrared Atmospheric Sounding Interferometer (IASI) aboard MetOp-A [Clarisse et al., 2011]. IASI measured a maximum of 29 Gg of H2S on 22 May, collo-cated with the SO2cloud; this is only the second reported satellite-based detection of H2S in a volcanic plume after the 2008 Kasatochi eruption [Clarisse et al., 2011]. IASI also measured ~ 0.3 Tg of SO2in the Grímsvötn volcanic cloud, corroborating the OMI data. This yields a H2S/SO2 mass ratio of ~ 0.1, which is similar to average ratios reported for directly sampled rift volcanic gases derived from tholeiitic basalts (0.06) [Symonds et al., 1994]. Based on this concur-rence, we use reported S2/SO2ratios [Symonds et al., 1994] to estimate a maximum S2loading of ~15 Gg. Hence, the to-tal estimated sulfur loading based on satellite data is 150 Gg (as SO2) + 27 Gg (as H2S) + 15 Gg (as S2) = 0.192 Tg S.
[11] Textor et al. [2003] modeled scavenging of volcanic
gases on hydrometeor-ash aggregates in eruption columns, concluding that 80% of sulfur gases (SO2and H2S) would reach the stratosphere. Olsson et al. [2013] have estimated from leaching experiments on freshly fallen 2011 Grímsvötn tephra that approximately 118 Gg of S were sequestered on the volcanic ash during the eruption. In conjunction with the satellite measurements, this implies that a total of 0.31 Tg of S was emitted during the 2011 Grímsvötn eruption, of which 0.192 Tg reached the stratosphere and 0.118 Tg (~38%) was scavenged in the eruption column. We suggest that this high scavenging efficiency (38% cf. 20% estimated by Textor et al. [2003]) reflects the wet nature of the subglacial Grímsvötn eruption, with abundant hydrometeors.
4. Discussion
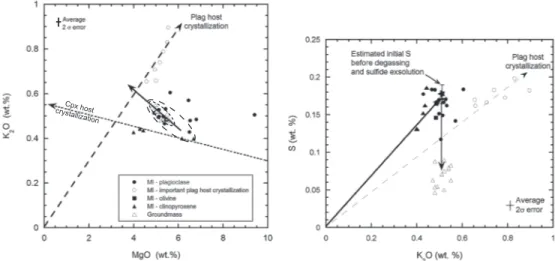
[12] The sulfur concentration in the melt before degassing
can be estimated from the measured concentration in the MI. The regular increase in K2O, with decreasing MgO con-tent in the groundmass glass (Figure 3a), permits assessment of the significance of the S concentrations in the different MIs. These variable S concentrations reflect, in part, host crystallization of the initial MI. Such crystallization can be readily corrected for olivine, which has a well-defined equi-librium KDof Fe and Mg exchange between melt and crystal [e.g., Roeder and Emslie, 1970]. Corrections for cpx and plag crystallization are less straightforward. Therefore, we use the Figure 3. Variations of S, MgO, and K2O concentrations (in weight %) in melt inclusions (MIs) and groundmass glass in tephra samples Gv2011-D and GV-4. (a) Groundmass glass compositions form a linear array (R2= 0.71) upon which MI in olivine and several MIs in plagioclase plot. Other plagioclase (plag) MIs are subject to host crystallization as shown by a vector extending from the plag composition at the origin. Same holds for MI plotting above the groundmass glass array. Three MIs in clinopyroxene (cpx) with lowest MgO concentration lie on a vector from the cpx composition passing through the most primitive cpx MI. (b) Initial S concentration is estimated by extrapolating the K2O concentrations measured in the most primitive cpx MI along the melt differentiation vector toward the groundmass value (from 0.4 to 0.5% yielding initial S of 1750 ppm). This value is indistinguishable from that measured in the most primitive plag MI (1772 ppm) and close to the average cpx MI value (1558 ppm; see text for further discussion). The vertical arrow indicates sulfur decrease caused by combined basalt-sulfide melt immiscibility and sulfur degassing.
Figure 2. Aura/OMI measurements of SO2column amounts in the Grímsvötn eruption cloud on (a) 22 May (b) 23 May, and (c) 24 May. Volcanic ash is indicated by positive values of the UV aerosol index. Note the distinct separation of tropospheric ash and stratospheric SO2, due to strong vertical wind shear. Triangle indicates the location of Grímsvötn.
relationship between two incompatible elements in plag, namely K2O and MgO (Figure 3a). The MIs forming a linear correlation extrapolated from the origin are clearly affected by plag host crystallization. Other MIs in plag that have sig-nificantly higher MgO and K2O than the groundmass glass may have also experienced host crystallization. The plag MI (G1-D1) with abnormally high MgO and lowest S con-centration is clearly an outlier, possibly a xenocryst in the 2011 magma. By the same token, the cpx MIs with the lowest MgO concentration lying on a vector extrapolated from the concentrations measured in the ferromagnesian minerals (cpx and ol with respectively MgO and K2O concentrations equal to 17.4; 0.02 and 37.5; 0%) may have been affected by host crystallization as well. The initial S concentration in the magma thus appears best represented by the relatively primitive cpx MIs with 8> MgO > 6%. We note that these MIs lie at the low K2O and high MgO end of the differentia-tion trend of the groundmass composidifferentia-tion as expected for a parental magma composition for Grímsvötn. These two MIs have K2O values close to 0.4%, whereas the degassed groundmass glass has average K2O of 0.5%. We have there-fore corrected their S concentration for 20% fractional crystal-lization (needed to explain K2O increase from 0.4 to 0.5%) [see Moune et al., 2007] to obtain an initial S concentration (Sinitial) of 1750 (± 125; 2σ) ppm (Figure 3b). A plag MI that plots close to these two cpx MIs has sulfur concentration of 1772 (± 58; 2σ) ppm that is indistinguishable from our Sinitial estimate. It is worth noting that this selective choice of MI does not affect the outcome of this paper since the average compo-sition of all MIs in cpx yields an initial S concentration less than 10% lower (X = 1558 (± 440; 2σ) ppm instead of esti-mated 1750 (± 125; 2σ) ppm), which is within the error of our approach.
[13] The mass of sulfur exsolved from the initial magma can
be estimated as follows (the petrologic method; Table 1): mass SO2=α ρ VDRE(Sinitial Sgroundmass); whereα = MW(SO2)/ MW(S) = 64.06/32.06, ρ = 2750 kg m 3 [McBirney, 2006] and VDRE= 0.25 km3. This yields 1.47 ± 0.37 Tg (2σ) that is an order of magnitude larger than the sulfur loading from the satellite data. The considerably lower S concentrations in the groundmass glass relative to the MI thus cannot be explained by S degassing only. Presence of sulfide globules demonstrates that sulfide saturation had been reached, which therefore presents a sulfur sink. In addition, ~118 Gg of S adhered to the tephra in the eruption column, while resid-ual magma from the 2004 eruption (erupted in 2011) may have lost part of its sulfur to the hydrothermal system and the caldera lake. Ágústsdóttir and Brantley [1994] estimated a steady state
sulfurflux of 5.33 × 10⁶kg/yr from Grímsvötn’s lake compo-sition and volumes of jökulhlaups, which gives 37 Gg over the 7 years repose period preceding the 2011 eruption. The mass balance for the S budget in the Grímsvötn 2011 eruption is thus Sinitial (Sgroundmass glass+ Ssatellite+ Sleachate+ Slake+ Ssulfide globule) = 0. Input values and associated errors are listed in Table 1 together with average, minimum, and max-imum proportions of each sulfur budget component.
[14] On average, 16% of the sulfur adheres to the tephra
glass, 26% are degassed as sulfur, 5% were lost to the lake, and 53% of the S is conserved as sulfide globules. The sulfide globules will form a sink at depth due to their elevated density as is observed in cumulate nodules from Piton de la Fournaise, Réunion Island [Collins et al., 2012]. These sul-fides may be subsequently remobilized by incoming fresh basaltic magma, undersaturated in sulfide, possibly via reactions such as ½ O2(gas)+ FeS(sulfide)= FeO(silicate melt)+ ½ S2(gas). Alternatively, a possible sulfur ore deposit will react with hy-drothermal solutions having variable f O2/f S2during the heat mining of basaltic intrusions beneath the geothermal system that maintains the subglacial lake at Grímsvötn.
5. Conclusion
[15] The sulfur budget for the 2011 Grímsvötn eruption
can-not be simply treated as initial S in MI minus residual S in groundmass equals sulfur released in a gas phase. We propose that 50% of the sulfur was retained in an immiscible sulfide phase (globules) at depth. In such cases, remotely measured sulfur emissions will only account for the minimum quantity of sulfur brought to the surface in an explosive eruption.
[16] Acknowledgments. We are grateful to Gudrun Larsen, Sigrun Hreinsdottir, Thora Arnadottir, Magnus T. Gudmundsson, Thorvaldur Thordarson, Armann Höskuldsson, and Freysteinn Sigmundsson for discussions on the 2011 eruption at Grímsvötn. Jean-Luc Devidal provided expert advices during the EMP work. Critical and constructive reviews from Marie Edmonds, Peter Kelly, and Roberto Moretti led to significant improvements. This study was partially supported by the Iceland Science Fund (Volcano Anatomy grant), the French ANR“DégazMag” project, French-Icelandic scientific collaboration project“Jules Verne,” and an EC Supersite Programme (FutureVolc), all of which is gratefully acknowledged. SC and KY acknowledge support from NASA through the Aura Science Team (grant NNX11AF42G). This is the Laboratory of Excellence“ClerVolc” contribution #81.
[17] The Editor thanks Robert Moretti and an anonymous reviewer for their assistance in evaluating this paper.
References
Ágústsdóttir, A. M., and S. L. Brantley (1994), Volatilefluxes integrated over four decades at Grímsvötn volcano, Iceland, J. Geophys. Res., 99(B5), 9505–9522, doi:10.1029/93JB03597.
a
m(S) and m(SO2): total masses of S and SO2, respectively, exsolved during the Grímsvötn 2011 eruption; α = MW(SO2)/MW(S); DRE: dense
rock equivalent.
Albino, F., V. Pinel, and F. Sigmundsson (2010), Influence of surface load variations on eruption likelihood: Application to two Icelandic subglacial volcanoes, Grímsvötn and Katla, Geophys. J. Int., 181, 1510–1524, doi:10.1111/j.1365-246X.2010.04603.x.
Carn, S.A., N.A. Krotkov, K. Yang, and A.J. Krueger (2013), Measuring global volcanic degassing with the Ozone Monitoring Instrument (OMI), in Remote Sensing of Volcanoes and Volcanic Processes: Integrating Observation and Modeling, Geol. Soc. Lon, Special Publications, edited by D. M. Pyle, T. A. Mather, and J. Biggs, 380 p., The Geological Society of London, Bath, U.K., doi:10.1144/SP380.12. Clarisse, L., P.-F. Coheur, S. Chefdeville, J.-L. Lacour, D. Hurtmans, and
C. Clerbaux (2011), Infrared satellite observations of hydrogen sulfide in the volcanic plume of the August 2008 Kasatochi eruption, Geophys. Res. Lett., 38, L10804, doi:10.1029/2011GL047402.
Collins, S. J., J. Maclennan, D. M. Pyle, S. J. Barnes, and B. G. J. Upton (2012), Two phases of sulphide saturation in Réunion magmas: Evidence from cumulates, Earth Planet. Sci. Lett., 337–338, 104–113.
Devine, J. D., H. Sigurdsson, A. N. Davis, and S. Self (1984), Estimates of sulfur and chlorine yield to the atmosphere from volcanic eruptions and potential climatic effects, J. Geophys. Res., 89, 6309–6325, doi:10.1029/ JB089iB07p06309.
Gudmundsson, M. T., et al. (2012), The May 2011 eruption of Grímsvötn, Geophys. Res. Abstr., 14, EGU2012–12,119.
Jude-Eton, T. C., T. Thordarson, M. T. Gudmundsson, and B. Oddsson (2012), Dynamics, stratigraphy and proximal dispersal of supraglacial tephra during the ice-confined 2004 eruption at Grímsvötn volcano, Iceland, Bull. Volcanol., 74, 1057–1082, doi:10.1007/s00445-012-0583-3.
Jugo, P. J. (2012), Sulfur content at sulphide saturation in oxidized magma, Geology, 37, 415–418, doi:10.1130/G25527A.1.
McBirney, A. R. (2006), Igneous Petrology, 3rd ed., pp. 550, Jones and Bartlett, Sudbury, MA.
Moune, S., O. Sigmarsson, T. Thordarson, and P.-J. Gauthier (2007), Recent vol-atile evolution in the magmatic system of Hekla volcano, Iceland, Earth Planet. Sci. Lett., 255, 373–389, doi:10.1016/j.epsl.2006.12.024.
Moune, S., O. Sigmarsson, T. Thordarson, P. Schiano, and J. K. Keiding (2012), Melt inclusion constraints on the magma source of Eyjafjallajökull 2010flank eruption, J. Geophys. Res., 117, B00C07, doi:10.1029/ 2011JB008718.
Óladóttir, B., G. Larsen, and O. Sigmarsson (2011a), Holocene volcanic activ-ity at Grímsvötn, Bárdarbunga and Kverkfjöll subglacial centres beneath Vatnajökull, Iceland, Bull. Volcanol., 73, 1187–1208, doi:10.1007/s00445-011-0461-4.
Óladóttir, B., O. Sigmarsson, G. Larsen, and J.-L. Devidal (2011b), Provenance of basaltic tephra from Vatnajökull subglacial volcanoes, Iceland, as determined by major- and trace-element analyses, Holocene, 21, 1037–1048, doi:10.1177/0959683611400456.
Olsson, J., S. L. S. Stipp, K. N. Dalby, and S. R. Gislason (2013), Rapid release of metal salts and nutrients from the 2011 Grímsvötn, Iceland volcanic ash, Geochim. Cosmochim. Acta, 123, 134–149, doi:10.1016/j. gca.2013.09.009.
Petersen, G. N., H. Bjornsson, P. Arason, and S. von Löwis (2012), Two weather radar time series of the altitude of the volcanic plume during the May 2011 eruption of Grímsvötn, Iceland, Earth Syst. Sci. Data, 4, 121–127, doi:10.5194/essd-4-121-2012.
Roeder, P. L., and R. F. Emslie (1970), Olivine-liquid equilibrium, Contrib. Mineral. Petrol., 29, 275–289, doi:10.1007/BF00371276.
Sharma, K., S. Blake, S. Self, and A. J. Krueger (2004), SO2emissions from
basaltic eruptions, and the excess sulfur issue, Geophys. Res. Lett., 31, L13612, doi:10.1029/2004GL019688.
Symonds, R. B., W. I. Rose, G. J. S. Bluth, and T. M. Gerlach (1994), Volcanic-gas studies: Methods, results and applications, in Volatiles in Magmas, Rev. Mineral., 30, edited by M. R. Carroll and J. R. Holloway, pp. 1–66, Mineralogical Society of America, Washington, D.C. Textor, C., H.-F. Graf, M. Herzog, and J. M. Oberhuber (2003), Injection of
gases into the stratosphere by explosive volcanic eruptions, J. Geophys. Res., 108(D19, 4606), doi:10.1029/2002JD002987.
Thorarinsson, S. (1974), Vötnin stríð. Saga Skeiðarárhlaupa og Grímsvatnagosa (The swift flowing rivers. Annals of jökulhlaups in the river Skeidará and eruptions of Grímsvötn), Bókútá́fa Menningarsjóðs, 254 pp., Reykjavik, Iceland.
Wallace, P. (2001), Volcanic SO2emissions and the abundance and
distribu-tion of exsolved gas in magma bodies, J. Volcanol. Geotherm. Res., 108, 85–106.
Wallace, P. J., and M. Edmonds (2011), The sulfur budget in magmas: Evidence from melt inclusions, submarine glasses, and volcanic gas emis-sions, Rev. Min. Geochem., 73, 215–246, doi:10.2138/rmg.2011.73.8. Yang, K., N. A. Krotkov, A. J. Krueger, S. A. Carn, P. K. Bhartia, and
P. F. Levelt (2007), Retrieval of large volcanic SO2columns from the
Aura Ozone Monitoring Instrument (OMI): Comparison and limitations, J. Geophys. Res., 112, D24S43, doi:10.1029/2007JD008825.
Yang, K., X. Liu, P. K. Bhartia, N. A. Krotkov, S. A. Carn, E. Hughes, A. J. Krueger, R. Spurr, and S. Trahan (2010), Direct retrieval of sulfur dioxide amount and altitude from spaceborne hyper-spectral UV measurements: Theory and application, J. Geophys. Res., 115, D00L09, doi:10.1029/ 2010JD013982.