1
Supporting Information
PROBING OLIGOMERIZATION OF AMYLOID BETA IN SILICO
Lyudmyla Dorosh
1,2, Maria Stepanova
1,2,3*
1
Department of Electrical and Computer Engineering, University of Alberta; Edmonton, Alberta, Canada; 2
National Research Council of Canada; Edmonton, Alberta, Canada; 3
Department of Physics, Astronomy, and Materials Science, Missouri State University; Springfield, MO, USA * Email: ms1@ualberta.ca; mariastepanova@missouristate.edu
A B C
Figure S1: Averaged side-chain (above the diagonal) and main-chain (below the diagonal) mean distance maps of
Aβ17-42 decamer system A2 in the course of 200 ns MD trajectory: A - at the beginning of the simulation after equilibrations (time step 0 ns; B - at 60 ns time step; C - at 200 ns. In the distance maps, shorter distances are shown with red, orange, and yellow colors, and longer distances are shown in blue.
Electronic Supplementary Material (ESI) for Molecular BioSystems.
This journal is © The Royal Society of Chemistry 2016
2
A B
C D
E F
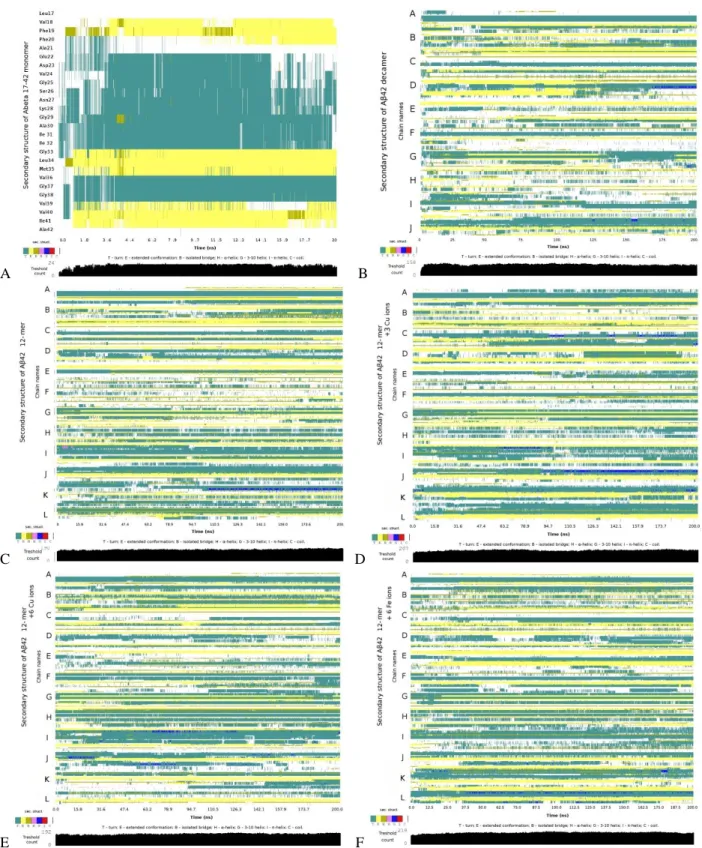
Figure S2: Secondary structure evolution vs simulation time for Aβ systems A1 (A), A2 (B), A3 (C), A4a (D), A5a
(E) and A6a (F). Extended β-sheets are indicated with yellow color, isolated β bridges –green yellow, turns – cyan, 3-π helices - blue, random coils - white.
3
A B
C D
Figure S3: Radius of gyration for Aβ dodecamer systems A5 (A) and A6 (C), and detected number of hydrogen
bond pairs in the systems A5 (B) and A6 (D) as functions of the simulation time. Zero time corresponds to the beginning of production simulations immediately after equilibrations.
4
A B
C D
E F
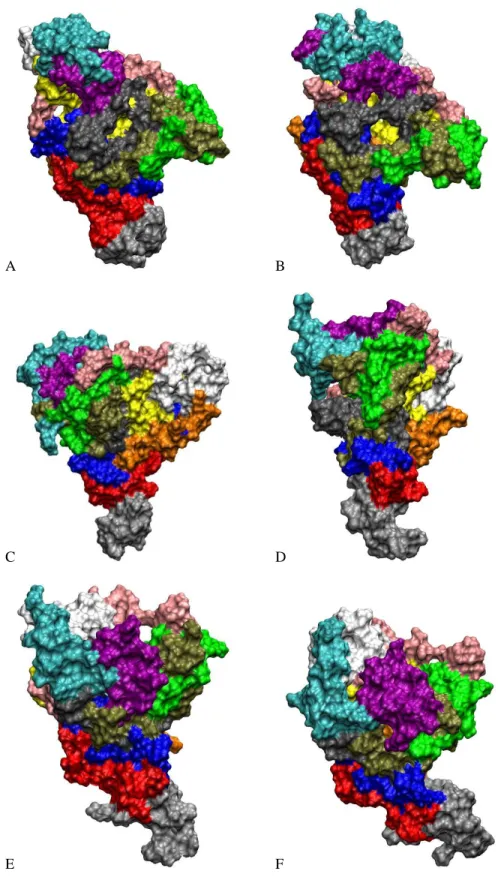
Figure S4: Conformations of systems A3a (A,B), A5a (C,D), and A6a (E,F) after 70 ns (A, C, E) and 200 ns (B, D,
5
A B
C D
Figure S5: Close-up images of metal ions positioned in negatively charged cavities in systems A5a (A,B) and A6a
6
A B
C D
Figure S6: Close-up images of two Cu2+ ions positioned in negatively charged cavities in system A4a after equilibration (A,C) and after 200 ns (B,D).
7
Figure S7: Percentage of total displacement sampled as a function of the number of principal eigenvectors of the
covariance matrix, in average over 100 segments of MD trajectories after 50 ns for decamer A2 (green line), dodecamer A3 (red line), dodecamer with three Cu2+ ions A4 (light blue line), dodecamer with six Cu2+ ions A5 (blue line) and dodecamer with six Fe2+ ions A6 (yellow line).
8
A B
Figure S8: Side chain (above the diagonal) and backbone (below the diagonal) ECD correlation map (A) and mean
smallest distance map calculated with the GROMACS software (B) for dodecamer A3. The color scheme is as in Figure 6.
9
A B
C D
Figure S9: Time evolution of normalized solvent accessible surface area (SASA) of large side-chain hydrophobic
residues: A – SASA of valines; B – SASA of isoleucines; C - SASA of phenylalanines; and D – SASA of leucines. Red curves represent system A2, green – A3, and blue – A4. The sequence of the constructs is 17LVFFAEDVGSNKGAIIGLMVGGVVIA42.
10
Figure S10: Doughnut-like conformation of Aβ17-42 dodecamer A4 with three copper ions. ECD correlation maps calculated at last 20 ns of 200 ns trajectory, showing side chain (above the diagonal) and backbone (below the diagonal) correlations maps. The color scheme is as in Figure 6.
11
A B
Figure S11: Conformations of A4c (A) and A4d (B) oligomers at approximately 60-70 ns of simulations in solvent
accessible surface representation with twelve units shown with different colors. In panel B the oligomer surface is translucent and copper ions are shown with dark-red spheres.
12 Table S1: Outline of all systems simulated
Name System MD
time Observed changes in the system
A1a monomer 20 ns
A1b monomer 20 ns
A2 decamer 200 ns All 10 units aggregated into a compact non-fibrillar oligomer A3 dodecamer 200 ns All 12 units formed non-fibrillar oligomer.
A4a dodecamer + 3 𝐶𝑢2+ 200 ns in a center from the beginning of the simulations, and adopted a All 12 units aggregated into a compact oligomer with a channel
doughnut shaped conformation by the end of 200 ns. A4b dodecamer + 3 𝐶𝑢2+ 200 ns All 12 units formed non-fibrillar oligomer with deep cavity,
in proximity of E22-bound copper ions.
A4c dodecamer + 3 𝐶𝑢2+ 200 ns
All 12 units formed non-fibrillar oligomer with a channel in a center surrounded by the same chains as in system A4a. The
channel was formed after 40 ns and its size varied subsequently. Non-bonded copper detached from oligomer in
the first 4-7 ns and then remained unbound for 193 ns. A4d dodecamer + 3 𝐶𝑢2+ 200 ns All 12 units formed non-fibrillar oligomer with a channel in a center that formed around 30 ns. Size of the channel varied
subsequently. A4e dodecamer + 3 𝐶𝑢2+ 200 ns
One chain (K) detached from oligomer in the first 5 ns and remained detached for the subsequent 195 ns. Copper ions
remained bound to oligomer. A5a dodecamer + 6 𝐶𝑢2+ 200 ns All 12 units formed non-fibrillar oligomer.
A5b dodecamer + 6 𝐶𝑢2+ 200 ns All 12 units formed non-fibrillar oligomer. A channel was formed by two connecting chains at 60-70 ns. A5c dodecamer + 6 𝐶𝑢2+ 200 ns All 12 units formed non-fibrillar oligomer.
A5d dodecamer + 6 𝐶𝑢2+ 200 ns All 12 units formed non-fibrillar oligomer. A5e dodecamer + 6 𝐶𝑢2+ 200 ns All 12 units formed non-fibrillar oligomer.
A6a dodecamer + 6 𝐹𝑒2+ 200 ns All 12 units formed non-fibrillar oligomer. A6b dodecamer + 6 𝐹𝑒2+ 200 ns All 12 units formed non-fibrillar oligomer.
A6c dodecamer + 6 𝐹𝑒2+ 200 ns All 12 units formed non-fibrillar oligomer. A6d dodecamer + 6 𝐹𝑒2+ 200 ns All 12 units formed non-fibrillar oligomer.