Change Mitigation the Ultimate Arbitrage Opportunity?
The MIT Faculty has made this article openly available. Please share
how this access benefits you. Your story matters.
Citation Deshpande, Manasi, and Michael Greenstone. “Comment on ‘On
the Economics of Climate Policy’: Is Climate Change Mitigation the Ultimate Arbitrage Opportunity?” The B.E. Journal of Economic Analysis & Policy 10.2 (2011). Copyright © 2011 by De Gruyter
As Published http://dx.doi.org/10.2202/1935-1682.3082
Publisher Berkeley Electronic Press
Version Final published version
Citable link http://hdl.handle.net/1721.1/71249
Terms of Use Article is made available in accordance with the publisher's
policy and may be subject to US copyright law. Please refer to the publisher's site for terms of use.
Analysis & Policy
Symposium
Volume10, Issue 2 2010 Article20
D
ISTRIBUTIONALA
SPECTS OFE
NERGYANDC
LIMATEP
OLICYCommenton “Onthe Economics of Climate
Policy”:
Is Climate ChangeMitigation
the
Ultimate
Arbitrage Opportunity?
Manasi Deshpande
∗Michael Greenstone
†∗MIT, Department of Economics, manasi@mit.edu
†MIT, Department of Economics, andNBER, mgreenst@mit.edu
RecommendedCitation
Manasi DeshpandeandMichael Greenstone (2010) ”Commenton “Onthe Economics of Climate Policy”: Is Climate ChangeMitigation the Ultimate Arbitrage Opportunity?,”The B.E. Journal of Economic Analysis & Policy: Vol. 10: Iss. 2 (Symposium), Article 20.
Gary Becker, Kevin Murphy, and Robert Topel’s (BMT), “On the Economics of Climate Policy,” is an important paper that deepens our understanding of what some have referred to as the challenge of our generation. It is an excellent example of how basic price theory can be used to gain a better understanding of the world. The paper is filled with insights, including how to determine the appropriate discount rate to value investments in climate mitigation, the importance of the distribution of damages across the population, the smaller than expected costs of delay in undertaking research and development programs for clean energy sources, and a cogent defense of analyzing investments in carbon mitigation with standard cost-benefit tools.
One of BMT’s observations is that heterogeneity across countries in the marginal rate of substitution between current and future consumption poses a major, indeed possibly insurmountable, challenge to a solution to the problem of climate change. In this brief note, we draw a different conclusion. Our argument is that this heterogeneity in the marginal rate of substitution provides the basis for a Pareto-improving trade that could in principle facilitate an international agreement to mitigate climate change.
As BMT observe, in developed economies it is likely that the value of marginal changes in consumption today is not dramatically different from the value of marginal changes in the future. Thus, the great risk from climate change for developed countries is the possibility that it will cause a dramatic decline in their consumption; they want to mitigate climate change for its insurance properties to protect their existing high standards of living.
In contrast, marginal consumption today has a very high value in China, India, and other developing countries, relative to marginal consumption in the future. This reflects the relatively low levels of consumption in these countries today and their high expected growth rates, both of which make them reluctant to reduce consumption today in order to protect future consumption. As just one measure of the urgency of greater consumption today, Burgess et al. (2011) find that the mortality impact of a day with the temperature exceeding 90 degrees F is 20 times greater in India than in the United States. To put it plainly, India and other developing countries are literally dying to increase consumption today. By comparison, reducing the risk of future consumption losses is not as pressing of an issue in these countries.
The result is that, at least for the foreseeable future, developing countries’ primary focus is likely to be economic growth, a strategy that is at odds with emissions reductions. BMT present the case for why developing countries are unlikely to agree to meaningful emissions reductions. With economic growth in the developing world as the primary driver of greenhouse gas emissions, the state of the world in which global emissions are high and the earth is warming is the state of the world in which developing countries become wealthy. The state of
the world in which global emissions are stabilized and climate change is curbed is one in which these countries remain below their growth potential.
This drive for economic growth is troubling for climate change mitigation strategies because reducing the degree of climate change to levels recommended by scientists and economists will require significant abatement from the developing world. The United States’ commitment at Copenhagen—to reduce its emissions by 17 percent below 2005 levels by 2020—would account for around 20 percent of the global reduction in emissions needed to stabilize the atmospheric greenhouse gas concentration at 550 ppm, a recommended and possibly feasible target. Together, the combined Copenhagen commitments of the United States and the European Union would account for less than 40 percent of necessary reductions, based on current emissions modeling projections.1
One potential solution is compensation from the developed world to the developing world. This could happen directly through a lump-sum transfer. Or it could happen indirectly, through investments by the developed world in the research and development of technologies—for example, carbon capture and storage—that would allow the developing world to grow more cleanly. Though the latter approach may be more politically palatable, both involve substantial risk: the former in verifying reductions and the latter in managing the uncertainties of technological innovation.
How much would the developed world need to pay to compensate developing countries for their foregone consumption? In this note, we develop calculations of the lower and upper bounds of a Pareto-improving transfer from the developed world to the developing world, using China as an example and using a series of assumptions about growth rates and the impact of carbon reductions on Chinese growth.
The heterogeneity in the intertemporal elasticity of the marginal utility of consumption features prominently in these calculations. In particular, this heterogeneity leads to different social discount rates in the developed and developing worlds, with two important implications for a Pareto-improving transfer. First, the value of foregone Chinese consumption using Chinese discount rates is far less than one would expect using conventional developed world discount rates.2 Depending on the assumptions, the present value of
1 Authors’ calculations based on estimates and projections in Clarke et al. (2007) and U.S. EPA
(2011).
2 Another useful, though distinct, exercise would be to compare the cost of emissions reductions in
China (using Chinese discount rates) to the cost of emissions reductions in the United States (using U.S. discount rates). The cost of emissions reductions in the United States is likely to be much larger than the cost of emissions reductions in China, and therefore the United States would be willing to pay—and China would be willing to accept—some amount between these two costs for China to reduce emissions. The wedge between different countries’ marginal abatement costs forms the basis of international offset agreements.
Chinese consumption loss using the U.S. discount rate generally exceeds the present value using the Chinese discount rate by an order of magnitude or more. For example, if China were to participate in the type of global agreement outlined by the Energy Modeling Forum (Clarke et al. 2009) to stabilize atmospheric concentrations of CO2 at 550 ppm, the value of Chinese consumption loss through
the end of the century would be $1.6 trillion, or $1.60 per ton of CO2 abated over
the course of the 21st century, using China’s discount rate. This compares to $50.1 trillion using a U.S. discount rate. The Chinese valuation of Chinese consumption loss is the lower bound of a Pareto-improving transfer from the U.S. to China.
Second, the social cost of carbon, which is the monetized damages associated with an incremental increase in carbon emissions, takes on different values depending on whether U.S. or Chinese discount rates are used. Using a Chinese discount rate would lead to a social cost of carbon of effectively zero. In contrast, the U.S. government has determined the global social cost of carbon using U.S. discount rates to be $21 per ton of CO2.3 The social cost of carbon
determines the upper bound of the Pareto-improving transfer—in other words, the maximum amount the U.S. would be willing to pay China to reduce emissions.
The large disparity between the U.S. and Chinese marginal rates of substitution appears to provide an opportunity for developed and developing countries to make a mutually beneficial deal that provides both sides with substantial surplus. Hence, in contrast to BMT, we conclude that the heterogeneity in the marginal rate of substitution may provide a way forward for a mutually beneficial climate agreement, rather than being the death of one.
I. Lower Bound: Estimating the Value of China’s Loss in Consumption Due to CO2 Abatement
This section outlines a method for determining the value of the loss in China’s consumption associated with adopting a system of emissions cuts. This value is the minimum amount the U.S. would have to pay for China to reduce emissions—
3 Two issues with the number $21 per ton are relevant for this exercise. First, it is an estimate of
the global damages of climate change, yet Americans' utility functions may not include losses outside of the United States. In this case, it would be useful to have a separate estimate of the domestic damages. Later, we show that the paper's qualitative conclusions generally remain when U.S. domestic damages are used, rather than global damages. Second, $21 per ton is the value of the averted damages associated with a marginal reduction in carbon emissions, but this paper's exercise is about non-marginal reductions. Damages are likely increasing in the atmospheric concentration of greenhouse gases, so the $21 figure is likely an overestimate of the averted damages associated with the substantial reductions in Chinese emissions contemplated here.
in other words, the lower bound of a Pareto-improving transfer. The exercise is conducted from the present through 2100, which is approximately when the Chinese economy is expected to equal the size of the U.S. economy in a baseline scenario (Goldman Sachs 2007). We assume that China begins reducing emissions immediately, in 2012, so the relevant equation is:
NPV of China's Consumption Loss from CO2 Abatement
1 ,
(1)
where is China’s baseline consumption in year t and is China’s consumption in year t under the mitigation scenario. The parameter is the social discount rate in year t.
The first step is to estimate the percentage reduction in emissions that China would have to make under a global climate agreement. Figure 1 presents China’s baseline emissions trajectory and its hypothetical emissions trajectory under a standard 550 ppm stabilization path without overshooting from 2012 through 2100, based on emissions models from the Energy Modeling Forum (Clarke et al. 2009). Under the mitigation target, China’s emissions are more than 70 percent below baseline levels in 2050 and more than 90 percent below baseline in 2100. Of course, the amount of abatement needed from China depends on the amount of abatement undertaken by the rest of the world. As the world’s largest emitter, however, China will have to reduce emissions substantially under any cost-effective scenario.
The next step is to translate the reduction in China’s emissions to a reduction in GDP, which allows for estimates of and in equation (1). Estimates of the effect of emissions reductions on China’s growth vary considerably, reflecting different assumptions about the technological evolution of the Chinese economy and its emissions intensity. We consider three scenarios for a reduction in Chinese economic activity relative to baseline, modeled by the Energy Modeling Forum (Clarke et al. 2009). In the first scenario, CO2
reductions in China have a small impact on Chinese GDP; GDP losses are 0.7 percent below baseline in 2020 and peak at 1.9 percent below baseline in 2050. In the second scenario, CO2 reductions in China have a moderate impact on GDP;
GDP losses are 1 percent below baseline in 2020 and peak at 7 percent below baseline in 2080. In the third scenario, CO2 reductions have a large impact on
GDP; GDP losses are 2 percent below baseline in 2020 and peak at 18 percent below baseline in 2100. The “low impact” scenario corresponds to a world in which technological breakthroughs allow China to reduce the carbon intensity of its economy significantly. The “high impact” scenario corresponds to a world in
which China experiences a gradual decrease in carbon intensity that lags behind its baseline growth.4
The final step in estimating the value of China’s foregone consumption is to discount the difference in expected consumption under the two scenarios by the social discount rate. Figure 2 shows the annual value of foregone Chinese consumption using a U.S. discount rate; this value increases over time because abatement costs rise faster than the discount rate. Assuming a “moderate” impact of carbon reduction on Chinese GDP, the U.S. would have to pay a minimum total amount of $50.1 trillion to compensate China for its consumption loss between 2012 and 2100. Even if this amount were less than the social cost of carbon, such an enormous transfer would almost undoubtedly be a political non-starter in the U.S.
4 The 550 ppm target considered here is one in which atmospheric concentrations never exceed
550 ppm (i.e., stabilization). For "low impact," we use the Energy Modeling Forum (EMF) model from Clarke et al. (2009) predicting the smallest nonzero impact on GDP (the MESSAGE model). For "high impact," we use the EMF model predicting the largest impact on GDP (the SGM model). For "moderate impact," we use the median over all nonzero-impact EMF models in each year.
However, the U.S. discount rate is not the appropriate one for valuing Chinese consumption loss. Instead, we calculate the Chinese discount rate using the Ramsey formula for the social discount rate:
(2) where is the pure rate of time preference, is the intertemporal elasticity of the marginal utility of consumption, and is the economy’s growth rate (Ramsey 1928).
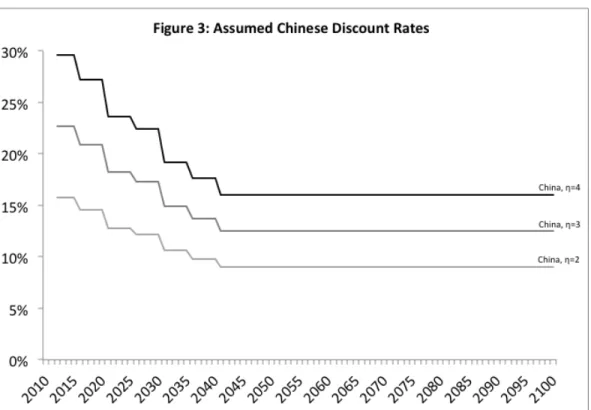
Of particular importance in this context is the parameter , since economic theory suggests that the marginal utility of consumption is higher when consumption is lower—as is the case under the 550 ppm target. Given that the developing world is clamoring for consumption now, we assume relatively large intertemporal substitution elasticities—between 2 and 4—meaning that China would be willing to give up substantial future consumption to consume more today. We assume a pure rate of time preference of 2 percent.
These large values of , as well as the high growth rate of the Chinese economy, lead to social discount rates for China that are well above conventional
ߩ ߟ
݃
ߟ
U.S. discount rates. Figure 3 shows Chinese discount rates under three values of (2, 3, and 4). The Chinese discount rates decrease over time because of declines in the projected Chinese economic growth rate. In all cases, the Chinese discount rate is significantly higher than conventional U.S. discount rates, which generally range from 2.5 to 7 percent.
As shown in Figure 2, the annual value of foregone Chinese consumption using Chinese discount rates declines over time and approaches zero by the end of the century. This valuation contrasts sharply with the valuation obtained using conventional U.S. discount rates (the figure uses a discount rate of 3 percent for the U.S.). Note that the large gap between Chinese and U.S. valuations does not mean that China would not consider its consumption loss economically meaningful. Instead, it simply means that the value of foregone consumption to the Chinese is far less than what one would expect using conventional U.S. discount rates.
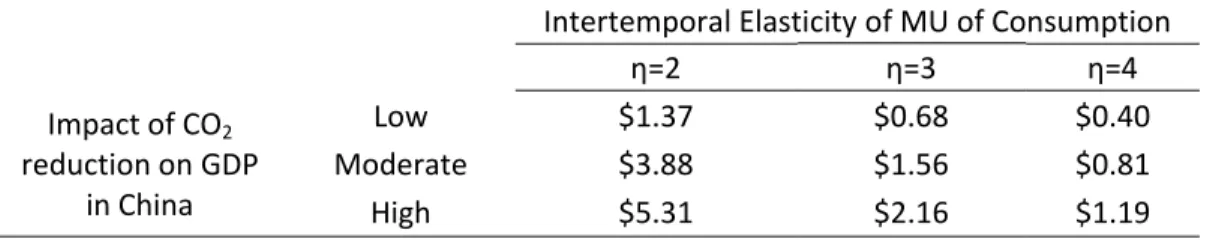
Table 1 provides estimates of the net present value of foregone Chinese consumption between 2012 and 2100 under the 550 ppm target, given different assumptions about the impact of CO2 reductions on Chinese GDP. Estimates of
the total value of foregone Chinese consumption over this period range from $400 ߟ
billion to $5.3 trillion using Chinese discount rates.5 These amounts are the minimum transfer that China would be willing to accept to reduce its CO2
emissions and undergo the resulting loss in consumption. The amount corresponding to “moderate impact” and =3 is the $1.6 trillion mentioned in the introduction as a reasonable estimate for the lower bound acceptable to China.
Table 1: Value of Chinese Consumption Loss, 2012‐2100 (trillions)
Intertemporal Elasticity of MU of Consumption
η=2 η=3 η=4 Impact of CO2 reduction on GDP in China Low $1.37 $0.68 $0.40 Moderate $3.88 $1.56 $0.81 High $5.31 $2.16 $1.19
Source: Authors' calculations based on estimates from the Energy Modeling Forum and Goldman Sachs.
Notes: "Low" uses the EMF model predicting the smallest nonzero impact on GDP; "high" uses the EMF model predicting the largest impact on GDP; "moderate" uses the median over all nonzero impact models in each year. η is the intertemporal elasticity of the marginal utility of consumption for China; it is used to calculate a social discount rate for China assuming a 2% rate of time preference.
II. Upper Bound: Estimating the U.S. Willingness to Pay for Chinese Carbon Reductions with the Social Cost of Carbon
What is the maximum amount that the U.S. would be willing to pay China for emissions reductions? In this section, we calculate the upper bound on a Pareto-improving transfer from the U.S. to China. This upper bound is determined by the social cost of carbon, since the U.S. would be willing to pay only up to the present value of expected future climate damages.
Here too, the disparity in U.S. and Chinese discount rates plays a key role. Using Chinese discount rates, the social cost of carbon is effectively zero. The Chinese place little value on climate damages that are expected to occur far in the future; they are instead focused on increasing today’s consumption. In determining how much the U.S. would be willing to pay, however, it is the U.S. discount rate, rather than the Chinese discount rate, that matters. Using a U.S. discount rate, the U.S. government values the global social cost of carbon at $21 per ton of CO2 (Greenstone et al. 2011).
How does this amount compare to the Chinese value of Chinese consumption loss? Under the 550 ppm stabilization target and division of emissions reductions laid out by the Energy Modeling Forum, China would
reduce emissions by nearly 1000 Gt CO2 between 2012 and 2100. Table 2
presents the results from dividing the present value of China’s foregone consumption in Table 1 by the 1000 Gt CO2 avoided, which is the cost in lost
Chinese consumption per ton of abatement. For example, the $1.6 trillion corresponding to the “moderate” impact and =3 translates to $1.60 per ton CO2.
The maximum cost per ton of CO2 abated is $5.33, which comes from the "high"
impact and =2 combination of assumptions.
In all cases, the Chinese valuation of its consumption loss is far less than $21 per ton of CO2. This huge difference suggests an opportunity for a
Pareto-improving transfer from the developed world to the developing world for emissions reductions. By paying China some amount between the Chinese valuation of its consumption loss and the U.S. value of the social cost of carbon, the U.S. would get the emissions reductions necessary to insure their current standard of living against climate damage—at less than its willingness to pay for such reductions. And by fulfilling China’s strong desire for more consumption today, this transfer would fully compensate China for the consumption it must forgo tomorrow in reducing emissions.
Table 2: Cost per Ton of CO2 Abated Intertemporal Elasticity of MU of Consumption η=2 η=3 η=4 Impact of CO2 reduction on GDP in China Low $1.38 $0.68 $0.40 Moderate $3.89 $1.57 $0.81 High $5.33 $2.17 $1.19 Source: Authors' calculations based on estimates from the Energy Modeling Forum and Goldman Sachs.
Notes: "Low" uses the EMF model predicting the smallest nonzero impact on GDP; "high" uses the EMF model predicting the largest impact on GDP; "moderate" uses the median over all nonzero impact models in each year. η is the intertemporal elasticity of the marginal utility of consumption for China; it is used to calculate a social discount rate for China assuming a 2% rate of time preference. Cost per ton calculated using 1000 Gt CO2 avoided.
It is important to emphasize that while the $21 per ton figure is an estimate of the global damages, the U.S. is likely more interested in paying to avoid the U.S. domestic damages associated with Chinese emissions. Although the research on regional impacts is not as advanced as on global damages, the available research suggests that U.S. domestic damages are about 10 percent of the global benefit with a 3 percent discount rate (Greenstone et al. 2011). Alternatively, if the fraction of GDP lost due to climate change is assumed to be similar across countries, the domestic benefit would be proportional to the U.S.
share of global GDP, which is currently about 23 percent.6 In many, although not all, of the scenarios, there are still opportunities for a Pareto-improving transfer because the U.S. valuation of the reductions in emissions exceeds the Chinese valuation of the lost consumption.
Of course, the U.S. is just one of many developed countries. The resources available to compensate China would be greater if all developed countries banded together with the U.S. in an international agreement with China. Each of them could contribute an amount less than the avoided damages in their country per ton of CO2 abated. The sum of these payments is likely to easily
exceed the present value of China's lost consumption, even with the assumptions that yield high estimated costs for China. In principle, similar deals could be struck with other developing countries.
III. Conclusions
The analysis presented here has numerous limitations and is intended to provide only a back-of-the-envelope method for estimating the value of foregone Chinese consumption. In particular, these calculations reflect a highly simplified view of the nature of climate damages and national interests.
Perhaps the most important limitation of this calculation is the failure to account for China’s avoided climate damages. The available research suggests that the benefits of climate change mitigation are heavily concentrated in the developing world. For example, hundreds of millions of people living near the coastline are threatened by rising sea levels. Although the biggest beneficiaries of mitigation will be small island nations, China may also experience significant benefits, depending on the severity of climate change in the baseline scenario and the effectiveness of emissions reductions in mitigating climate change. As we highlighted, however, a high social discount rate for China reduces the value of the benefits that emerge further in the future. Regardless, a full accounting of these benefits would change the calculations presented here.
These numbers come with at least three additional caveats. The first is the time period of compensation. We calculate the value of foregone consumption until 2100, when China’s GDP is expected to catch up with U.S. GDP under baseline assumptions. In reality, China’s GDP would continue to be lower than
6 Although the mortality impacts of climate change are likely to be unequally distributed across
the globe, the associated welfare loss may be more equally distributed because the available evidence suggests that the value of a statistical life increases faster than income. Further, there may be greater scope and devotion of resources to defensive expenditures in high income countries. For these reasons, the assumption that climate change induced losses will be proportional to GDP may not be unreasonable.
baseline into the 22nd century—though as demonstrated above, the value of those losses approach zero using Chinese discount rates. Second, we have not considered trades with other rapidly developing countries, including India and Indonesia. The amounts would be smaller than compensation to China but likely substantial. Third, the world currently lacks the technological capability to verify a country’s emissions, which would be an essential ingredient in a credible trade of resources for emissions reductions. Fourth, even with a credible and internationally recognized method to measure country-level emissions, the immediate transfer of resources to China in exchange for emissions reductions over the next 90 years would need to be accompanied by a credible enforcement mechanism (e.g., large and enforceable penalties for failing to meet the agreed upon emissions targets).
We recognize the possibility of technological innovation that would allow developing countries to develop at much lower carbon intensity than is possible today, although such innovation usually requires a certain and substantial stream of resources for basic research and development that likely exceeds the amounts being invested today. Perhaps the most likely scenario, however, is that developing countries will face a tradeoff between their own economic development and emissions reductions for the global good. The differences in the developed and developing countries' marginal rates of substitution between present and future consumption outline the contours of a trade that would reduce the degree of climate change and benefit both sets of countries.
REFERENCES
Becker, G., K. Murphy, and R. Topel, 2010. “On the Economics of Climate Policy.” The B.E. Journal of Economic Analysis and Policy, Volume 10, Issue 2.
Burgess, R., O. Deschenes, D. Donaldson, M. Greenstone, 2011. “Weather and Death in India: Mechanisms and Implications for Climate Change.” Mimeograph, Cambridge, MA: MIT.
Clarke, L., J. Edmonds, H. Jacoby, H. Pitcher, J. Reilly, R. Richels, 2007. “Scenarios of Greenhouse Gas Emissions and Atmospheric Concentrations.” Sub-report 2.1A of Synthesis and Assessment Product 2.1 by the U.S. Climate Change Science Program and the Subcommittee on Global Change Research. Department of Energy, Office of Biological & Environmental Research, Washington, DC., USA, p. 154.
Clarke, L., C. Bohringer, and T. Rutherford, 2009. “International, U.S., and E.U. Climate Change Control Scenarios: Results from EMF 22.” Energy
Economics, Volume 31, Supplement 2, pp. S63-S306.
Goldman Sachs, 2007. “BRICs and Beyond.”
http://www2.goldmansachs.com/ideas/brics/book/BRIC-Full.pdf.
Greenstone, M., E. Kopits, A. Wolverton, 2011. “Estimating the Social Cost of Carbon for Use in U.S. Federal Rulemakings: A Summary and Interpretation.” NBER Working Paper No. 16913.
Ramsey, F., 1928. “A Mathematical Theory of Saving.” Economic Journal, Volume 38, No. 152, pp. 543-559.
U.S. EPA, 2011. Global Greenhouse Gas Data.