HAL Id: hal-02438887
https://hal-univ-lyon1.archives-ouvertes.fr/hal-02438887
Submitted on 31 May 2021
HAL is a multi-disciplinary open access
archive for the deposit and dissemination of
sci-entific research documents, whether they are
pub-lished or not. The documents may come from
teaching and research institutions in France or
abroad, or from public or private research centers.
L’archive ouverte pluridisciplinaire HAL, est
destinée au dépôt et à la diffusion de documents
scientifiques de niveau recherche, publiés ou non,
émanant des établissements d’enseignement et de
recherche français ou étrangers, des laboratoires
publics ou privés.
Distributed under a Creative Commons Attribution| 4.0 International License
integrating species, traits, environment and space
Alienor Jeliazkov, Darko Mijatovic, Stéphane Chantepie, Nigel Andrew,
Raphaël Arlettaz, Luc Barbaro, Nadia Barsoum, Alena Bartonova, Elena
Belskaya, Nuria Bonada, et al.
To cite this version:
Alienor Jeliazkov, Darko Mijatovic, Stéphane Chantepie, Nigel Andrew, Raphaël Arlettaz, et al..
A global database for metacommunity ecology, integrating species, traits, environment and space.
Scientific Data , Nature Publishing Group, 2020, 7 (1), pp.6. �10.1038/s41597-019-0344-7�.
�hal-02438887�
a global database for
metacommunity ecology,
integrating species, traits,
environment and space
alienor Jeliazkov et al.
#the use of functional information in the form of species traits plays an important role
in explaining biodiversity patterns and responses to environmental changes. although
relationships between species composition, their traits, and the environment have been
extensively studied on a case-by-case basis, results are variable, and it remains unclear
how generalizable these relationships are across ecosystems, taxa and spatial scales. to
address this gap, we collated 80 datasets from trait-based studies into a global database for
metaCommunity Ecology: Species, Traits, Environment and Space; “CEStES”. Each dataset
includes four matrices: species community abundances or presences/absences across
multiple sites, species trait information, environmental variables and spatial coordinates
of the sampling sites. the CEStES database is a live database: it will be maintained and
expanded in the future as new datasets become available. By its harmonized structure, and
the diversity of ecosystem types, taxonomic groups, and spatial scales it covers, the CEStES
database provides an important opportunity for synthetic trait-based research in community
ecology.
Background & Summary
A major challenge in ecology is to understand the processes underlying community assembly and biodiversity patterns across space1,2. Over the three last decades, trait-based research, by taking up this challenge, has drawn
increasing interest3, in particular with the aim of predicting biodiversity response to environment. In community
ecology, it has been equated to the ‘Holy Grail’ that would allow ecologists to approach the potential processes underlying metacommunity patterns4–7. In macroecology, it is common to study biodiversity variation through
its taxonomic and functional facets along gradients of environmental drivers8–10. In biodiversity-ecosystem
func-tioning research, trait-based diversity measures complement taxonomic ones to predict ecosystem functions11
offering early-warning signs of ecosystem perturbation12.
The topic of Trait-Environment Relationships (TER) has been extensively studied across the globe and across the tree of life. However, each study deals with a specific system, taxonomic group, and geographic region and uses different methods to assess the relationship between species traits and the environment. As a consequence, we do not know how generalizable apparent relationships are, nor how they vary across ecosystems, realms, and taxonomic groups. In addition, while there is an emerging synthesis about the role of traits for terrestrial plant communities13,14, we know much less about other groups and ecosystem types.
To address these gaps, we introduce the CESTES database - a global database for metaCommunity Ecology:
Species, Traits, Environment and Space. This database assembles 80 datasets from studies that analysed empirical
multivariate trait-environment relationships between 1996 (the first multivariate study of TER15) and 2018. All
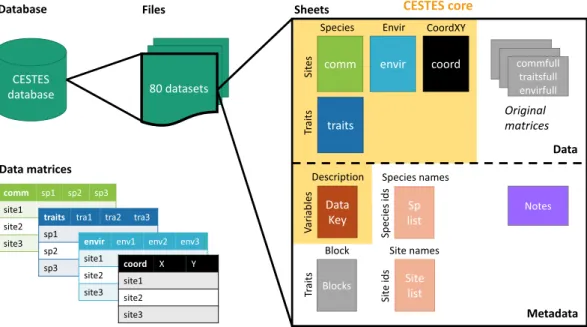
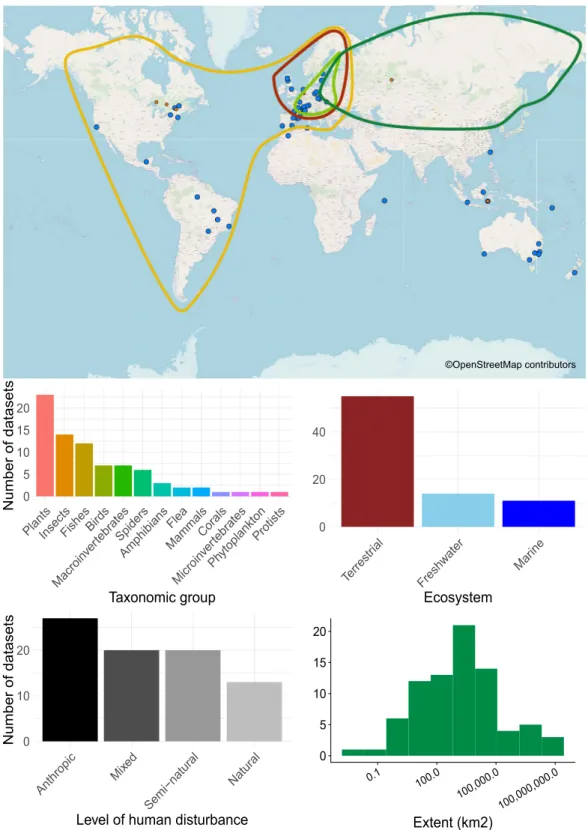
considered datasets include four data matrices (Fig. 1): (i) community data (species abundances or presences/ absences across multiple sites), (ii) species traits (sensu lato), (iii) environmental variables across sites, and (iv) spatial coordinates. The database is global in extent and covers different taxonomic groups, ecosystem types, lev-els of human disturbance, and spatial scales (Fig. 2).
#A full list of authors and their affiliations appears at the end of the paper.
Data DESCriptor
opEN
Several global trait databases already exist or are emerging, such as the Open Traits working group16, the
Freshwater Information Platform and its Taxa and Autecology Database for Freshwater Organisms17, the
PREDICTS database for Projecting Responses of Ecological Diversity In Changing Terrestrial Systems18,19, and
the TRY20 plant trait database for Quantifying and scaling global plant trait diversity. In comparison to these
initi-atives, the CESTES database has several unique features. Specifically, it maintains the original matching between the community, environmental, and spatial data that go along with the trait information. Keeping this original matching of the data ensures homogeneity in the data structure and allows for targeted analyses of TER. We include all taxonomic groups for which the appropriate matrices are available including groups poorly repre-sented in most trait compilations (e.g., invertebrates and bats). The trait information is particularly diverse, rang-ing from life-history and morphological to trophic traits, dispersal abilities and tolerances, and coverrang-ing various ecological mechanisms. CESTES only includes data where georeferenced coordinates, or relative coordinates of the sampling sites (hereafter: spatial coordinates) and environmental variables are available to enable spatial and scaling community analyses. We prioritized studies with abundance or biomass data (as opposed to presence/ absence) to facilitate the calculation of a broad range of biodiversity metrics and the study of different facets of biodiversity. The data available in CESTES are open access without restriction, except via citation of this paper (and any original paper that plays a particularly important role in the analyses). Importantly, the CESTES data-base is meant to be a live datadata-base21: it will be maintained in the future and new datasets will be added as they
become available.
The CESTES database aims to significantly contribute to research in biogeography, macroecology (including in complement with phylogenies), community and metacommunity ecology, and biodiversity-ecosystem func-tioning. On the one hand, the quality of its content and structure will allow meta-analyses and syntheses (e.g., the role of taxonomic and functional diversity in spatial patterns of communities). On the other hand, specific datasets will enable the exploration of new questions on a given group, realm, or type of ecosystem.
Methods
Data compilation.
Database scoping. The rationale for developing the CESTES database is generally forthe study of TER in relation to metacommunity ecology and/or macroecological questions. As such, we focussed on datasets that were appropriate within the metacommunity or macroecology context (i.e. species assemblages distributed across space) and that focussed on traits to understand biodiversity patterns and responses. This prerequisite led us to identify multivariate trait-based studies as the most relevant and rich source of datasets that could fulfil these two requirements.
Given the complexity that still pertains to trait typology13, we did not restrict ourselves to any specific
defini-tion of traits and integrated all possible species characteristics if they were used as “traits” in the original study. We thus included ecophysiological, functional, life-history and biological traits, as well as response and effects traits. CESTES users can select traits according to their study needs.
Fig. 1 Structure of the CESTES database. The database includes 80 Excel files for 80 datasets. Each dataset is composed of four matrices of data stored in spreadsheets: comm (species abundances [n = 68] or presences/ absences [n = 12]), traits (species traits), envir (environmental variables), and coord (spatial coordinates). Each dataset also includes a DataKey (description of the entries of the Data tables), a Notes sheet (contact information for the dataset, and, when relevant, processing information), a Species list, and a Site list. The grey components can be the original data matrices, and additional information and do not appear in all the datasets, depending on specific needs (see Methods - Data processing section).
We identified eligible datasets based on two strategies: 1. Literature search, aiming to initiate the database construction along a structured workflow, 2. Networking, aiming to extend the database and open the sharing possibilities, if the datasets fulfilled the CESTES requirements.
0 5 10 15 20 PlantsInsect s FishesBird s Macroin vertebratesSpider s Amphibians Flea MammalsCorals Microin verteb rates Phytoplankto n Protist s Taxonomic group Number of datasets 0 20 40 Terrestr ial Freshw ater Marine Ecosystem 0 10 20 Anthropic Mi xed Semi−natur al Natural
Level of human disturbance
Number of datasets 0 5 10 15 20 0.1 100.0 100,000.0 100,000,000.0 Extent (km2) ©OpenStreetMap contributors
Fig. 2 Overview of the CESTES database. Upper panel: Map of the 80 dataset locations over the globe (blue spots) (the orange smaller spots represent the 10 ancillary datasets from ceste, the non-spatial supplement of CESTES - see the Methods section); the four coloured polygons represent four datasets that are covering continental extents. The background world map is from OpenStreetMap contributors. Bottom panel: Bar plots and histogram describing the content of the database in terms of: study group, ecological realm, level of human disturbance, and spatial extent of the study.
The main condition for dataset eligibility was that the TER was the focus of the study and data use. This ensured that: 1. the trait and the taxonomic information were collected from similar biogeographic areas (mini-mizing mismatches between the geographic origins of trait and taxonomic data), 2. the sampled sites were asso-ciated with contextual environmental information that was relevant to the community and traits under study.
Literature search. We searched for multivariate trait-based studies published between 1996 and 2018 via a
sys-tematic literature search on the Clarivate Analytics Web of Science Core database. Following Leibold & Chase2,
we focussed on studies that included (in any of their contents) the following terms (including spelling variations): “RLQ”15 and “fourth-corner”22,23 because both of them are the predominant methods of multivariate trait-based
anal-yses in ecology24. The “RLQ” refers to a co-inertia analysis that summarizes the overall link between the three
matri-ces of species abundanmatri-ces/presenmatri-ces-absenmatri-ces (L), species traits (Q) and environment (R). The “fourth-corner” refers to a permutation analysis of these three matrices that tests individual trait-environment relationships. The use of RLQ and fourth-corner analyses on the datasets ensures that all of them: 1. are multivariate and include both several spe-cies, several traits, and several sites (potentially including spatial information) to align with a metacommunity-like structure, 2. have a comparable structure and can be used in comparative analyses and syntheses.
The search query was:
ALL = (“fourth-corner” OR “fourth corner” OR “fourthcorner” OR “RLQ”)
This search resulted in 368 papers.
Note that the “fourth corner” term more generally and commonly refers to the widely studied question of the links between trait and environment variations22. Most studies that look at TER, regardless of the method of
analysis they use, would often acknowledge the historical background of their question by referring in their paper to the “fourth corner problem”. Consequently, by including the “fourth corner” search term, we identified eligible multivariate datasets that were not necessarily analysed by fourth corner analysis/RLQ, but also by e.g. trait-based generalized linear/additive models25,26. However, although this literature search strategy was well suited for
iden-tifying sources of multivariate datasets, it could appear as too specific. In order to relax the constraints due to this specificity, we complemented the data search by a networking strategy (see Networking section).
Scanning strategy. Among the 368 studies resulting from the literature search, we scanned through the
Introduction and Methods sections. We selected the studies that used at least the three matrices of species abun-dances, or presences/absences across multiples sites (“comm”), corresponding environment information across sites (“envir”), and species trait information (“traits”). At first, we prioritized datasets that had spatial coordinates of the sampling sites (“coord”) because the spatial aspect is crucial for metacommunity research2. Spatial
coordi-nates, or the relative locations, could sometimes be reconstructed from the maps presented in the publications. Review and opinion papers, medical and simulation studies were not considered. Following this filter, we identi-fied a subset of 105 eligible datasets.
Networking. The network strategy took place in parallel to the data search and relied on both formal and
infor-mal communications and exchanges with colleagues through conferences, workshops, group meetings, emails, etc. This allowed us to identify new data providers, or new datasets that we had not found via the earlier literature search. From this networking, we identified an additional set of 34 potentially eligible datasets.
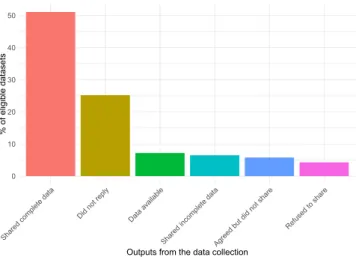
Dataset collection and request. From the total of 139 eligible datasets, 7.2% of the datasets were available on the
online supplementary materials of the publication. These were downloaded and formatted for CESTES’ purposes. When the datasets were not directly available, we sent a data request via email. In order to launch the CESTES database in a reasonable amount of time, we had to set time limits for the request phase, namely between January and August 2018. As a result, in total 96 authors were contacted, of whom 58% shared their data. In terms of datasets, more than 50% of the eligible datasets were shared and complete (Fig. 3). We also received ‘spontaneous’ datasets that were not part of our initial request, but fulfilled CESTES’ requirements and were thus included in the database. Out of the final complete 80 datasets, 55 were obtained via the literature search, and 25 were obtained from the networking strategy.
Because we received 10 valuable datasets that had no spatial coordinates, we decided to open the ceste sub-section of the CESTES database and populate it with these specific datasets. Some of them could be upgraded to CESTES database when the authors are able to provide the coordinates.
Data processing.
Dataset checking, cleaning and formatting. We downloaded and received datasets invar-ious formats (.doc, .pdf, .csv, .RData, .txt, .shp, etc.). Following Broman & Woo27, we harmonized and gathered
them in Excel files, one file per dataset. This was the most convenient storage format for creating multiple sheets (community, traits, environment, coordinates), handling heterogeneous types of information, and building meta-data specific to each meta-dataset. This storage solution also facilitated visual checking and cleaning of the meta-data records. CESTES provides both the processed and the unprocessed (i.e. original) datasets. The processed datasets include “comm”, “traits” and “envir”, i.e. with no empty sites, no “ghost” species (i.e. species that are recorded in none of the sites of the study area), and no NAs (Not Available information) in the matrices. NA removal was based on a compromise in the relative frequency of NAs in the rows and columns of each table; when too many sites compared to the sample size (e.g. >50% of the sites) had NAs for one single variable, this variable was removed, whereas when there were some sites (e.g. <30% of the sites) showing NAs for more than one variable, we removed those sites instead of removing the variables. Since CESTES is primarily designed for trait-based analyses, we removed a trait when it included too many NAs across species (i.e. when the trait value was NA
for more than 50% of the species in the community). Similarly, we removed species for which no, or too incom-plete trait information was available (i.e. when keeping the species would have implied to lose several traits). This was the case for 29 datasets out of the 80. The number of species removed varied from 1 to 209 species (mean = 27, median = 10, sd = 45) that represented from 1 to 72% of the initial species pool (mean = sd = 17%). (Note that this high maximum value is due to only one single dataset where trait data were exceptionally limiting and implied to remove an important number of species without trait information).
When this overall cleaning procedure implied removing any of the species, traits, or environmental variables, we kept the information of the original unprocessed tables within the Excel file in separate sheets. We named these sheets “commfull”, “traitsfull” and “envirfull”, respectively. Thus, the user can either directly use the processed sheets (“comm”, “traits” and “envir”), or the original ones and apply any other filtering strategies. In doing so, we make sure that CESTES is flexible depending on the users’ goals and needs.
Cleaning steps that altered the original dataset (other than formatting) are reported in the “Notes” sheet so that the user can trace back what has been done over the data processing.
When the data included several temporal horizons (sampling years, or seasons treated as different replicates in the original publication), we split them into different datasets for each time horizon to facilitate further analyses. This explains why several datasets can correspond to one single study area (see Online-only Table 1 attached to this manuscript, and the Data Records section).
Metadata preparation. All the entries from the four data sheets - “comm”, “trait”, “envir” and “coord” - were listed
and described in a “DataKey” sheet to describe the tables’ content (Fig. 4). This required a thorough examination of the original papers to extract the relevant information for every dataset. In several cases, we required additional exchanges with the data owners for clarifications. Any empty cell in the “DataKey” sheet reflects a lack of informa-tion. Importantly, this sheet should not substitute for reading of the original paper and we strongly recommend the users to thoroughly examine each paper before using the data (see Online-only Table 2).
Data records
Storage and formats used.
We stored the CESTES database via three different storage systems and two types of formats to provide the users with several alternatives in accessing and using the data.Storage
• Figshare repository: https://doi.org/10.6084/m9.figshare.c.4459637 28 -> the fixed version of the
data-base, and R scripts (original version 1.0).
• iDiv Biodiversity Portal: https://doi.org/10.25829/idiv.286-21-2695 29 under the Primary Data tab -> the upgraded versions of the database, and R scripts following the updates when new datasets are integrated.
Formats
A zipped folder called “CESTES.zip” includes two alternative formats for the CESTES database:
• a “xCESTES” folder that includes 80 Excel files (one file per dataset), each named according to the follow-ing structure: “AuthorPublicationYear.xlsx”.
• a “rCESTES” folder that includes the CESTES core processed database (comm, traits, envir, coord matri-ces) as an R list object “CESTES.RData” plus two R scripts, and two metadata tables for data processing and exploration (see Usage Notes section).
0 10 20 30 40 50
Shared complete data
Did not reply Data av ailable
Shared incomplete dat a
Agreed but did not shar
e
Refused to shar e
Outputs from the data collection
% of eligib
le dataset
s
Fig. 3 Success rates of the data search and request. Barplot showing the percentage of the different outputs from the data collection process. Percentages are calculated from a total of 139 datasets identified as eligible for the CESTES database (based on literature search and networking). Incomplete data mainly refer to the datasets that had no spatial coordinates (ceste), included unsolved issues, or provided insufficient metadata information. (“Agreed but did not share” refers to authors who replied positively to the first request but then never sent their data despite reminders because e.g., they did not find time to prepare the data).
The “CESTES.zip” folder also includes:
• an extended metadata table, “CESTES_metadata.xlsx”, that provides the general metadata information of all the datasets (i.e., combining the information from the Online-only Tables 1–2 of this Data Descriptor) • a tutorial document, “HOW_TO_SHARE_MY_DATA_FOR_CESTES.pdf”, that explains how to share
data for integrating future datasets in the database (see Supplementary File 1).
The original, unprocessed files as they were provided by the data owners (thus possibly in different formats, various structures, with possible mistakes, without metadata, etc.), are available by request to the corresponding author, AJ.
We would also encourage any potential data contributors to contact AJ with possible data (cestes@idiv.de). The specific guidelines on which types of data are eligible to integration in CESTES, and on how to structure the data, and metadata are provided in the Supplementary File 1, as well as at: https://icestes.github.io/sharedata. If the dataset fulfils CESTES’ requirements and is provided in the right format with the appropriate metadata information, it will be included in the database. Each time the database is updated through the iDiv Biodiversity portal (https://idata.idiv.de/), a new DOI will be generated for the whole updated database, ensuring the new contributors are acknowledged and become part of the ‘CESTES consortium’. This will allow storing the data on a permanent platform and prevent them from sinking into oblivion30.
Structure of the database and the datasets.
The 80 files currently in CESTES are structured into at least 8 sheets, depending on the original information and specificities of each dataset (Fig. 1).The first four sheets include the processed core-data themselves:
1. “comm”: matrix of species abundances (68) or presences/absences (12), with species in columns and sites in rows (species are sometimes OTUs in some groups such as phytoplankton, or genus in some groups such as macroinvertebrates, or morphospecies where relevant).
2. “traits”: matrix of species trait information, i.e. any trait, be it functional, biological, life-history traits, either quantitative or categorical, functional group, etc., with traits in columns and species in rows. 3. “envir”: matrix of environmental variables in the broad sense of environment, i.e. any type of biotic and
abiotic conditions or habitat characteristics relevant to the community of interest according to the original publication, with variables in columns and sites in rows.
4. “coord”: matrix of spatial coordinates, with X, the longitude and Y, the latitude as columns (in the Geo-graphical Coordinate System as used in the original study) and sites in rows.
In every dataset, a “DataKey” sheet provides a description of all the entries of the four matrices (Fig. 4). Specific comments and information about any alteration applied to the dataset can be found in the “Notes” sheet, e.g. the species, or variables that were removed due to missing information, how the trait values were averaged across species when several measurements were available, how the original dataset was split into several datasets
Fig. 4 “DataKey” structure and example of metadata information in CESTES datasets. A description is given when the variable full name is not self-explanatory or when potentially relevant information was available. Possible empty cells are due to lack of information that could not be recovered from the original publication nor from the data owners.
when there were several sampling periods, etc. The contact person for each dataset is also specified at the top of the “Notes” sheet of the dataset.
When the cleaning procedure implied changing the original datasets (see Data processing section above), we kept the information of the unaltered tables within the Excel file in separate sheets: “commfull”, “traitsfull”, “coordfull”, and/or “envirfull”.
The “splist” sheet includes the full list of taxa and the “sitelist” sheet, the list of sites. Both can provide addi-tional information about the species (e.g. taxonomic classification) and the sites (e.g. regional information) when specified by the authors. Note that the species (site) names might not appear in the “splist” (“sitelist”) of all the datasets; this is because some authors preferred to provide their data in a redacted form, for instance, by censoring the species or the site names. As this does not hamper most of the analyses in community ecology, these datasets were integrated in the database.
Finally, when trait information was semi-quantitative and already fuzzy coded, we added a sheet “blo” to specify the Blocks information that is needed for weighting procedures in some trait analyses31.
Description of the database.
The CESTES database includes 80 datasets that cover different areas of the globe, ecosystem types, taxonomic groups, and spatial extents (Fig. 1). An overview of these datasets is presented in the Online-only Table 1.ceste, the non-spatial ancillary to CEStES.
We provide access to 10 additional datasets that were not completely suitable for the CESTES database, due to the absence of spatial information or insufficient metadata but that were potentially valuable for their three other data matrices (see Online-only Table 3 attached to this manu-script). They follow the same structure as CESTES, except that they do not present the “coord” sheet and sometimes include only partial metadata. Some of the ceste datasets are likely to be enhanced in the near future and upgraded to the CESTES database as soon as they are made complete. ceste is stored in a zipped folder named “ceste.zip” that includes a series of 11 Excel files (10 data files + 1 metadata file) and can be found at the following links:• Figshare: https://doi.org/10.6084/m9.figshare.c.4459637
• -iDiv Biodiversity Portal: https://doi.org/10.25829/idiv.286-21-2695 (under the Attachments tab).
CEStES, a live database.
The current CESTES database is the starting point of a broader data-sharing project that aims to continue integrating new data as they become available, and as new contributors join the consortium by sharing their data.In order to maintain the CESTES database in the future, we set up three measures to facilitate the data exchange and communication about the database:
1. a project website that advertises the database project and fosters data sharing: https://icestes.github.io/, 2. a tutorial to guide people on how to share their data (Supp. Mat. 1; https://icestes.github.io/sharedata), 3. a designated email address where people can send their data and ask questions about the CESTES project
(cestes@idiv.de).
The data will be checked, curated, and integrated in the database through the iDiv Biodiversity Portal. This will update the database and generate a new DOI for the whole updated database, ensuring the new contributors are acknowledged.
Citation of the individual datasets and of the database.
Each CESTES and ceste dataset (CESTES10,15,32–94and ceste95–102) is associated with reference(s) that should be cited in addition to the CESTES database only if a
single or few specific datasets are used separately from the database. For instance, if one uses only Villéger’s datasets
(Villeger2012a, b, c, d, and e), one would have to cite Villéger’s original study10 (to acknowledge the study
ante-cedence), and the CESTES database28 (because it is through the CESTES database that the structured data and
metadata were made available). The list of citations for each dataset is provided in Online-only Table 2. See also CESTES29 for updated versions of the live database and follow the last news about the database via https://icestes.
github.io/posts/.
technical Validation
The technical validity of the CESTES database relies on five qualities pertaining to the datasets, and the over-all database: the datasets (1) have individuover-ally been subject to peer-review process, (2) have reliable sampling properties, (3) have been thoroughly checked and cleaned, are ready-to-use for analyses and accompanied with metadata information; and the database (4) has a wide taxonomic and geographical coverage, and (5) will keep on extending in the future.
peer-reviewed data and tEr relevance.
All the datasets included in CESTES had already been the sub-ject of publication(s) in peer reviewed scientific journals, or PhD theses (see Online-only Table 2). Therefore, each of the dataset has already received technical validation through both analysis and evaluation. In addition, since the focus of those studies was the species trait-environment relationships, the choice of the traits and environ-mental variables has already been the result of scientific reflection by the authors about the potential relevance of these variables with respect to the ecological context and the scale of study.reliable sample properties.
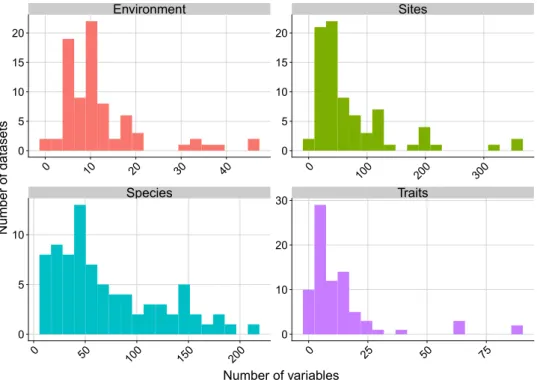
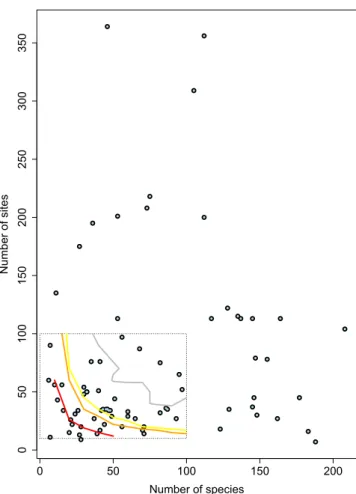
The datasets include an average of 71 sites, 72 species, 12 environmental var-iables, and 14 traits (Fig. 5 & Online-only Table 1). In the particular context of fourth-corner analysis, Dray & Legendre23 showed that datasets with fewer than 30 species need to have substantially more than 30 sites inorder for this multivariate method to perform well and detect existing TER. If we refer to the thresholds their simulation study found, we can say that 75% of the CESTES datasets can support multivariate analyses of a very good to good statistical power, i.e. have a Type II error risk of less than 10% (Fig. 6). The remaining 25% fall not far from the 30% limit, meaning that the risk of failing to detect significant TER although these exist is 30%. For these datasets, the users might need to be cautious if they intend to apply fourth-corner analysis and might need to consider other methods.
thorough data quality control and harmonized metadata information.
Each dataset has been the subject of thorough manual checking for matching between site, species and traits number and identity across the four data matrices, the absence of empty sites, “ghost” species, NAs, and the consistency between the data received and the original publication. All dataset alterations that we applied are reported in the “Notes” sheet of the dataset file. Therefore, we offer a clean database while keeping full transparency on the steps taken to this end. A large effort was also invested in reporting precise and harmonized metadata information for every dataset (Fig. 4) so that CESTES users can easily have a full overview of the type of data.Wide taxonomic and geographical coverage.
The geographical coverage of the database is global (Fig. 1) although as with most global compilations, there are clearly some regions of the world that are under-represented, including Africa, Asia, India, Russia, which is typical103. To evaluate whether we might have missedpotential datasets e.g., in Russia, we ran an additional literature search across a set of international journals spe-cialised in Russian ecology (namely, Russian Journal of Ecology, Russian Journal of Marine Biology and Russian Journal of Biological Invasions). We used as search terms the simple association of “traits” AND “environment”. We found very few trait-based studies, only five studies that were relevant to the CESTES database, and only one that had spatial coordinates and agreed to share their data. In addition, we found a dearth of studies from North America. One reason for this was that a related database project focussing on plants primarily in the Americas has recently emerged104. Authors of plant datasets from these regions were less likely to respond to data request (only
17 out of 35 responded). This might also explain why, although our criteria covered all realms and taxonomic groups, we have a relatively low representation of plant data (i.e., less than 30% of our database, Fig. 2b) despite their large representation in other databases.
Upgradeable and extendable database.
Importantly, the CESTES database is upgradeable. Anyone interested to share data of this type and contribute is welcome to do so by contacting the corresponding author (AJ, cestes@idiv.de). We will maintain and add to the CESTES database in the future to enrich it with more taxa, ecosystem types, and locations in the world. On the longer term, three possible and very valuable exten-sions could include (1) individual-based traits measurements, since intraspecific variation in traits can be highly valuable to study environmental tracking7,105,106, (2) temporal measurements of both traits, environment, andspecies abundances in order to study the temporal variability of the TER107, (3) phylogenies corresponding to the
recorded groups that would help draw inferences from community108 or macroecological patterns8. This would
Species Traits Environment Sites 0 50 100 150 200 0 25 50 75 0 10 20 30 40 0 100 200 300 0 5 10 15 20 0 10 20 30 0 5 10 15 20 0 5 10 Number of variables Number of datasets
Fig. 5 Data content of the CESTES database. Distribution of the number of environmental, site, species and trait variables across the datasets.
allow extending CESTES’ potential for synthesis work aiming to bridge metacommunity ecology, macroecology, and biodiversity-ecosystem functioning research.
Usage Notes
In complement to the Excel version of CESTES, the database has also been stored as an.RData object to facilitate its further use for analyses in R109. This object is a list of lists. Each element of the first order list refers to one
data-set, which itself is a list of four matrices; $comm, $envir, $traits and $coord.
First, this allows additional data processing. We set up R code routines (“CESTES_DataPrep.R”) that perform a thorough checking of the matrices, especially the match between the matrices’ dimensions, and the absence of empty sites, “ghost” species, and NAs.
The trait, environment, species, and coordinates variables were of mixed types (binary, categorical, ordinal, quantitative). To make the datasets properly readable and analysable by R, we made sure the numerical variables were treated as such by the program. We also re-coded the binary variables into 0/1 (numeric), the character and nominal variables into factors (this option can be turned off in the function), and, when relevant (i.e. when made explicit in the original publication), the numeric integer variables into ordinal variables (ordered factors).
Our R code routines generate data reports and send them to the working directory in the form of .txt files. These give the user different information on the “comm”, “traits”, “envir” and “coord” components of each dataset: list of variables and their types (factor, numeric, etc.), number of sites, species and traits, minimum and maximum value of the community data (that allows checking e.g., whether data are abundances or presences/absences).
The R code also applies some data transformation (e.g. scaling, Hellinger transformation, variable orthonor-malization), generates spatial predictors (e.g. Moran Eigenvector Maps) and calculates some usual trait diversity metrics (e.g. Community Weighted Means, functional dispersion).
0 50 100 150 200 05 0 100 150 200 250 300 350 Number of species Number of site s
Fig. 6 Power check of the CESTES datasets with respect to fourth-corner analysis’ requirements. After the Fig. 4a from Dray & Legendre23. Plot of the CESTES datasets (blue dots) according to their number of sites and number
of species compared to three power thresholds observed in the fourth-corner simulation study from Dray & Legendre23. The dashed rectangle represents the range of values tested in the simulations of Dray & Legendre23. The
curves represent their observed thresholds of Type II error rates - red = 30%, orange = 10%, yellow = 5%, grey = 0%. The datasets that fall below these thresholds are theoretically exposed to respectively 30%, 10%, 5% or 0% chance to fail to detect significant TERs with fourth-corner analysis although these exist. The figure shows that the majority of the CESTES datasets fall in a medium (70%) to very good (>95%) power zone (Power = 100% − Type II error).
For all these processing, transformation and calculations, we used several R packages, available on CRAN, mainly readxl, doBy, plyr, dplyr, and gdata for the data processing, vegan, ade4, stats for the data transformation,
ape and adespatial for the spatial processing, and picante and FD for the calculation of functional indices109.
All the R functions coded and used for the data preparation are provided in an R script “CESTES_DataPrep.R”. A fully processed and “ready-to-use” version of the CESTES database is stored as an .RData object called “CESTES.RData”.
Finally, further data plotting and metadata exploration are made possible via the R script “CESTES_Plots.R”, and the two metadata .csv files (“ListDat.csv”, “Metadat.csv”).
All these files (namely the database, the two R scripts, and the two metadata files) are stored in a zipped folder called “rCESTES.zip” in the “CESTES” folder at the following links:
• Figshare (fixed version): https://doi.org/10.6084/m9.figshare.c.4459637
• iDiv Biodiversity portal (evolutive version): https://doi.org/10.25829/idiv.286-21-2695 (under the Primary
Data tab).
The flexibility of the iDiv Biodiversity Portal storage will allow us to keep updating, extending and sustaining the CESTES database and the R scripts in the future.
Code availability
In addition to the Excel storage of the datasets, the CESTES database has also been stored as an.RData object to facilitate its further use for analyses in R109. It comes with R code scripts that allow further checking, processing,
transforming and exploring the database content (for more details, see the Usage Notes section). We provide all this information in a folder called “rCESTES.zip” within the “CESTES” folder at the following links:
• Figshare repository (fixed version): https://doi.org/10.6084/m9.figshare.c.4459637. • iDiv Biodiversity Portal (evolutive version): https://doi.org/10.25829/idiv.286-21-2695.
Received: 9 April 2019; Accepted: 2 December 2019; Published online: 08 January 2020
references
1. Vellend, M. The Theory of Ecological Communities (MPB-57). (Princeton University Press, 2016). 2. Leibold, M. A. & Chase, J. M. Metacommunity Ecology. (Princeton University Press, 2017).
3. Cadotte, M. W., Carscadden, K. & Mirotchnick, N. Beyond species: functional diversity and the maintenance of ecological processes and services. Journal of Applied Ecology 48, 1079–1087 (2011).
4. Lavorel, S. & Garnier, E. Predicting changes in community composition and ecosystem functioning from plant traits: revisiting the Holy Grail. Functional Ecology 16, 545–556 (2002).
5. McGill, B. J., Enquist, B. J., Weiher, E. & Westoby, M. Rebuilding community ecology from functional traits. Trends in Ecology &
Evolution 21, 178–185 (2006).
6. Cadotte, M. W., Arnillas, C. A., Livingstone, S. W. & Yasui, S.-L. E. Predicting communities from functional traits. Trends in Ecology
& Evolution 30, 510–511 (2015).
7. Funk, J. L. et al. Revisiting the Holy Grail: using plant functional traits to understand ecological processes. Biological Reviews 92, 1156–1173 (2017).
8. Devictor, V. et al. Spatial mismatch and congruence between taxonomic, phylogenetic and functional diversity: the need for integrative conservation strategies in a changing world. Ecology Letters 13, 1030–1040 (2010).
9. Meynard, C. N. et al. Beyond taxonomic diversity patterns: how do α, β and γ components of bird functional and phylogenetic diversity respond to environmental gradients across France? Global Ecology and Biogeography 20, 893–903 (2011).
10. Villéger, S., Miranda, J. R., Hernandez, D. F. & Mouillot, D. Low Functional β-Diversity Despite High Taxonomic β-Diversity among Tropical Estuarine Fish Communities. Plos One 7, e40679 (2012).
11. Flynn, D. F. B., Mirotchnick, N., Jain, M., Palmer, M. I. & Naeem, S. Functional and phylogenetic diversity as predictors of biodiversity—ecosystem-function relationships. Ecology 92, 1573–1581 (2011).
12. Mouillot, D., Graham, N. A. J., Villéger, S., Mason, N. W. H. & Bellwood, D. R. A functional approach reveals community responses to disturbances. Trends in Ecology & Evolution 28, 167–177 (2013).
13. Violle, C. et al. Let the concept of trait be functional! Oikos 116, 882–892 (2007). 14. Díaz, S. et al. The global spectrum of plant form and function. Nature 529, 167–171 (2016).
15. Dolédec, S., Chessel, D., ter Braak, C. J. F. & Champely, S. Matching species traits to environmental variables: a new three-table ordination method. Environmental and Ecological Statistics 3, 143–166 (1996).
16. Open Traits Network. Open Traits. Available at: opentraits.org (2018).
17. Schmidt-Kloiber, A. & Hering, D. An online tool that unifies, standardises and codifies more than 20,000 European freshwater
organisms and their ecological preferences. Ecological Indicators 53, 271–282, www.freshwaterecology.info (2015).
18. Trustees of the Natural History Museum, London. The PREDICTS project. PREDICTS, https://www.predicts.org.uk/ (2012).
19. Newbold, T. et al. call for data: PREDICTS: Projecting Responses of Ecological Diversity in Changing Terrestrial Systems. Frontiers
of Biogeography 4, 155–156 (2012).
20. Kattge, J. et al. TRY – a global database of plant traits. Global Change Biology 17, 2905–2935 (2011).
21. CESTES coll. CESTES - A global database for metaCommunity Ecology: Species, Traits, Environment and Space. CESTES, https://
icestes.github.io/ (2019).
22. Legendre, P., Galzin, R. & Harmelin-Vivien, M. L. Relating Behavior to Habitat: Solutions to The fourth-Corner Problem. Ecology
78, 547–562 (1997).
23. Dray, S. & Legendre, P. Testing the Species Traits–Environment Relationships: The Fourth-Corner Problem Revisited. Ecology 89, 3400–3412 (2008).
24. Kleyer, M. et al. Assessing species and community functional responses to environmental gradients: which multivariate methods?
Journal of Vegetation Science 23, 805–821 (2012).
25. Ovaskainen, O. et al. How to make more out of community data? A conceptual framework and its implementation as models and software. Ecology Letters 20, 561–576 (2017).
26. Brown, A. M. et al. The fourth-corner solution – using predictive models to understand how species traits interact with the environment. Methods in Ecology and Evolution 5, 344–352 (2014).
27. Broman, K. W. & Woo, K. H. Data Organization in Spreadsheets. The American Statistician 72, 2–10 (2018).
28. Jeliazkov, A. et al. CESTES – A global database for metaCommunity Ecology: Species, Traits, Environment and Space. figshare, https://doi.org/10.6084/m9.figshare.c.4459637 (2019).
29. Jeliazkov A. & the CESTES consortium. A global database for metaCommunity Ecology: Species, Traits, Environment and Space
- version 1.0 (CESTES v1.0). iDiv Biodiversity Portal, https://doi.org/10.25829/idiv.286-21-2695 (2019).
30. Whitlock, M. C. Data archiving in ecology and evolution: best practices. Trends in Ecology & Evolution 26, 61–65 (2011). 31. Chevenet, F., Dolédec, S. & Chessel, D. A fuzzy coding approach for the analysis of long-term ecological data. Freshwater Biology
31, 295–309 (1994).
32. Bagaria, G., Pino, J., Rodà, F. & Guardiola, M. Species traits weakly involved in plant responses to landscape properties in Mediterranean grasslands. Journal of Vegetation Science 23, 432–442 (2012).
33. Barbaro, L., Brockerhoff, E. G., Giffard, B. & van Halder, I. Edge and area effects on avian assemblages and insectivory in fragmented native forests. Landscape Ecology 27, 1451–1463 (2012).
34. Barbaro, L. et al. Avian pest control in vineyards is driven by interactions between bird functional diversity and landscape heterogeneity. Journal of Applied Ecology 54, 500–508 (2017).
35. Barbaro, L. & van Halder, I. Linking bird, carabid beetle and butterfly life‐history traits to habitat fragmentation in mosaic landscapes. Ecography 32, 321–333 (2009).
36. Bartonova, A., Benes, J., Fric, Z. F., Chobot, K. & Konvicka, M. How universal are reserve design rules? A test using butterflies and their life history traits. Ecography 39, 456–464 (2016).
37. Bonada, N., Rieradevall, M. & Prat, N. Macroinvertebrate community structure and biological traits related to flow permanence in a Mediterranean river network. Hydrobiologia 589, 91–106 (2007).
38. Brind’Amour, A., Boisclair, D., Dray, S. & Legendre, P. Relationships between species feeding traits and environmental conditions in fish communities: a three-matrix approach. Ecological Applications 21, 363–377 (2011).
39. Campos, R. et al. Factors affecting the metacommunity structure of periphytic ostracods (Crustacea, Ostracoda): a deconstruction approach based on biological traits. Aquatic Sciences 80, 16 (2018).
40. Carvalho, R. A. & Tejerina-Garro, F. L. The influence of environmental variables on the functional structure of headwater stream fish assemblages: a study of two tropical basins in Central Brazil. Neotropical Ichthyology 13, 349–360 (2015).
41. Castro, H., Lehsten, V., Lavorel, S. & Freitas, H. Functional response traits in relation to land use change in the Montado.
Agriculture, Ecosystems & Environment 137, 183–191 (2010).
42. Charbonnier, Y. M. et al. Bat and bird diversity along independent gradients of latitude and tree composition in European forests.
Oecologia 182, 529–537 (2016).
43. Chmura, D., Żarnowiec, J. & Staniaszek-Kik, M. Interactions between plant traits and environmental factors within and among montane forest belts: A study of vascular species colonising decaying logs. Forest Ecology and Management 379, 216–225 (2016). 44. Choler, P. Consistent Shifts in Alpine Plant Traits along a Mesotopographical Gradient. Arctic, Antarctic, and Alpine Research 37,
444–453 (2005).
45. Chong-Seng, K. M., Mannering, T. D., Pratchett, M. S., Bellwood, D. R. & Graham, N. A. J. The Influence of Coral Reef Benthic Condition on Associated Fish Assemblages. Plos One 7, e42167 (2012).
46. Cleary, D. F. R. et al. Variation in the composition of corals, fishes, sponges, echinoderms, ascidians, molluscs, foraminifera and macroalgae across a pronounced in-to-offshore environmental gradient in the Jakarta Bay–Thousand Islands coral reef complex.
Marine Pollution Bulletin 110, 701–717 (2016).
47. Cleary, D. F. R. et al. Bird species and traits associated with logged and unlogged forest in Borneo. Ecological Applications 17, 1184–1197 (2007).
48. Cleary, D. F. R. & Renema, W. Relating species traits of foraminifera to environmental variables in the Spermonde Archipelago, Indonesia. Marine Ecology Progress Series 334, 73–82 (2007).
49. Cornwell, W. K. & Ackerly, D. D. Community assembly and shifts in plant trait distributions across an environmental gradient in coastal California. Ecological Monographs 79, 109–126 (2009).
50. Drew, J. A. & Amatangelo, K. L. Community assembly of coral reef fishes along the Melanesian biodiversity gradient. Plos One 12 (2017).
51. Drew, J. A. & Amatangelo, K. L. Community assembly of coral reef fishes along the Melanesian biodiversity gradient. figshare, https://doi.org/10.1371/journal.pone.0186123 (2017).
52. Dziock, F. et al. Reproducing or dispersing? Using trait based habitat templet models to analyse Orthoptera response to flooding and land use. Agriculture, Ecosystems & Environment 145, 85–94 (2011).
53. Eallonardo, A. S., Leopold, D. J., Fridley, J. D. & Stella, J. C. Salinity tolerance and the decoupling of resource axis plant traits.
Journal of Vegetation Science 24, 365–374 (2013).
54. Farneda, F. Z. et al. Trait-related responses to habitat fragmentation in Amazonian bats. Journal of Applied Ecology 52, 1381–1391 (2015).
55. Frenette-Dussault, C., Shipley, B. & Hingrat, Y. Linking plant and insect traits to understand multitrophic community structure in arid steppes. Functional Ecology 27, 786–792 (2013).
56. Frenette-Dussault, C., Shipley, B., Léger, J.-F., Meziane, D. & Hingrat, Y. Functional structure of an arid steppe plant community reveals similarities with Grime’s C-S-R theory. Journal of Vegetation Science 23, 208–222 (2012).
57. Fried, G., Kazakou, E. & Gaba, S. Trajectories of weed communities explained by traits associated with species’ response to management practices. Agriculture, Ecosystems & Environment 158, 147–155 (2012).
58. Gallardo, B., Gascon, S., Garcia, M. & Comin, F. A. Testing the response of macroinvertebrate functional structure and biodiversity to flooding and confinement. Journal of limnology 68, 315–326 (2009).
59. Gibb, H. et al. Responses of foliage-living spider assemblage composition and traits to a climatic gradient in Themeda grasslands: Spider Traits and Climatic Gradients. Austral Ecology 40, 225–237 (2015).
60. Gonçalves-Souza, T., Brescovit, A. D., de C. Rossa-Feres, D. & Romero, G. Q. Bromeliads as biodiversity amplifiers and habitat segregation of spider communities in a Neotropical rainforest. The Journal of Arachnology 38, 270–279 (2010).
61. Gonçalves-Souza, T., Romero, G. Q. & Cottenie, K. Metacommunity versus Biogeography: A Case Study of Two Groups of Neotropical Vegetation-Dwelling Arthropods. Plos One 9, e115137 (2014).
62. Jamil, T., Ozinga, W. A., Kleyer, M. & ter Braak, C. J. F. Selecting traits that explain species-environment relationships: a generalized linear mixed model approach. Journal of Vegetation Science 24, 988–1000 (2013).
63. Jeliazkov, A. Scale-effects in agriculture-environment-biodiversity relationships. (Université Pierre et Marie Curie, 2013).
64. Jeliazkov, A. et al. Level-dependence of the relationships between amphibian biodiversity and environment in pond systems within an intensive agricultural landscape. Hydrobiologia 723, 7–23 (2014).
65. Kadlec, T., Benes, J., Jarosik, V. & Konvicka, M. Revisiting urban refuges: Changes of butterfly and burnet fauna in Prague reserves over three decades. Landscape and Urban Planning 85, 1–11 (2008).
66. Klaiber, J. et al. Fauna Indicativa. (Eidg. Forschungsanstalt für Wald, Schnee und Landschaft WSL, CH-Birmensdorf, 2017). 67. Konvicka, M. & Kadlec, T. How to increase the value of urban areas for butterfly conservation? A lesson from Prague nature
reserves and parks. European Journal of Entomology 108, 219–229 (2011).
68. Krasnov, B. R. et al. Assembly rules of ectoparasite communities across scales: combining patterns of abiotic factors, host composition, geographic space, phylogeny and traits. Ecography 38, 184–197 (2015).
69. Lowe, E. C., Threlfall, C. G., Wilder, S. M. & Hochuli, D. F. Environmental drivers of spider community composition at multiple scales along an urban gradient. Biodiversity Conservation 27, 829–852 (2018).
70. Marteinsdóttir, B. & Eriksson, O. Plant community assembly in semi-natural grasslands and ex-arable fields: a trait-based approach. Journal of Vegetation Science 25, 77–87 (2014).
71. Meffert, P. J. & Dziock, F. The influence of urbanisation on diversity and trait composition of birds. Landscape Ecology 28, 943–957 (2013).
72. Mellado-Diaz, A., Luisa Suarez Alonso, M. & Rosario Vidal-Abarca Gutierrez, M. Biological traits of stream macroinvertebrates from a semi-arid catchment: patterns along complex environmental gradients. Freshwater Biology 53, 1–21 (2008).
73. Ossola, A., Nash, M. A., Christie, F. J., Hahs, A. K. & Livesley, S. J. Urban habitat complexity affects species richness but not environmental filtering of morphologically-diverse ants. PeerJ 3, e1356 (2015).
74. Pakeman, R. J. Multivariate identification of plant functional response and effect traits in an agricultural landscape. Ecology 92, 1353–1365 (2011).
75. Pavoine, S., Vela, E., Gachet, S., de Bélair, G. & Bonsall, M. B. Linking patterns in phylogeny, traits, abiotic variables and space: a novel approach to linking environmental filtering and plant community assembly: Multiple data in community organization.
Journal of Ecology 99, 165–175 (2011).
76. Pekin, B. K., Wittkuhn, R. S., Boer, M. M., Macfarlane, C. & Grierson, P. F. Plant functional traits along environmental gradients in seasonally dry and fire-prone ecosystem. Journal of Vegetation Science 22, 1009–1020 (2011).
77. Pomati, F. et al. Individual Cell Based Traits Obtained by Scanning Flow-Cytometry Show Selection by Biotic and Abiotic Environmental Factors during a Phytoplankton Spring Bloom. Plos One 8, e71677 (2013).
78. Purschke, O., Sykes, M. T., Reitalu, T., Poschlod, P. & Prentice, H. C. Linking landscape history and dispersal traits in grassland plant communities. Oecologia 168, 773–783 (2012).
79. Rachello-Dolmen, P. G. & Cleary, D. F. R. Relating coral species traits to environmental conditions in the Jakarta Bay/Pulau Seribu reef system, Indonesia. Estuarine, Coastal and Shelf Science 73, 816–826 (2007).
80. Raevel, V., Violle, C. & Munoz, F. Mechanisms of ecological succession: insights from plant functional strategies. Oikos 121, 1761–1770 (2012).
81. Ribera, I., Dolédec, S., Downie, I. S. & Foster, G. N. Effect of Land Disturbance and Stress on Species Traits of Ground Beetle Assemblages. Ecology 82, 1112–1129 (2001).
82. Robinson, N., Kadlec, T., Bowers, M. D. & Guralnick, R. P. Integrating species traits and habitat characteristics into models of butterfly diversity in a fragmented ecosystem. Ecological Modelling 281, 15–25 (2014).
83. Robroek, B. J. M. et al. Taxonomic and functional turnover are decoupled in European peat bogs. Nature Communications 8, 1161 (2017).
84. Robroek, B. et al. Data from: Taxonomic and functional turnover are decoupled in European peat bogs. Dryad Digitial Repository, https://doi.org/10.5061/dryad.g1pk3 (2017).
85. Shieh, S.-H., Wang, L.-K. & Hsiao, W.-F. Shifts in Functional Traits of Aquatic Insects along a Subtropical Stream in Taiwan.
Zoological Studies 51, 1051–1065 (2012).
86. Spake, R., Barsoum, N., Newton, A. C. & Doncaster, C. P. Drivers of the composition and diversity of carabid functional traits in UK coniferous plantations. Forest Ecology and Management 359, 300–308 (2016).
87. Urban, M. C. Disturbance heterogeneity determines freshwater metacommunity structure. Ecology 85, 2971–2978 (2004). 88. van Klink, R. et al. No detrimental effects of delayed mowing or uncut grass refuges on plant and bryophyte community structure
and phytomass production in low-intensity hay meadows. Basic and Applied Ecology 20, 1–9 (2017).
89. van Klink, R. et al. Larval and phenological traits predict invertebrate community response to mowing regime manipulations. Ecological Applications, e01900 (2019).
90. Westgate, M. J., Driscoll, D. A. & Lindenmayer, D. B. Can the intermediate disturbance hypothesis and information on species traits predict anuran responses to fire? Oikos 121, 1516–1524 (2012).
91. Yates, M. L., Andrew, N. R., Binns, M. & Gibb, H. Morphological traits: predictable responses to macrohabitats across a 300 km scale. PeerJ 2, e271 (2014).
92. De Bélair, G. & Bencheikh-Lehocine, M. Composition et déterminisme de la végétation d’une plaine côtière marécageuse: La Mafragh (Annaba, Algérie). Bulletin d’Ecologie 18, 393–407 (1987).
93. Dray, S. & Dufour, A.-B. The ade4 package: implementing the duality diagram for ecologists. Journal of Statistical Software 1–20 (2007).
94. Cleary, D. F. R. et al. Bird species and traits associated with logged and unlogged forest in Borneo. figshare, https://doi.org/10.6084/
m9.figshare.c.3293726.v1 (2016).
95. Belskaya, E. A. & Zolotarev, M. P. Changes in the size structure of carabid communities in forest ecosystems under technogenic transformation. Russian Journal of Ecology 48, 152–160 (2017).
96. Cleary, D. F. R. et al. Variation in the diversity and composition of benthic taxa as a function of distance offshore, depth and exposure in the Spermonde Archipelago, Indonesia. Estuarine, Coastal and Shelf Science 65, 557–570 (2005).
97. Cormont, A., Vos, C., van Turnhout, C., Foppen, R. & ter Braak, C. Using life-history traits to explain bird population responses to changing weather variability. Climate Research 49, 59–71 (2011).
98. de Voogd, N. J. & Cleary, D. F. R. Relating species traits to environmental variables in Indonesian coral reef sponge assemblages.
Marine and Freshwater Research 58, 240–249 (2007).
99. Huebner, K., Lindo, Z. & Lechowicz, M. J. Post-fire succession of collembolan communities in a northern hardwood forest.
European Journal of Soil Biology 48, 59–65 (2012).
100. Jamil, T., Kruk, C. & ter Braak, C. J. F. A unimodal species response model relating traits to environment with application to phytoplankton communities. Plos One 9, e97583 (2014).
101. Jamil, T., Opdekamp, W., van Diggelen, R. & ter Braak, C. J. F. Trait-Environment Relationships and Tiered Forward Model Selection in Linear Mixed Models. International Journal of Ecology 2012, 1–12 (2012).
102. Palozzi, J. E. & Lindo, Z. Boreal peat properties link to plant functional traits of ecosystem engineers. Plant Soil 418, 277–291 (2017).
103. Meyer, C., Weigelt, P. & Kreft, H. Multidimensional biases, gaps and uncertainties in global plant occurrence information. Ecology
Letters 19, 992–1006 (2016).
104. Engemann, K. et al. A plant growth form dataset for the New World. Ecology 97, 3243–3243 (2016).
105. Messier, J., McGill, B. J. & Lechowicz, M. J. How do traits vary across ecological scales? A case for trait-based ecology. Ecology
Letters 13, 838–848 (2010).
106. Violle, C. et al. The return of the variance: intraspecific variability in community ecology. Trends in Ecology & Evolution 27, 244–252 (2012).
107. Rosbakh, S., Bernhardt-Römermann, M. & Poschlod, P. Elevation matters: contrasting effects of climate change on the vegetation development at different elevations in the Bavarian Alps. Alpine Botany 124, 143–154 (2014).
108. Gianuca, A. T. et al. Integrating trait and phylogenetic distances to assess scale-dependent community assembly processes.
Ecography 40, 742–752 (2017).
acknowledgements
This work was funded by the German Centre for Integrative Biodiversity Research (iDiv) Halle-Jena-Leipzig (funded by the German Research Foundation; DFG FZT 118). We thank Jitendra Gaikwad for his precious help with the technical aspects of the database storage and management through the iDiv Biodiversity Portal (https:// idata.idiv.de/, https://doi.org/10.25829/idiv.286-21-2695) and the iDiv IT Support for their help in the CESTES website development (https://icestes.github.io/). The datasets provided by A. Jeliazkov were collected with financial support from the Fédération d’Ile-de-France pour la Recherche en Environnement (FIRE FR-3020). The dataset provided by R. Carvalho and F.L. Tejerina-Garro had financial support from the Conselho Nacional de Desenvolvimento Científico e Tecnológico (CNPq No. 471283/2006-1) granted to FLTG. The datasets provided by R. van Klink, J.-Y. Humbert, R. Arlettaz and M.H.M. Menz were collected with financial support from the Swiss National Science Foundation (grants 31003A_125398/2 and 31003A_149656) awarded to RA.
author contributions
Jonathan Chase (J.C.) and Alienor Jeliazkov (A.J.) conceived the idea of the database, developed the project, and did the literature search. A.J. gathered, cleaned and harmonized the data. A.J. and Darko Mijatovic (D.M.) prepared the metadata. A.J. organised and compiled the database, coded all the R code routines and drafted the manuscript. A.J. and Stéphane Chantepie (S.C.) built the CESTES website. All authors contributed with data and revisions to the manuscript.
Competing interests
The authors declare no competing interests.
additional information
Supplementary information is available for this paper at https://doi.org/10.1038/s41597-019-0344-7.
Correspondence and requests for materials should be addressed to A.J.
Reprints and permissions information is available at www.nature.com/reprints.
Publisher’s note Springer Nature remains neutral with regard to jurisdictional claims in published maps and
institutional affiliations.
Open Access This article is licensed under a Creative Commons Attribution 4.0 International
License, which permits use, sharing, adaptation, distribution and reproduction in any medium or format, as long as you give appropriate credit to the original author(s) and the source, provide a link to the Cre-ative Commons license, and indicate if changes were made. The images or other third party material in this article are included in the article’s Creative Commons license, unless indicated otherwise in a credit line to the material. If material is not included in the article’s Creative Commons license and your intended use is not per-mitted by statutory regulation or exceeds the perper-mitted use, you will need to obtain permission directly from the copyright holder. To view a copy of this license, visit http://creativecommons.org/licenses/by/4.0/.
The Creative Commons Public Domain Dedication waiver http://creativecommons.org/publicdomain/zero/1.0/ applies to the metadata files associated with this article.
© The Author(s) 2020