Publisher’s version / Version de l'éditeur:
Vous avez des questions? Nous pouvons vous aider. Pour communiquer directement avec un auteur, consultez la première page de la revue dans laquelle son article a été publié afin de trouver ses coordonnées. Si vous n’arrivez pas à les repérer, communiquez avec nous à [email protected].
Questions? Contact the NRC Publications Archive team at
[email protected]. If you wish to email the authors directly, please see the first page of the publication for their contact information.
https://publications-cnrc.canada.ca/fra/droits
L’accès à ce site Web et l’utilisation de son contenu sont assujettis aux conditions présentées dans le site LISEZ CES CONDITIONS ATTENTIVEMENT AVANT D’UTILISER CE SITE WEB.
Journal of Materials Science Letters, 21, 22, pp. 1773-1775, 2002-11-15
READ THESE TERMS AND CONDITIONS CAREFULLY BEFORE USING THIS WEBSITE. https://nrc-publications.canada.ca/eng/copyright
NRC Publications Archive Record / Notice des Archives des publications du CNRC :
https://nrc-publications.canada.ca/eng/view/object/?id=3c8ed214-278e-46f0-8a02-658a46603cd4 https://publications-cnrc.canada.ca/fra/voir/objet/?id=3c8ed214-278e-46f0-8a02-658a46603cd4
NRC Publications Archive
Archives des publications du CNRC
This publication could be one of several versions: author’s original, accepted manuscript or the publisher’s version. / La version de cette publication peut être l’une des suivantes : la version prépublication de l’auteur, la version acceptée du manuscrit ou la version de l’éditeur.
For the publisher’s version, please access the DOI link below./ Pour consulter la version de l’éditeur, utilisez le lien DOI ci-dessous.
https://doi.org/10.1023/A:1020937224402
Access and use of this website and the material on it are subject to the Terms and Conditions set forth at
Sucrose synthesis of nanoparticulate alumina
Sucrose synthesis of nanoparticulate alumina
Mitchell, L.D.; Whitfield, P.S.; Margeson, J.;
Beaudoin, J.J.
A version of this document is published in / Une version de ce document se trouve dans : Journal of Materials Science Letters, v. 21, no. 22, Nov. 15, 2002, pp. 1773-1775
www.nrc.ca/irc/ircpubs
J O U R N A L O F M A T E R I A L S S C I E N C E L E T T E R S 2 1, 2 0 0 2, 1773 – 1775
Sucrose synthesis of nanoparticulate alumina
L . D . M I T C H E L L , P . S . W H I T F I E L D ∗, J . M A R G E S O N , J . J . B E A U D O I N
Institute for Research in Construction, ∗Institute for Chemical Process and Environmental Technology, National Research Council Canada, Montreal Road, Ottawa ON K1A 0R6, Canada
E-mail: [email protected]
The synthesis of nanoparticulate α-Al2O3at 600◦C us-ing a sucrose-based polymer dispersion technique was reported recently by Das et al. [1]. This is of interest, as γ-Al2O3is frequently an unwanted intermediate phase in the conversion of nanoparticulate amorphous alu-mina into nanoparticulate α-Al2O3. γ -Al2O3has a rela-tively disordered structure, but usually requires temper-atures in the order of 1100◦C to transform completely to the stable α-Al2O3phase [2].
Dispersion of cations in a polymer matrix has been widely used as a “chimie douce” method for the pro-duction of oxide materials at low temperatures. The “Pechini” process, where citric acid and ethylene gly-col are co-polymerized to form a resin is a particularly common variant [3]. A highly acidic sucrose solution can self-polymerize or cross-link with polyvinyl alco-hol (PVA) to form a heavier and more 3 dimensional resin [4]. The charred polymer also acts as a fuel dur-ing calcination, raisdur-ing the local temperature briefly to much higher temperatures than the equilibrium temper-ature in the furnace.
The extent of cation dispersion in a matrix has been seen to affect phase composition and crystallite size in other systems [3]. Consequently a study was under-taken to ascertain the effect of drastically increasing the dispersion of Al3+ cations in the matrix by increasing the sucrose content. This would be expected to increase the surface area of the material, but as the sucrose : Al3+ molar ratio is greater than 18 : 1, calcining at 600◦C should still produce α-Al2O3according to the hypoth-esis of Das et al. [1].
The resin was produced by adding 250 ml of 10 M su-crose solution acidified to a pH of approximately 1 with nitric acid, to 3.75 g of Al(NO3)3·9H2O. This formula-tion yielded a 250 : 1 molar ratio. The intimate mixture was caramelized on a hot plate at approximately 250◦C to reduce the aqueous solution to a thick syrup. After-wards, it was placed in an air-circulating oven at 200◦C for 18 h resulting in a dehydrated charred resin. The re-sulting carbon-rich precursor was calcined in a muffle furnace at 600◦C for 24 h to produce the aluminum oxide material.
Samples of this material were further calcined in a zirconia crucible in air at temperatures of 1050, 1150 and 1250◦C to examine the ease of α-Al2O3formation from this very high surface area γ -Al2O3.
X-ray diffraction data were obtained using a Bruker D8 diffractometer equipped with a HISTAR 2-dimensional area detector at a sample-detector distance of 15.3 cm. The tube angle was fixed at 10◦ using a
1 mm diameter snout collimator, and frames taken us-ing Cu Kα radiation at detector angles of 15, 30 and 45◦for 30 min durations. The samples were mounted on a quartz zero background holder. 1-D powder pat-terns were obtained by integrating the 2-D data across a fixed chi range, and merging the three resulting pat-terns into one. The instrument broadening function was determined by obtaining frames from the NIST 660a LaB6 standard, and crystallite size obtained by peak fitting with the Bruker TOPAS software [5].
Scanning electron microscope (SEM) micrographs were taken of the alumina using a Cambridge Stere-oscan 250. Samples were prepared with carbon adhe-sives on aluminum stubs, and then sputter-coated with gold. The surface area values of the powders were ob-tained using BET analysis with nitrogen gas as the ab-sorbate. A Quantachrome Quantasorb system was used for the sorption measurements.
After calcination of the charred precursor at 600◦C, the material obtained was a white, fluffy powder with a very low density. On examination of this material by SEM, a foil-like microstructure (Fig. 1) was observed. This microstructure probably resulted from preferen-tial growth around the resin pore surfaces. Attempts to resolve the individual particles with a high resolution Field emission gun (FEG) SEM tentatively suggested a particle size of 10–20 nm, however it was not possible to obtain well-resolved images due to charging of the sample.
The surface area of the material was found to be approximately 290 m2/g, as opposed to the 194 m2/g reported by Das et al. [1]. Given the greater organic content in this precursor, this increase was not unex-pected, but may be of interest given the use of γ -Al2O3 as a catalyst support.
X-ray diffraction of the 600◦C material yielded a poor crystalline pattern (Fig. 2), which could be as-signed as γ -Al2O3. Firing at 1050◦C for 30 min yielded a more ordered γ -Al2O3pattern, while firing for 60 min gave rise to a number of spots corresponding to a few crystallites of α-Al2O3. The significance of spots in a frame is discussed below. Increasing the temperature to 1150◦C for 60 min led to the formation of a two phase mixture of γ -Al2O3and nanocrystalline α-Al2O3 pow-der with a 17.5 nm crystallite size. Firing at 1250◦C for 60 min led to the formation of 25 nm α-Al2O3with β-Al2O3 present as a minor phase. β-Al2O3 does not exist as a pure alumina polymorph [6], so the presence of β-Al2O3 could be due to trace sodium impurities, producing phases such as NaAl11O17.
Figure 1 SEM micrograph of the 600◦C calcined “as-prepared” alumina.
The transition to α-Al2O3seemed to be more slug-gish in this material than has been observed by other workers [7, 8]. This was not totally unexpected, as the material density of γ -Al2O3has been shown to affect the transition, i.e. dense pellets transform to α-Al2O3 faster than a loose powder [9]. There are possible indi-cations of the presence of the δ-Al2O3and/or θ -Al2O3 phases in the 1050 and 1150◦calcined materials from some peak broadening and “shoulders”. These known intermediate phases, often seen in the γ - to α-Al2O3 phase transition, have similar diffraction patterns to γ -Al2O3, but the experimental reflections are very diffuse, making it very difficult to assign peaks unambiguously. Use of the area detector facilitated observation of a small number of large isolated nucleating crystallites that would probably have been overlooked by conven-tional powder diffraction. Such spots appear in a 2-D
Figure 2 1-D X-ray diffraction patterns of the “as-prepared” and cal-cined materials.
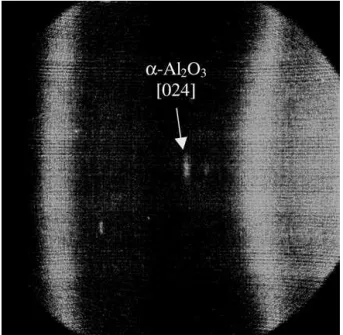
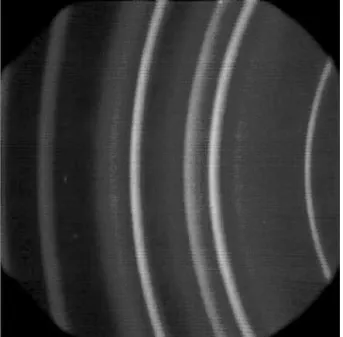
frame effectively as a single crystal reflection spot. Ro-tating the sample moves the spot, while remounting the sample can give rise to different reflections. For exam-ple, a spot corresponding to the 52.6◦ [024] α-Al2O3 reflection was observed in the as-prepared powder as seen in Fig. 3. In this case the spot was within the range of chi integration, so a small reflection is present in Fig. 2 at the corresponding 2 theta. For comparison, Fig. 4 shows the 23–56◦2 theta frame of the 1150◦C calcined powder which shows a uniform, untextured powder with a good powder average.
In summary, a dispersed alumina with a very high surface area has been prepared by complexation and
Figure 3 2-D frame from the as-prepared sample in the range 38–70◦
2 theta.
Figure 4 2-D frame from the 1150◦C calcined sample in the range 23–
56◦ 2 theta, showing the uniform sharp α-Al
2O3 arcs with the more
diffuse γ -Al2O3 also visible. There are no visible spots indicating a
uniform sample.
dispersion in a sucrose solution, which was then charred and calcined to produce the final product. The material calcined at 600◦C in this study differed from that de-scribed by Das et al. [1], in that it was poor crystalline γ-Al2O3and had a much higher surface area, although it did appear to contain isolated α-Al2O3 crystallites. These differences may be explained by the use of a much higher sucrose to cation ratio. The resin in this study was produced using more uniform heating than that attainable using a hotplate alone, which in turn produced a more homogeneous resin. The hypothesis proposed by Das et al. [1] is not supported by the
re-sults presented here, but the synthesis conditions used were far removed (over 1 order of magnitude increase in the sucrose excess) from those used by Das et al. The sluggish transition between γ - and α-Al2O3may also be attributed to the extremely low density of the material [9]. Heating at 1050◦C yielded an increasing number of diffraction spots from α-Al2O3crystallites, conventional α-Al2O3powder diffraction arcs appear-ing at 1150◦C. Calcination at 1250◦C resulted in a fluffy powder of α-Al2O3with a crystallite size of ap-proximately 25 nm.
Acknowledgment
The authors would like to thank Dr. Isobel Davidson for discussions and assistance during the preparation of this manuscript. References 1. R. N. D A S,A. B A N D Y O P A D H Y A YandS. B O S E, J. Amer. Cer. Soc. 84(2001) 2421. 2. I. L E V I NandD. B R A N D O N, ibid 81 (1998) 1995. 3. P. A. L E S S I N G, Ceramic Bulletin 68 (1989) 1002. 4. R. N. D A S, Materials Letters 47 (2001) 344.
5. User Manual, TOPAS V2.0: General profile and structure analysis software for powder diffraction data, Karlsruhe, Germany, (2000). 6. A. R. W E S T, in “Solid State Chemistry and Its Applications”
(Wi-ley, Chichester, 1984) p. 467.
7. A. J A N B E Y,R. K. P A T I,S. T A H I RandP. P R A M A N I K,
Journal of the European Ceramic Society 21(2001) 2285. 8. Y. W U,Y. Z H A N G,G. P E Z Z O T T I andJ. G U O, Materials
Letters 52(2002) 366.
9. J. -P. A H N,J. -K.P A R KandH. -W. L E E, Nanostructured
Ma-terials 11(1999) 133.
Received 13 May
and accepted 16 July 2002